CEO Overconfidence and Fair Value Reporting-the
Moderating Effect of Corporate Governance
Hui-Wen Hsu1
Department of Public Finance, Feng Chia University
No. 100, Wenhwa Rd., Seatwen, Taichung City 407, Taiwan
Tel: 886-4-2451-7250ext.4322 E-mail: [email protected]
Received: Jan. 22, 2017 Accepted: February 25, 2017 Published: June 1, 2017
doi:10.5296/ajfa.v9i1.10763 URL: https://doi.org/10.5296/ajfa.v9i1.10763
Abstract
This project examines whether CEO overconfidence affects firm's fair value reporting. Moreover, prior literature indicates effective corporate governance mechanisms ameliorate the adverse impact of CEO overconfidence. Thus, this paper further investigates whether effective corporate governance will mitigate the association between CEO overconfidence and level 3 fair values. Using a US sample drawn from 2008 to 2011, the results of this paper show that firms with higher CEO overconfidence report more Level 3 fair values and gains from Level 3 fair values. The results also indicates that the positive relationship between higher CEO overconfidence and Level 3 fair values reporting is attenuated for firms with high corporate governance.
Keywords: CEO overconfidence, fair value reporting, and corporate governance, SFAS No.
157, level 3 fair values.
1.Introduction
Current accounting principles around the world, including the U.S.A.’s Generally Accepted Accounting Principles (GAAP) and International Financial Reporting Standards (IFRSs), are highly reliant on the fair value principle. Fair value information is favored due to its greater relevance (Barlev and Haddad, 2003) and the assistance that it provides in encouraging prompt corrective actions (Laux and Leuz, 2009). However, fair value information has some reliability issues given its greater estimation error and its elicited managerial incentive of manipulation (e.g., Dechow et al., 2010)2.
Given the ongoing debate as to whether fair values can be measured with sufficient reliability and whether they can be opportunistically manipulated, the Financial Accounting Standards Board (FASB) issued SFAS No. 157, which became effective for fiscal years beginning after November 15, 2007. SFAS No. 157 offers a uniform definition of fair value, develops a framework for measuring this, and expands disclosure about fair value measurements. One of the requirements of SFAS No. 157 is the mandatory disclosure of the fair value estimates based on a three-level hierarchy, which is of particular interest to the current study. Specifically, FAS No. 157 requires firms to report the fair value of their assets and liabilities, and it prioritizes the inputs to valuation techniques into three levels. (1) Level 1 inputs are quoted prices (unadjusted) in active markets for identical assets or liabilities that the reporting entity has the ability to access at the measurement date. (2) Level 2 inputs are indirectly observable inputs from quoted prices of comparable items in active markets, identical items in inactive markets, or other market-related information. (3) Level 3 inputs are unobservable inputs or firm-generated inputs. Level 3 inputs generate mark-to-model valuations that are largely undisciplined by market information. Due to the high subjectivity of Level 3 inputs, SFAS No. 157 requires expanded disclosures for Level 3 fair values3. Many studies center on the fair value estimates presented under the three-level fair value hierarchy and demonstrate the usefulness of these estimates in valuing firms and accessing risk from perspectives of external users (e.g., Kolev, 2008; Song et al., 2010; Riedl and Serafeim, 2011). However, the relation between CEO overconfidence and fair value reporting is unclear and has received less attention in the literature.
Prior research indicates that CEO overconfidence affects corporate investment (Malmendier and Tate, 2008), financing, dividend policies (Malmendier and Tate, 2008; Cordeiro, 2009; Deshmukh, Goel, and Howe, 2013; Malmendier, Tate, and Yan, 2011; Hirshleifer, Low, and Teoh, 2012), the likelihood of an Accounting and Auditing Enforcement Release (Schrand and Zechman, 2012), and the likelihood of issuing overly optimistic management earnings forecasts (Hribar and Yang, 2016; Libby and Rennekamp, 2012). This study extends this line of research by investigating the effects of managerial overconfidence on fair value reporting.
2As suggested by Dechow et al. (2010), fair values may not be measured with sufficient reliability, but they provide ample opportunity to manipulate earnings.
Because level 3 fair assets are risky assets (Riedl and Serafeim, 2011), I expect the high overconfident CEOs are more likely to keep level 3 fair assets because they overestimate the returns to their investment projects (Malmendier and Tate, 2005). Therefore, the first objective in this paper is to determine whether there exists a positive relationship between CEO overconfidence and level 3 fair assets.
Hsieh et al. (2014) indicate that overconfident CEOs will seek to achieve their unrealistically high expectations and will be more likely to engage in managing earnings. Since Level 3 fair values is subject to the highest level of managerial discretion and provide management with discretion to determine the gains from Level 3 fair values (Chong et al. 2012). Thus, the second purpose of this paper is to examine whether high overconfident CEO are more likely to manage earnings through gains from Level 3 fair values.
Moreover, prior literature indicates effective corporate governance mechanisms ameliorate the adverse impact of CEO overconfidence (Goel and Thakor, 2008; Heaton, 2002). For example, Goel and Thakor (2008) indicate that board fires the CEO if she is too overconfident. Therefore, the third objective is to investigate whether effective corporate governance will mitigate the positive association between high CEO overconfidence and level 3 fair values. The fourth objective is to examine whether effective corporate governance will mitigate the positive association between high CEO overconfidence and gains from Level 3 fair values.
Using a US sample drawn from 2008 to 2011, the results of this paper show that firms with higher CEO overconfidence report more Level 3 fair values and gains from Level 3 fair values. The results also indicates that the positive relationship between higher CEO overconfidence and Level 3 fair values reporting is attenuated for firms with high corporate governance.
This paper contributes to the literature by demonstrating that CEO overconfidence significantly affects fair value reporting. To our knowledge, prior work has not demonstrated the presence of these effects. In related work, Malmendier and Tate (2005) show that overconfidence affects their investment projects. This paper extends and complements their work. This study also extends the literature by investigating whether earnings management is associated with an individual characteristic of the CEO, termed “overconfidence” by prior finance research (Malmendier and Tate, 2005). Second, my study contributes to the literature by examining directly the association between the strength of corporate governance and managerial fair value reporting behavior.
The remainder of the paper is organized as follows. Section 2 presents the discussion of the previous literature and develops the hypotheses. Section 3 presents the research design and variable definitions.
2. Literature review and hypothesis development
2.1 The relationship between CEO overconfidence and Level 3 fair values
2006). Overconfident CEOs have unrealistically high expectations of their company’s future performance (Hackbarth, 2003; Wong, 2008; Baker, Ruback, and Wurgler, 2007), issue more optimistic earnings forecasts (Hilary and Hsu, 2011; Hribar and Yang, 2016; Libby and Rennekamp, 2012), have a belief that they can ensure that high performance is achieved (Malmendier and Tate, 2005), overvalue their firm’s projects (Heaton, 2002), pay less dividends (Cordeiro, 2009; Deshmukh et al., 2013), underestimate the impact of negative events on his/her firm’s cash flows (Heaton, 2002; Malmendier and Tate, 2005), and are more likely to have financial misstatements that are later the subject of SEC enforcement actions (Schrand and Zechman, 2012). In summary, prior literature documents that overconfidence affects corporate investment, financing, dividend policies, accounting choices, and firm performance.
As we know, the managers are the key decision-makers presiding over investment, financing, and operating decisions. There are two decisions that managers must make with respect to level 3 instruments (Kohlbeck and Valencia, 2014). First, the management must decide whether level 3 classification is appropriate. Second, the management must decide what inputs should be used in place of observable inputs once it has been determined that level 3 classification is appropriate. SFAS 157 encourages the use of Level 3 valuations when quoted market values do not originate from orderly markets, but the standard does not make clear the characteristics that identify an unorderly market, leaving managers considerable discretion over when and which financial instruments to use Level 3 methods on. Since Level 3 fair values are less observable, making it more difficult compared to Level 1 fair values for investors to link their performance to managerial decisions, reducing the efficiency of these activities. Thus, the decision to keep level 3 fair values can be considered an investment in a risky project. For example, Altamuro and Zhang (2013) indicate that Level 3 fair values better reflect the firms' risk characteristics. Because overconfident managers may overestimate the returns to their investment projects (Malmendier and Tate, 2005), this study expects that the CEOs may choose to classify more items as Level 3 instruments when they are overconfident. Accordingly, the first hypothesis is as follows:
H1: Firms with higher CEO overconfidence is more likely to report Level 3 fair values.
2.2 The relationship between CEO overconfidence and gains from Level 3 fair values
may involve the use of discretion regarding the fair-value estimates they make at each reporting period. In summary, the findings of extant literature documented that managers use their discretion on fair values to manage earnings.
From the viewpoint of CEO overconfidence, Hsieh et al. (2014) indicate that overconfident CEOs will seek to achieve their unrealistically high expectations and will be more likely to engage in managing earnings. Since Level 3 fair values is subject to the highest level of managerial discretion, this is expected to be an avenue for earnings management (Chong et al. 2012). Therefore, overconfident CEO can use the discretion allowed in Level 3 fair values to boost earnings because gains on Level 3 fair values increase reported earnings. According to above discussion, this paper develops the second hypothesis:
H2: Firms with higher CEO overconfidence is more likely to report gains from Level 3 fair values.
2.3 The relationship between CEO overconfidence and fair value reporting-the moderating effect of corporate governance
Larcker et al. (2007) indicate that the corporate governance refers to the set of mechanisms that influence the decisions made by managers when there is a separation of ownership and control. Prior literature has examined the effects of a variety of corporate governance mechanisms on managerial decision-making or constrain executive behavior (Morck et al., 1988; Byrd and Hickman, 1992; Brickley et al., 1994; Yermack, 1996; Core et al., 1999; Klein, 2002; and Gompers et al., 2003). For example, Baysinger et al. (1991) find that the percentage of inside directors on a board and the percentage of institutional ownership are positively associated with R&D spending. Chen and Chung (2009) examines the impact of corporate governance on the cash-holding policies of firms with different investment opportunities. They find CEO ownership and board independence affect the cash holdings in listed new economy and old economy firms differently. Conyon and Florou (2004) find that stock compensation of outside directors and executives positively affects investment in fixed capital during the CEO’s final year. To summarize, the above literature indicates corporate governance will monitor the managerial behavior.
For firms with more strong corporate governance mechanisms, information asymmetry problems associated with fair values may be lower, leading to less severe moral hazard problems, and therefore higher value relevance of these disclosures. For example, Song et al. (2010) provide evidences that support the relevance of fair value measurements under FAS No. 157, but weaker corporate governance mechanisms may reduce the relevance of these measures. Thus, corporate governance may also affect the managerial fair value reporting.
governance will mitigate the positive association between CEO overconfidence and gains from Level 3 fair values. Therefore, the third and fourth hypotheses are formulated:
H3: The positive relationship between high CEO overconfidence and Level 3 fair values is attenuated for firms with high corporate governance.
H4: The positive relationship between high CEO overconfidence and gains from Level 3 fair values is attenuated for firms with high corporate governance.
3. Research design
3.1 Regression models and variable definitions
3.1.1 Test of Hypothesis 1
In Hypothesis 1, it is expected that high CEO overconfidence is positively associated with Level 3 fair values. Following Chong et al. (2012), the basic equation is developed as follows:
i,t 0 1 , 2 , 3 , 4 , 5 , 6 ,
7 , 8 ,
LEVEL3 _ _
+ (1)
i t i t i t i t i t i t
i t i t
HI OVER HI GINDEX SIZE LEV ROA OCF
AFLL PFLL
α α α α α α α
α α ε
= + + + + + +
+ +
Where,
LEVEL3 = The net assets at Level 3 input divided by the net assets at fair value.
HI_OVER = The variable equals one if the CEO overconfidence score of the firm is above the median score for the sample, and zero otherwise.
HI_GINDEX = The variable equals one if the corporate governance score of the firm is above the median score for the sample, and zero otherwise.
SIZE = The logarithm of total assets.
LEV = The ratio of total liability to total assets.
ROA = The net income divided by the total assets.
OCF = The operating cash flows scaled by the total assets.
AFLL = The allowance for loan loss scaled by the total assets.
PFLL = The provision for loan loss scaled by the net income.
The variable of interest in this hypothesis is HI_OVER. If firms with higher CEO overconfidence is more likely to use more level 3 fair values, the coefficient on α1 will be significantly positive.
3.1.2 Test of Hypothesis 2
i,t 0 1 , 2 , 3 , 4 , 5 ,
6 , 7 , 8 ,
LEVEL3_GAIN _ _
+ (2)
i t i t i t i t i t
i t i t i t
HI OVER HI GINDEX SIZE LEV ROA
OCF AFLL PFLL
β β β β β β
β β β ε
= + + + + +
+ + +
Where,
LEVEL3_GAIN= The gains from Level 3 fair assets scaled by the net assets at fair value.
HI_OVER = The variable equals one if the CEO overconfidence score of the firm is above the median score for the sample, and zero otherwise.
HI_GINDEX = The variable equals one if the corporate governance score of the firm is above the median score for the sample, and zero otherwise.
SIZE = The logarithm of total assets.
LEV = The ratio of total liability to total assets.
ROA = The net income divided by the total assets.
OCF = The operating cash flows scaled by the total assets.
AFLL = The allowance for loan loss scaled by the total assets.
PFLL = The provision for loan loss scaled by the net income.
The variable of interest in this hypothesis is HI_OVER. If firms with higher CEO overconfidence is more likely to report more gains from level 3 fair values, the coefficient on β1 will be significantly positive.
3.1.2 Test of Hypothesis 3
In Hypothesis 3, it is expected that the positive relationship between high CEO overconfidence and Level 3 fair values is weaker for firms with stronger corporate governance. Modifying equation (1), equation (2) is as follows:
i,t 0 1 , 2 , 3 , ,
4 , 5 , 6 , 7 , 8 , 9 ,
LEVEL3 _ _ _ _
+ (3)
i t i t i t i t
i t i t i t i t i t i t
HI OVER HI GINDEX HI GINDEX HI OVER
LGTA LEV ROA OCF AFLL PFLL
γ γ γ γ
γ γ γ γ γ γ ε
= + + + ×
+ + + + + +
Where,
LEVEL3 = The net assets at Level 3 input divided by the net assets at fair value.
HI_OVER = The variable equals one if the CEO overconfidence score of the firm is above the median score for the sample, and zero otherwise.
HI_GINDEX = The variable equals one if the corporate governance score of the firm is above the median score for the sample, and zero otherwise.
LGTA = The logarithm of total assets.
LEV = The ratio of total liability to total assets.
ROA = The net income divided by the total assets.
OCF = The operating cash flows scaled by the total assets.
AFLL = The allowance for loan loss scaled by the total assets.
The variable of interest in this hypothesis is HI GINDEX HI OVER_ × _ . If strong corporate
governance causes overconfident CEO to use less level 3 fair values, the coefficient on γ3
will be significantly negative.
3.1.2 Test of Hypothesis 4
In Hypothesis 4, it is expected that the positive relationship between CEO overconfidence and gains from Level 3 fair values is weaker for firms with stronger corporate governance. Modifying equation (2), equation (4) is as follows:
i,t 0 1 , 2 ,
3 , , 4 ,
5 , 6 , 7 , 8 , 9 ,
LEVEL3_GAIN _ _
_ _
+ (4)
i t i t
i t i t i t
i t i t i t i t i t
HI OVER HI GINDEX
HI GINDEX HI OVER SIZE
LEV ROA OCF AFLL PFLL
λ λ λ
λ λ
λ λ λ λ λ ε
= + +
+ × +
+ + + + +
Where,
LEVEL3_GAIN= The gains from Level 3 fair assets scaled by the net assets at fair value.
HI_OVER = The variable equals one if the CEO overconfidence score of the firm is above the median score for the sample, and zero otherwise.
HI_GINDEX = The variable equals one if the corporate governance score of the firm is above the median score for the sample, and zero otherwise.
SIZE = The logarithm of total assets.
LEV = The ratio of total liability to total assets.
ROA = The net income divided by the total assets.
OCF = The operating cash flows scaled by the total assets.
AFLL = The allowance for loan loss scaled by the total assets.
PFLL = The provision for loan loss scaled by the net income.
The variable of interest in this hypothesis is HI GINDEX HI OVER_ × _ . If strong corporate governance causes overconfident CEO to report less gains from level 3 fair values, the coefficient on λ3 will be significantly negative.
3.2 Variable definitions
3.2.1 Dependent variables for hypothesis 1 and hypothesis 3
Following Chong et al. (2012), this paper computes Level 3 fair values (LEVEL3) as the net assets at Level 3 input divided by the net assets at fair value.
3.2.2 Dependent variables for hypothesis 2 and hypothesis 4
Following Valencia (2011), this paper proxies the gains from Level 3 fair values (LEVEL3_GAIN) as the gains from Level 3 fair assets scaled by the net assets at fair value.
3.2.3 Independent variables- High CEO Overconfidence (HI_OVER)
net purchases by the CEO (PURCHASE), firm's capital expenditures (CAPEX), and the amount of excess investment in assets (OVERINVEST). These proxies measure the CEOs’ stock purchases and their investment decisions. The three variables are explained as following: The first measure of overconfidence is the net purchases by the CEO (Malmendier and Tate, 2005). PURCHASE is set equal to one if the CEO’s net purchases (purchases−sales) are in the top quintile of the distribution of net purchases by all CEO and those purchases increase their ownership in the firm by 10% during the fiscal year, otherwise zero (Campbell et al., 2011). The second proxy for overconfidence is firm's capital expenditures (CAPEX). CAPEX is a dichotomous variable set equal to one if the capital expenditures deflated by lagged total assets in a given year is greater than the median level of capital expenditures to lagged total assets for the firm’s Fama-French industry in that year, otherwise zero (Ben-David et al., 2010; Malmendier and Tate, 2005). Following Schrand and Zechman (2012), the third proxy for overconfidence is the amount of excess investment in assets from the residual of a regression of total asset growth on sales growth run by industry-year (OVERINVEST). OVERINVEST equal to one if the residual from the excess investment regression is greater than zero, otherwise zero. The three measures are converted to percentile scores from which an index, CEO_OVER, is then constructed to capture the combined effect of these factors. CEO_OVER equals the average of these three percentile values. The variable of high CEO overconfidence (HI_OVER) equals one if the CEO overconfidence score (CEO_OVER) of the firm is above the median score for the sample, and zero otherwise.
3.2.4 Independent variables-High Corporate Governance (HI_CG)
This paper considers four proxies for corporate governance score (CG_SCORE) as following: BD_IND is the proportion of independent directors on the board (Bradbury et al., 2006; Chen et al., 2007; Osma, 2008; Visvanathan, 2008; Garven, 2009; Shiue, Lin, & Liu, 2009). The CEO/Chair Duality (NODUAL), which is a dummy variable that equals one if the CEO does not serve as the board chair, and zero otherwise (Davidson et al., 2005; Bradbury et al., 2006). The average tenure of board members (BD_TEN), measured as the average years of service of board members (Garven, 2009; Shiue et al., 2009). Outside directorships (BD_DIR), measured as the average number of outside directorships held by board members (Garven, 2009). The four measures are converted to percentile scores from which an index, CG_SCORE, is then constructed to capture the combined effect of these factors. CG_SCORE equals the average of these four percentile values. The variable of high corporate governance (HI_CG) equals one if the corporate governance score (CG_SCORE) of the firm is above the median score for the sample, and zero otherwise.
3.2.5 Control Variables
This paper also includes a number of additional control variables that have been documented in prior literature.
leverage due to the fact that a bank's capital structure can affect its structure of fair value assets to meet covenants’ requirements. In addition, Jensen and Meckling (1976) conclude high-leverage banks will have stronger incentives to undertake riskier projects (ex: more level 3 inputs). Firm performance (ROA) is the net income divided by the total assets. ROA is expected to be negatively associated with Level 3 fair values because the managers have a greater incentive to engage level 3 inputs for firms with poor performance (Chong et al., 2012). Firm cash flow (OCF) is the operating cash flows scaled by the total assets and is expected to be negatively associated with Level 3 fair values because firms with less cash flow from operation to use more level 3 input (Chong et al., 2012). Allowance for loan loss (AFLL), which is the allowance for loan loss scaled by the total assets. Loan loss provision (PFLL), which is the provision for loan loss scaled by the net income and is expected to be positively associated with level 3 fair values (Moyer, 1990; Clinch and Magliolo, 1993; Valencia, 2011).
3.3 Sample selection and data sources
This paper focuses on the banking industry,4 where firms have significant amounts of fair value assets and liabilities (Song et al., 2010; Riedl and Serafeim, 2011) from 2008 to 2011. The gains from Level 3 fair values disclosed in the form 10-K are hand collected individually. To be included in the sample, firms must provide the fair value hierarchy disclosure for the fiscal years beginning after November 15, 2007. Although the firms disclose Level 3 fair value information (as shown in Appendix), there are some in the sample that report no Level 3 fair values, and thus, the value for Level 3 fair values may be zero. However, the zero value for the context is meaningful. In addition, other financial data, annual stock returns, CEO overconfidence, and corporate governance data are obtained from Compustat, the Center for Research in Security Prices (CRSP), Execucomp, and Riskmetrics, respectively.
The following restrictions on the sample are imposed: (1) observations that could not be matched with CRSP, (2) observations with insufficient Compustat, Execucomp and Riskmetrics data and (3) outliers. According to Kleinbaum, Kupper and Muller (1988), a studentized residual greater than 3.0 is highly indicative of an outlier.
4. Empirical Results
4.1 Descriptive Statistics
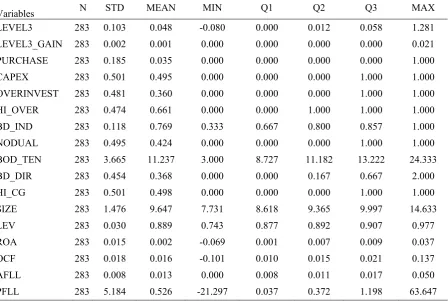
corporate governance variables. On average, 76.9% firms have independent directors on the board (BD_IND), 42.4% CEO does not serve as the board chair (NODUAL), the average service years of board members (BOD_TEN) are 11.237 years, the average number of outside directorships held by board members(BD_DIR) are 0.368 seats. Finally, table 1 also provides the descriptive statistics on the control variables. The means and medians of all control variables are not skewed.
Table 1. Descriptive Statistics
Variables N STD MEAN MIN Q1 Q2 Q3 MAX
LEVEL3 283 0.103 0.048 -0.080 0.000 0.012 0.058 1.281
LEVEL3_GAIN 283 0.002 0.001 0.000 0.000 0.000 0.000 0.021
PURCHASE 283 0.185 0.035 0.000 0.000 0.000 0.000 1.000
CAPEX 283 0.501 0.495 0.000 0.000 0.000 1.000 1.000
OVERINVEST 283 0.481 0.360 0.000 0.000 0.000 1.000 1.000
HI_OVER 283 0.474 0.661 0.000 0.000 1.000 1.000 1.000
BD_IND 283 0.118 0.769 0.333 0.667 0.800 0.857 1.000
NODUAL 283 0.495 0.424 0.000 0.000 0.000 1.000 1.000
BOD_TEN 283 3.665 11.237 3.000 8.727 11.182 13.222 24.333
BD_DIR 283 0.454 0.368 0.000 0.000 0.167 0.667 2.000
HI_CG 283 0.501 0.498 0.000 0.000 0.000 1.000 1.000
SIZE 283 1.476 9.647 7.731 8.618 9.365 9.997 14.633
LEV 283 0.030 0.889 0.743 0.877 0.892 0.907 0.977
ROA 283 0.015 0.002 -0.069 0.001 0.007 0.009 0.037
OCF 283 0.018 0.016 -0.101 0.010 0.015 0.021 0.137
AFLL 283 0.008 0.013 0.000 0.008 0.011 0.017 0.050
PFLL 283 5.184 0.526 -21.297 0.037 0.372 1.198 63.647
Note: 1. n=283. 2. Variable Definitions: LEVEL3 is measured as the net assets at level 3 input divided by the total fair value net assets. LEVEL3_GAIN is measured as the gains from Level 3 fair assets scaled by the total fair value net assets. PURCHASE is set equal to one if the CEO’s net purchases are in the top quintile of the distribution of net purchases by all CEO and those purchases increase their ownership in the firm by 10% during the fiscal year, otherwise zero. CAPEX is a dichotomous variable set equal to one if the capital expenditures deflated by lagged total assets in a given year is greater than the median level of capital expenditures to lagged total assets for the firm’s Fama-French industry in that year, otherwise zero. OVERINVEST equal to one if the residual from the excess investment regression is greater than zero, otherwise zero. HI_OVER equals one if the CEO overconfidence score of the firm is above the median score for the sample, and zero otherwise. BD_IND is the proportion of independent directors on the board. NODUAL is a dummy variable that equals one if the CEO does not serve as the board chair, and zero otherwise. BD_TEN is measured as the average years of service of board members. BD_DIR is measured as the average number of outside directorships held by board members. HI_CG equals one if the corporate governance score of the firm is above the median score for the sample, and zero otherwise. SIZE is the logarithm of total assets. LEV is the ratio of total liability to total assets. ROA is the net income divided by the total assets. OCF is the operating cash flows scaled by the total assets. AFLL is the allowance for loan loss scaled by the total assets. PFLL is the provision for loan loss scaled by the net income.
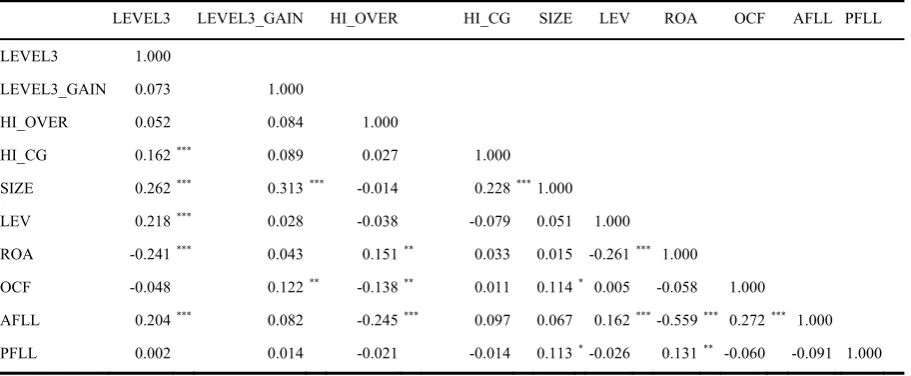
4.2 Correlation Analyses
regression model. To check for the potential of multi-collinearity, this study also adopts the Variance Inflation Factor (VIF) in all tests.
Table 2. Correlation Analysis
LEVEL3 LEVEL3_GAIN HI_OVER HI_CG SIZE LEV ROA OCF AFLL PFLL
LEVEL3 1.000
LEVEL3_GAIN 0.073 1.000
HI_OVER 0.052 0.084 1.000
HI_CG 0.162 *** 0.089 0.027 1.000
SIZE 0.262 *** 0.313 *** -0.014 0.228 ***1.000
LEV 0.218 *** 0.028 -0.038 -0.079 0.051 1.000
ROA -0.241 *** 0.043 0.151 ** 0.033 0.015 -0.261 *** 1.000
OCF -0.048 0.122 ** -0.138 ** 0.011 0.114 * 0.005 -0.058 1.000
AFLL 0.204 *** 0.082 -0.245 *** 0.097 0.067 0.162 ***-0.559 *** 0.272 *** 1.000
PFLL 0.002 0.014 -0.021 -0.014 0.113 *-0.026 0.131 ** -0.060 -0.091 1.000
Note: 1. Pearson correlations are reported in the lower diagonal. 2. n=283. 3. see Table 1 for variable definitions. 4. ***, **, and * indicate
significance at the 1%, 5%, and 10% level, respectively.
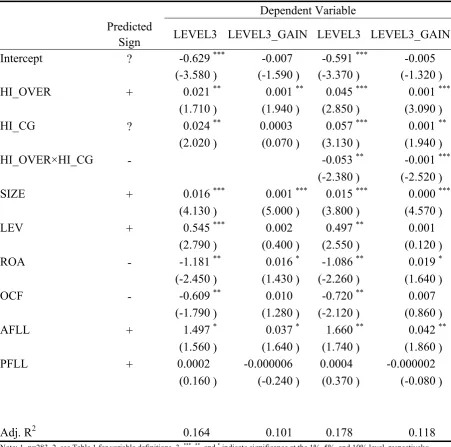
4.3 Regression Analyses
The results for hypothesis one in this study are shown in Column 1 of Table 3. Hypothesis 1 states that firms with higher CEO overconfidence are more likely to report Level 3 fair values. Column 1 shows that HI_OVER is significantly positive related to level 3 fair values (LEVEL3). Thus, hypothesis 1 is supported. This result suggests that high overconfident CEOs are more likely to keep level 3 fair assets because they overestimate the returns to their investment projects (Malmendier and Tate, 2005). Regarding the control variables, SIZE is significantly positive indicating that large banks have incentives to use level 3 inputs to value their assets. ROA and OCF are significantly negative indicating that a lower return on asset (ROA) and operating cash flow (OCF) are associated with a significantly higher level 3 fair values, consisting with Chong et al. (2010)'s finding.
The results for hypothesis two in this study are shown in Column 2 of Table 3. Hypothesis two states that Firms with higher CEO overconfidence is more likely to report gains from Level 3 fair values. Column 2 shows that HI_OVER is significantly positive related to gains from Level 3 fair values (LEVEL3_GAIN). Thus, the second hypothesis is supported. The result suggests that overconfident CEO can use the discretion allowed in Level 3 fair values to boost earnings and thus report more gains from Level 3 fair values. Regarding the control variables, SIZE and ROA are significantly positive. The result indicates that firms with higher firm size and good performance report more gains from Level 3 fair values.
corporate governance mechanisms ameliorate the adverse impact of CEO overconfidence (Goel and Thakor, 2008; Liu and Taffler, 2008; Heaton, 2002). Therefore, hypothesis 3 is get supported.
The results for hypothesis four in this study are shown in Column 4 of Table 3. Hypothesis four states that the positive relationship between high CEO overconfidence and gains from Level 3 fair values is attenuated for firms with high corporate governance. Column 4 shows that the interaction term HI_CG×HI_OVER is significantly negative. The result indicates that the effectiveness of corporate governance can decrease overconfident CEO's managerial earnings behavior in Level 3 fair values to boost earnings. Thus, hypothesis 4 is supported.
Table 3. Regression Results
Dependent Variable Predicted
Sign LEVEL3 LEVEL3_GAIN LEVEL3 LEVEL3_GAIN
Intercept ? -0.629 *** -0.007 -0.591 *** -0.005
(-3.580 ) (-1.590 ) (-3.370 ) (-1.320 )
HI_OVER + 0.021 ** 0.001 ** 0.045 *** 0.001 ***
(1.710 ) (1.940 ) (2.850 ) (3.090 )
HI_CG ? 0.024 ** 0.0003 0.057 *** 0.001 **
(2.020 ) (0.070 ) (3.130 ) (1.940 )
HI_OVER×HI_CG - -0.053 ** -0.001 ***
(-2.380 ) (-2.520 )
SIZE + 0.016 *** 0.001 *** 0.015 *** 0.000 ***
(4.130 ) (5.000 ) (3.800 ) (4.570 )
LEV + 0.545 *** 0.002 0.497 ** 0.001
(2.790 ) (0.400 ) (2.550 ) (0.120 )
ROA - -1.181 ** 0.016 * -1.086 ** 0.019 *
(-2.450 ) (1.430 ) (-2.260 ) (1.640 )
OCF - -0.609 ** 0.010 -0.720 ** 0.007
(-1.790 ) (1.280 ) (-2.120 ) (0.860 )
AFLL + 1.497 * 0.037 * 1.660 ** 0.042 **
(1.560 ) (1.640 ) (1.740 ) (1.860 )
PFLL + 0.0002 -0.000006 0.0004 -0.000002
(0.160 ) (-0.240 ) (0.370 ) (-0.080 )
Adj. R2 0.164 0.101 0.178 0.118
Note: 1. n=283. 2. see Table 1 for variable definitions. 3. ***, **, and * indicate significance at the 1%, 5%, and 10% level, respectively;
5. Summary and Conclusion
This paper provides evidence how CEO overconfidence and corporate governance affect managerial fair value reporting behavior. Using a US sample drawn from 2008 to 2011, the results of this paper show that firms with higher CEO overconfidence report more Level 3 fair values and gains from Level 3 fair values. The results also indicates that the positive relationship between higher CEO overconfidence and Level 3 fair values reporting is attenuated for firms with high corporate governance. This paper contributes to the literature by demonstrating that CEO overconfidence significantly affects fair value reporting. To our knowledge, prior work has not demonstrated the presence of these effects. In addition, this study also extends the literature by investigating whether earnings management is associated with an individual characteristic of the CEO, termed “overconfidence” by prior finance research (Malmendier and Tate, 2005). Second, my study contributes to the literature by examining directly the association between the strength of corporate governance and managerial fair value reporting behavior.
References
Aboody, D., Barth, M. E., & Kasznik, R. (2006). Do firms understate stock option-based compensation expense disclosed under FAS 123. Review of Accounting Studies, 11(4),
429-461. http://dx.doi.org/10.1007/s11142-006-9013-0
Ahmed, A. S., & Duellman, S. (2013). Managerial overconfidence and accounting
conservatism. Journal of Accounting Research, 51(1), 1-30.
http://dx.doi.org/10.1111/j.1475-679X.2012.00467.x
Altamuro, J., & Zhang, H. (2013). The financial reporting of fair value based on managerial inputs versus market inputs: evidence from mortgage servicing rights. Review of Accounting
Studies, 18, 833-858. http://dx.doi.org/10.1007/s11142-013-9234-y
Baker, M., R. Ruback, & Wurgler, J. (2007). Behavioral Corporate Finance: A Survey. In
The Handbook of Corporate Finance: Empirical Corporate Finance, edited by B. Espen
Eckbo, 145-186. New York: Elsevier/North-Holland. http://dx.doi.org/10.3386/w10863
Barlev, B., & Haddad, J. R. (2003). Fair value accounting and the management of the firm.
Critical Perspectives on Accounting, 14, 383-415.
http://dx.doi.org/10.1016/S1045235402001399
Barth, M. E., & Clinch, G. (1998). Revalued financial tangible, and intangible assets: associations with share prices and non-market-based value estimates. Journal of Accounting
Research,36(3), 199-233. http://dx.doi.org/10.2307/2491314
Bartov, E., Mohanram, P., & Nissim, D. (2007). Managerial discretion and the economic determinations of the disclosed volatility parameter for valuing ESOs. Review of Accounting
Baysinger, B., Kosnik, R. & Turk, T. (1991). Effects of board and ownership structure on
corporate strategy. Academy of Management Journal, 34(1), 205-214.
http://dx.doi.org/10.2307/256308
Bebchuk, L. A., Grinstein, Y., & Peyers, U. (2010). Lucky CEOs and lucky directors. The
Journal of Finance,65(6), 2363-2401. http://dx.doi.org/10.1111/j.1540-6261.2010.01618.x
Bédard, J., Chtourou, S. M., & Courteau, L. (2004). The effect of audit committee expertise, independence, and activity on aggressive earnings management. Auditing: A Journal of
Practice & Theory, 23(2), 13-35. http://dx.doi.org/10.2308/aud.2004.23.2.13
Ben-David, I., Graham, J. R., & Harvey, C. R. (2010). Managerial Miscalibration. Working
paper, Duke University. http://dx.doi.org/10.1093/qje/qjt023
Bhandari, G., & Deaves, R. (2006). The demographics of overconfidence. The Journal of
Behavioral Finance, 7(1), 5-11. http://dx.doi.org/10.1207/s15427579jpfm0701_2
Bradbury, M. E., Mak, Y. T., & Tan, S. M. (2006). Board characteristics, audit committee characteristics and abnormal accruals. Pacific Accounting Review, 18(2), 47-68.
http://dx.doi.org/10.1108/01140580610732813
Brickley, J. A., Coles, J. L., & Terry, R. L. (1994). Outside directors and the adoption of
poison pills. Journal of Financial Economics, 35(3), 371-390.
http://dx.doi.org/10.1016/0304-405X(94)90038-8
Byrd, J. W., & Hickman, K. A. (1992). Do outside directors monitor managers? Evidence
from tender offer bids. Journal of Financial Economics, 32(2), 195-221.
http://dx.doi.org/10.1016/0304-405X(92)90018-S
Campbell, T. C., Galleyer, M. Johnson, S. A. Rutherford, J., & Stanley, B. W. (2011). CEO
optimism and forced turnover. Journal of Financial Economics, 101, 695-712.
http://dx.doi.org/10.1016/j.jfineco.2011.03.004
Chen, K. Y., Elder, R. J., & Hsieh, Y. M. (2007). Corporate governance and earnings management: The implications of corporate governance best-practice principles for Taiwanese listed companies. Journal of Contemporary Accounting & Economics, 3(2),
73-105. http://dx.doi.org/10.1016/S1815-5669(10)70024-2
Chen, Y. R., & Chung, W. T. (2009). Alignment or entrenchment? corporate governance and cash holdings in growing firms. Journal of Business Research, 62(11), 1200-1206.
http://dx.doi.org/10.1016/j.jbusres.2008.06.004
Chong, G., Huang, H., & Zhang, Y. (2012). Do US commercial banks use FAS 157 to manage earnings? International Journal of Accounting and Information Management, 20(1),
78-93. http://dx.doi.org/10.1108/18347641211201090
Clinch, G., & Magliolo, J. (1993). CEO compensation and components of earnings in bank
holding companies. Journal of Accounting and Economics, 16(1-3), 241-272.
Conyon, M. J., & He, L. (2004). Compensation committee and ceo compensation incentives in u.s. entrepreneurial firms. Journal of Management Accounting Research, 16, 35-56.
http://dx.doi.org/10.2308/jmar.2004.16.1.35
Cordeiro, L. (2009). Managerial Overconfidence and Dividend Policy. Working paper,
London Business School. http://dx.doi.org/ 10.2139/ssrn.1343805
Core, J., Gua, W., & Holthausen, R. (1999). Corporate governance, chief executive officer compensation, and firm performance. Journal of Financial Economics, 51, 371-406.
http://dx.doi.org/10.1016/S0304-405X(98)00058-0
Cullinan, C. P., Du, H., & Wright, G. B. (2008). Is there an association between director option compensation and the likelihood of misstatement? Advances in Accounting, 24(1),
16-23. http://dx.doi.org/10.1016/j.adiac.2008.05.003
DaDalt, P. J., Davidson III, W. N., & Xie, B. (2003). Earnings management and corporate governance: the role of the board and the audit committee. Journal of Corporate Finance, 9(3), 295-316. http://dx.doi.org/10.1016/S0929-1199(02)00006-8
Davidson, R., Goodwin-Stewart, J., & Kent, P. (2005). Internal governance structures and
earnings management. Accounting and Finance, 45(2), 241-267.
http://dx.doi.org/10.1111/j.1467-629x.2004.00132.x
Dechow, P. M., Myers, L., & Shakespeare, C. (2010). Fair value accounting and gains from asset securitizations: A convenient earnings management tool with compensation
side-benefits. Journal of Accounting Economics, 49, 2-25.
http://dx.doi.org/10.1016/j.jacceco.2009.09.006
Deshmukh, S., Goel, A., & Howe, K. (2013). CEO overconfidence and dividend policy.
Journal of Financial Intermediation, 22(3), 440-463..
http://dx.doi.org/10.1016/j.jfi.2013.02.003
Fiechter, P., & Meyer, C. (2011). Discretion in fair value measurement of banks during the 2008 financial crisis.Working paper. University of Zurich.
Garven, S. A. (2009). The effect of board and audit committee characteristics on real earnings management: Do boards and audit committees play a role in its constraint? Working paper, The University of Alabama.
Goel, A. M., & Thakor, A. J. (2008). Overconfidence, CEO selection, and corporate
governance. Journal of Finance, 63, 2737-2784.
http://dx.doi.org/10.1111/j.1540-6261.2008.01412.x
Gompers, P. A., Ishii, J. L., & Metrick, A. (2003). Corporate governance and equity prices.
The Quarterly Journal of Economics, 118(1), 107-155.
http://dx.doi.org/10.1162/00335530360535162
Hackbarth, D. (2003). Corporate Financial Decision-making and Managerial Traits.
Heaton, J. (2002). Managerial optimism and corporate finance. Financial Management 31,
33-45.
Hilary, G., & Hsu, C. (2011). Endogenous overconfidence in managerial forecasts. Journal of
Accounting and Economics,51, 300-313. http://dx.doi.org/10.1016/j.jacceco.2011.01.002
Hirshleifer, D., Low, A., & Teoh, S. (2012). Are overconfident CEOs better innovators?
Journal of Finance,67, 1457-1498. http://dx.doi.org/10.1111/j.1540-6261.2012.01753.x
Hribar, P., & Yang, H. (2016). CEO Overconfidence and Management Forecasting.
Contemporary Accounting Research, 33, 204-227.
http://dx.doi.org/10.1111/1911-3846.12144
Hsieh, T. S., Bendad, J. C., & Johostone, K. M. (2014).CEO overconfidence and earnings management during shifting regulatory regimes. Journal of Business Finance & Accounting, 41(9-10), 1243-1268. http://dx.doi.org/10.1111/jbfa.12089
Jensen, M., & Meckling, W. (1976). Theory of the firm: Managerial behavior, agency costs,
and capital structure. Journal of Financial Economic, 33, 305-360.
http://dx.doi.org/10.1016/0304-405X(76)90026-X
Karamanou, I., & Vafeas, N. (2005). The association between corporate boards, audit committees, and management earnings forecasts: an empirical analysis. Journal of
Accounting Research,43(3), 453-486. http://dx.doi.org/10.1111/j.1475-679X.2005.00177.x
Klein, A. (2002). Audit committee, board of director characteristics, and earnings
management. Journal of Accounting and Economics, 33(3), 375-400.
http://dx.doi.org/10.1016/S0165-4101(02)00059-9
Kohlbeck, M., & Valencia, A. (2014). Auditors Influence on Transfers of Fair-valued
Instruments Into and Out of Level 3 Classification. Working paper, Florida Atlantic
University. http://dx.doi.org/10.1016/j.adiac.2016.09.003
Kolev, K. (2008). Do investors perceive marking-to-model as marking-to-myth? Early
Evidence from FAS 157 Disclosure. Working Paper, New York University.
http://dx.doi.org/10.2139/ssrn.1336368
Larcker, D. F., Richardson, S. A., & Tuna, I. (2007). Corporate governance, accounting outcomes, and organizational performance. The accounting review, 82(4), 963-1008.
http://dx.doi.org/10.2308/accr.2007.82.4.963
Laux, C., & Leuz, C. (2009). The crisis of fair value accounting: making sense of the recent
debate. Accounting, Organizations and Society, 34(6-7), 826-834.
http://dx.doi.org/10.1016/j.aos.2009.04.003
Libby, R., & Rennekamp, K. (2012). Self-serving attribution bias, overconfidence, and the issuance of management forecasts. Journal of Accounting Research, 50, 197-231.
Lin C. J., Liu, Y. P., & Shiue, M. J. (2009). Board characteristics and overvalued equity: evidence from Taiwan. International Research Journal of Finance and Economics, 32,
104-113.
Malmendier, U., & Tate, G. (2005). CEO overconfidence and corporate investment. Journal
of Finance,60, 2660-2700. http://dx.doi.org/10.1111/j.1540-6261.2005.00813.x
Malmendier, U., & Tate, G. (2008). Who makes acquisitions? CEO overconfidence and the
market's reaction. Journal of Financial Economics, 89(1), 20-43.
http://dx.doi.org/10.1016/j.jfineco.2007.07.002
Malmendier, U., Tate, G., & Yan, J. (2011). Overconfidence and early life experiences: the effect of managerial traits on corporate financial policies. Journal of Finance, 66, 1687-1733.
http://dx.doi.org/10.1111/j.1540-6261.2011.01685.x
Morck, R., Shleifer, A., & Vishny, R. W. (1988). Management ownership and market valuation: an empirical analysis. Journal of Financial Economics, 20, 293-315.
http://dx.doi.org/10.1016/0304-405X(88)90048-7
Moyer, S. (1990). Capital Adequacy ratio regulations and accounting choices in commercial
banks. Journal of Accounting and Economics (July), 123-154.
http://dx.doi.org/10.1016/0165-4101(90)90027-2
Osma, B. G. (2008). Board independence and real earnings management: The case of R&D
expenditure. Corporate Governance, 16(2), 116-131.
http://dx.doi.org/10.1111/j.1467-8683.2008.00672.x
Riedl, E., & Serafeim, G. (2011). Information risk and fair values: An examination of equity
betas. Journal of Accounting Research, 49(4), 1083-1122.
http://dx.doi.org/10.1111/j.1475-679X.2011.00408.x
Schrand, C. M., & Zechman, S. L. (2012). Executive overconfidence and the slippery slope to
financial misreporting. Journal of Accounting and Economics, 53, 311-329.
http://dx.doi.org/10.1016/j.jacceco.2011.09.001
Song, C., Thomas, W., & Yi, H. (2010). Value relevance of FAS No. 157 fair value hierarchy information and the impact of corporate governance mechanisms. The Accounting Review, 85(4), 1375-1410. http://dx.doi.org/10.2308/accr.2010.85.4.1375
Valencia, A. (2011). Opportunistic behavior using Level 3 fair-values under SFAS 157.
Unpublished Doctoral dissertation, The Florida State University.
Visvanathan, G. (2008). Corporate governance and real earnings management. Academy of
Accounting and Financial Studies Journal,12(1), 9-22.
Wong, W. (2008). How much time-inconsistency is there and does it matter? Evidence on self-awareness, size, and effects. Journal of Economic Behavior & Organization, 68(3-4),
Yermack, D. (1996). Higher valuation of companies with a small board of directors. Journal