Open Access
Research
How can accelerated development of bioenergy contribute to the
future UK energy mix? Insights from a MARKAL modelling exercise
Donna Clarke
1, Sophie Jablonski
2, Brighid Moran
3, Gabrial Anandarajah
4and Gail Taylor*
1Address: 1School of Biological Sciences, University of Southampton, Southampton, UK, 2Imperial College Centre for Energy Policy and
Technology, Mechanical Engineering Building, London, UK, 3Institute for Energy Systems, School of Engineering, University of Edinburgh,
Edinburgh, UK and 4Geography Department, School of Social Science and Public Policy, King's College London, London, UK
Email: Donna Clarke - [email protected]; Sophie Jablonski - [email protected]; Brighid Moran - [email protected]; Gabrial Anandarajah - [email protected]; Gail Taylor* - [email protected]
* Corresponding author
Abstract
Background: This work explores the potential contribution of bioenergy technologies to 60% and 80% carbon reductions in the UK energy system by 2050, by outlining the potential for accelerated technological development of bioenergy chains. The investigation was based on insights from MARKAL modelling, detailed literature reviews and expert consultations. Due to the number and complexity of bioenergy pathways and technologies in the model, three chains and two underpinning technologies were selected for detailed investigation: (1) lignocellulosic hydrolysis for the production of bioethanol, (2) gasification technologies for heat and power, (3) fast pyrolysis of biomass for bio-oil production, (4) biotechnological advances for second generation bioenergy crops, and (5) the development of agro-machinery for growing and harvesting bioenergy crops. Detailed literature searches and expert consultations (looking inter alia at research and development needs and economic projections) led to the development of an 'accelerated' dataset of modelling parameters for each of the selected bioenergy pathways, which were included in five different scenario runs with UK-MARKAL (MED). The results of the 'accelerated runs' were compared with a low-carbon (LC-Core) scenario, which assesses the cheapest way to decarbonise the energy sector.
Results: Bioenergy was deployed in larger quantities in the bioenergy accelerated technological development scenario compared with the LC-Core scenario. In the electricity sector, solid biomass was highly utilised for energy crop gasification, displacing some deployment of wind power, and nuclear and marine to a lesser extent. Solid biomass was also deployed for heat in the residential sector from 2040 in much higher quantities in the bioenergy accelerated technological development scenario compared with LC-Core. Although lignocellulosic ethanol increased, overall ethanol decreased in the transport sector in the bioenergy accelerated technological development scenario due to a reduction in ethanol produced from wheat.
Conclusion: There is much potential for future deployment of bioenergy technologies to decarbonise the energy sector. However, future deployment is dependent on many different factors including investment and efforts towards research and development needs, carbon reduction targets and the ability to compete with other low carbon technologies as they become deployed. All bioenergy technologies should become increasingly more economically competitive with fossil-based technologies as feedstock costs and flexibility are reduced in line with technological advances.
Published: 3 July 2009
Biotechnology for Biofuels 2009, 2:13 doi:10.1186/1754-6834-2-13
Received: 30 January 2009 Accepted: 3 July 2009
This article is available from: http://www.biotechnologyforbiofuels.com/content/2/1/13
© 2009 Clarke et al; licensee BioMed Central Ltd.
Background
UK energy and climate change policy context
The UK Government states in the Energy White Paper 2007 [1] that the UK faces two long-term energy chal-lenges, tackling climate change by reducing carbon diox-ide emissions both within the UK and abroad and ensuring secure, clean and affordable energy. Following a recommendation by the new Committee on Climate Change (CCC) in 2008, the UK's CO2 reduction target was increased in the Climate Change Act from 60% to 80% below 1990 levels by 2050. Renewable energy is required as part of the future UK energy portfolio in order to meet CO2 reduction targets and improve energy security. An 80% reduction in CO2 emissions by 2050 coupled to the EU target of 15% supply of UK energy from renewables by 2020, represents ambitions that will require technology innovation, and better renewable deployment, as high-lighted in the 2007 Stern Review [2].
The IEA's Technology Perspective [3] draws attention to the need for accelerated cost reductions and increased improvements in both new and existing energy technolo-gies. The IEA recognises this will take a large commitment to research, development and demonstration (RD&D) from the private and public sectors.
Bioenergy technologies and their potential contribution to the UK's carbon ambitions
Bioenergy is one of the most prominent options to reduce CO2 emissions, if it is produced in a sustainable way, and currently contributes approximately 80% of renewable power production in the UK [4]. Most of this, however, is from methane associated with landfill. Which bioenergy technologies are deployed in the future will depend partly on national and international policies and support, but the move towards a low carbon economy, with a price associated with carbon, is also likely to stimulate technol-ogy development for renewables [3]. It is predicted that near future investments in European countries are likely to focus on renewables, among other energy sectors, with an emphasis on biomass [3].
Bioenergy technologies are numerous and varied, incor-porating many feedstocks, methods of conversion and supply routes to end products and end uses. In addition, bioenergy technologies can be found at all levels of matu-rity ranging from well established proven technologies, to new technologies that are in the research and develop-ment (R&D) phase. As a consequence, it is not possible to characterise the maturity of the bioenergy field as a whole. This can also partially explain why bioenergy research remains extensive and cross-disciplinary. Finally, such multi-disciplinarity and complexity means that it is not yet well understood how influential technological
devel-opment will be for bioenergy's contribution to future low carbon energy systems.
The objective
The main objective of this paper is to explore the possible contribution of emerging bioenergy technology to the UK energy system by 2050, by outlining the potential for accelerated technology development (ATD) of bioenergy systems in the UK. We aim to gain insight into how bioen-ergy technologies may contribute to meeting the 80% car-bon reduction targets for a low carcar-bon energy system in the UK, by using a MARKAL model complemented by rel-evant qualitative storylines highlighting key factors under-pinning modelled technological development.
The UK Energy Research Centre Energy 2050 project and modelling context
The UK Energy Research Centre (UKERC) Energy 2050 project focuses on how the UK energy system may move towards a resilient, low-carbon system by 2050, while providing energy security [5]. By using a set of four core scenarios ('Reference', 'Low Carbon', 'Resilient' and 'Low Carbon Resilient'), and variant scenarios (such as the 'Accelerated Technology Development' scenarios), the project incorporates the policy, environmental and social aspects which may lead to possible future UK energy sys-tems [5]. As part of the UKERC Energy 2050 project, UK-MARKAL (MED) was used to explore the possible contri-bution of accelerated technology development to the uptake of bioenergy-based technologies in the UK energy system by 2050. MARKAL is a technology-rich, least cost optimisation model which has been used in the past to inform energy policy [6]. A fuller description of the UK MARKAL Energy System Model is described by Strachan et al. [7] and the way bioenergy is modelled by Jablonski et al. [6].
Bioenergy pathways are represented in MARKAL by more than 100 directly relevant technologies in the different modules of the model (and more than 200 indirectly rel-evant ones). Figure 1 provides a simplified representation of the bioenergy conversion pathways in MARKAL (high-lighting the lignocellulosic ethanol, gasification and fast pyrolysis pathways).
Methods
Overview of the methodological framework
Criteria used for (and results of) bioenergy technology selection
In order to explore accelerated technology development of bioenergy, this research focused specifically on acceler-ated development of the bioenergy technology field, not accelerated deployment. Bioenergy is a wide field, repre-senting a large number of chains with many feedstocks, conversions and supply routes that feed into heat, power and liquid biofuels in the UK [8] and it was not possible to study all pathways in detail. To focus on a limited number of bioenergy chains, a set of technologies were chosen which had, (i) the greatest potential for technol-ogy development and commercial deployment; (ii) were represented in the MARKAL model; and (iii) had the potential to be environmentally sustainable in the long term, with the focus on bioenergy pathways with the potential to be technically available, assuming that no additional pressures on biodiversity, soil or water resources are exerted compared with a development with-out bioenergy production, in line with the 2006 European Environment Agency report [9]. Based on these criteria, the chains and technologies selected for an extensive exploration of the potential for ATD of bioenergy systems in the UK included (Table 1) the following.
The conversion of lignocellulosic second generation feedstock to bioethanol
This was chosen because considerable technological advances are likely [10] and because liquid biofuels pro-vide one of the few options for fossil fuel replacement in the short to medium term, with the potential to offer both greenhouse gas savings and energy security [11].
Gasification of solid biomass
Although this is not a new technology, gasification was selected as it a process working towards deployment at demonstration and commercial scale and technology development is possible [12]. This modelling exercise focused on gasification of dedicated energy crops used directly for electricity generation, rather than on technol-ogies where biomass is first converted into biogas and upgraded into bio-methane before being transformed into electricity through a (natural) gas turbine.
Fast pyrolysis of biomass for the production of bio-oil
This is a technology largely at the early commercial stage; however, the production of transport fuels via fast pyroly-sis is still in the R&D stage with potential for further advances [13]. This exercise focused on the pyrolysis of
UK-MARKAL (MED) simplified bioenergy chains, with gasification, lignocellulosic bioethanol and fast pyrolysis bio-oil high-lighted
Figure 1
UK-MARKAL (MED) simplified bioenergy chains, with gasification, lignocellulosic bioethanol and fast pyrolysis bio-oil highlighted.
Starch Sugars
Wet residues and agro-industrial bio-wastes
Dry animal residues Ligno-cellulosic dry biomass,
incl. crops residues and straw Oil
plants
Fermentation
Anaerobic Digestion
Hydrolysis (Fast)
pyrolysis
Hydro-genolysis
Este-rification
Gasification
Combustion
Distillation Refining to
bio-methane
Fisher-Tropsch
Bio-diesel
Bio-Hydrogen
Bio-methane
Hydrogen synthesis
Bio-ethanol
Heat, electricity, transport (energy services demand)
Pellet-isation Upgrade
to LFO
wood to produce bio-oil. Within the model, this bio-oil can go to three possible pathways: further pyrolysis to hydrogen, leading to the transport module; upgrade of pyrolysis oil into light fuel oil, which goes to the industry, residential or services sector, or upgrade of pyrolysis oil into bio-diesel, which goes to electricity production or transport.
Bioengineering of energy crops
This represents one of the underpinning technologies, as feedstock prices underpin many of the costs associated with bioenergy chains. The focus was on improvements through better breeding to advance dedicated second gen-eration energy grasses and trees, not food crops. We focused on non-GM crops and domestic (UK) crops. The
focus on domestic crops only was to reflect long-term environmental sustainability goals.
Agro-machinery for growing and harvesting energy crops
The other underpinning technological improvement selected was the potential for improved machinery for grow-ing and harvestgrow-ing dedicated bioenergy crops. Good site preparation and weed elimination are highly influential on the performance of many energy crops, and improvements in these areas are important. There are also crop losses asso-ciated with inefficient harvesting/picking up of cut energy crops for example, which need to be addressed. Improve-ment in both agro-machinery and bioengineering of energy crops are likely to affect learning curves and supply costs for multiple bioenergy chains [14].
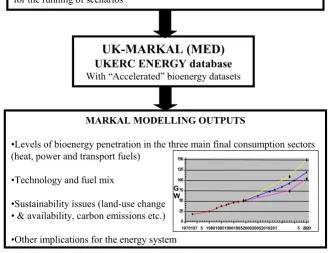
Methodology framework used to assess the potential accelerated technology development (ATD) of bioenergy chains Figure 2
Methodology framework used to assess the potential accelerated technology development (ATD) of bioen-ergy chains.
UK-MARKAL (MED)
UKERC ENERGY database
With “Accelerated” bioenergy datasets MARKAL MODELLING INPUTS
•“Accelerated” UK-MARKAL (MED) inputs with regards to selected bioenergy pathways and technologies: capital costs, O&M costs, efficiencies etc.
•Use of standard UK-MARKAL (MED) other inputs: energy sources, technology characteristics, existing policies, etc.
•Definition of constraints (environmental, policies etc.) to be implemented for the running of scenarios
MARKAL MODELLING OUTPUTS
•Levels of bioenergy penetration in the three main final consumption sectors (heat, power and transport fuels)
•Technology and fuel mix
•Sustainability issues (land-use change • & availability, carbon emissions etc.)
•Other implications for the energy system 0 25 50 75 100 125 150
1970197 5 1980198519901995200020052010201 5 2020
Data collection for the ATD Bioenergy for UK-MARKAL (MED) modelling
The current status of each of the five chains and their potential for acceleration were assessed using data col-lected on both a qualitative (R&D needs, UK and interna-tional research efforts, and policy considerations) and a quantitative basis. This information was obtained from published literature, government reports and expert con-sultation.
Qualitative information for the scenarios was used to esti-mate possible future technology developments until 2050, through processes such as gradual changes, step changes and innovation, as well as gaining an understand-ing of the possible milestones for each technology.
The ATD bioenergy quantitative dataset was compiled for each of the five technologies using optimistic figures from literature searches and expert consultation to represent accelerated technology development from 2000 to 2050. The information available varied widely between the five technologies chosen. Accordingly, the assumptions and the process by which the data in the literature was used to determine the accelerated dataset are described below for each technology separately. The data collected consisted
of figures on capital cost, operating and maintenance cost, technical efficiency, defined as the ratio between the use-ful output of energy conversion to the input, annual avail-ability, defined as the share of the installed capacity that is used during a year (average share of the year), plant life-time in the case of electricity generation and for biotech-nological advances for second generation bioenergy crops, energy content and yield. Acceleration was repre-sented through reducing costs, increasing efficiencies and including earlier availability for the technologies, in line with the literature and expert consultation. Since the UK-MARKAL database costs are in pounds sterling (GBP), all cost data were converted to GBP on a year 2000 basis.
Overview of the modelled bioenergy ATD scenarios
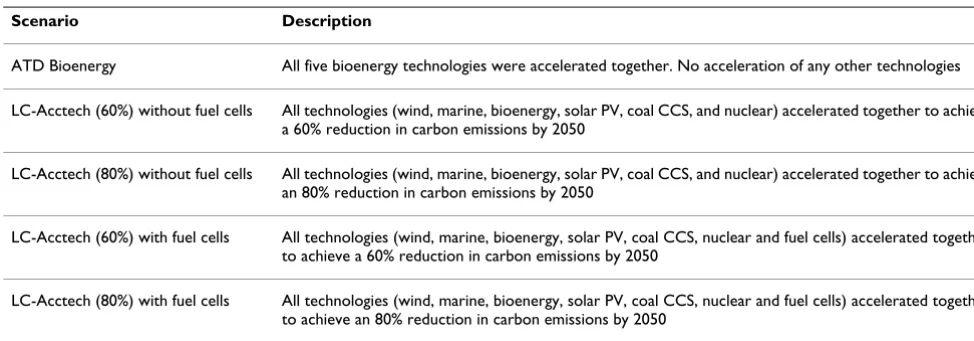
Once the data on accelerated technology development for selected bioenergy pathways was compiled, it was included in the modelling of five different 'accelerated' scenarios (Table 2) to explore how bioenergy technolo-gies may penetrate the UK energy market if technology development is accelerated. These accelerated scenarios were built around the UKERC Energy 2050 project scenar-ios. The scenarios were produced as a 'what-if' exercise to determine how accelerated technology development could influence the future energy mix to reflect possible
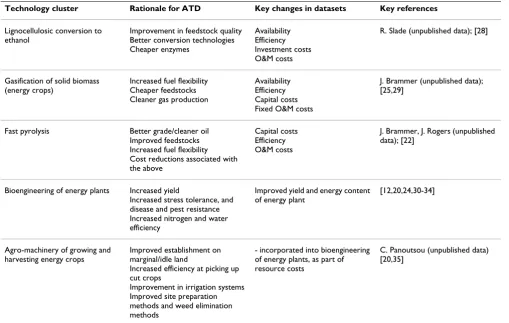
Table 1: Rationale used to develop the accelerated technology development (ATD) scenarios for the five technologies.
Technology cluster Rationale for ATD Key changes in datasets Key references
Lignocellulosic conversion to ethanol
Improvement in feedstock quality Better conversion technologies Cheaper enzymes
Availability Efficiency Investment costs O&M costs
R. Slade (unpublished data); [28]
Gasification of solid biomass (energy crops)
Increased fuel flexibility Cheaper feedstocks Cleaner gas production
Availability Efficiency Capital costs Fixed O&M costs
J. Brammer (unpublished data); [25,29]
Fast pyrolysis Better grade/cleaner oil
Improved feedstocks Increased fuel flexibility Cost reductions associated with the above
Capital costs Efficiency O&M costs
J. Brammer, J. Rogers (unpublished data); [22]
Bioengineering of energy plants Increased yield
Increased stress tolerance, and disease and pest resistance Increased nitrogen and water efficiency
Improved yield and energy content of energy plant
[12,20,24,30-34]
Agro-machinery of growing and harvesting energy crops
Improved establishment on marginal/idle land
Increased efficiency at picking up cut crops
Improvement in irrigation systems Improved site preparation methods and weed elimination methods
- incorporated into bioengineering of energy plants, as part of resource costs
technology improvements through present and future R&D efforts and, therefore, should not be taken as being predictive.
This paper focuses on the contribution of bioenergy to decarbonising the energy system; however, further explo-ration of the other technology scenarios can be found in the forthcoming ATD report from UKERC Energy 2050 [15].
Application to selected bioenergy chains in the UK
The Accelerated Bioenergy scenario; how acceleration was modelled
The representation of technological development in MARKAL has been done by the introduction of technolo-gies' vintages (that is, similar technologies available at dif-ferent times) with differing parameters corresponding to technological evolution, to represent learning effects or other advances in technology development. These param-eters include capital cost, efficiency, operating and main-tenance (O&M) costs, both fixed and variable, and where appropriate, availability, contribution to peak load, and plant life time.
It is important to have an understanding of the R&D needs of a technology pathway when assessing its poten-tial for accelerated technology development. Understand-ing the major hurdles to development and deployment is also critical when considering the likelihood of technol-ogy breakthroughs and step changes within a technoltechnol-ogy pathway.
Bioenergy is diverse and flexible, covering many feedstock resources, conversion pathways and outputs [16]. As such, there are unique R&D needs for each of these different ele-ments of the bioenergy chain. There are, however, two critical areas of R&D for the bioenergy field as a whole: improving crops and improving conversion technologies [4,16].
The development of new dedicated bioenergy crops for feedstocks is one of the most fundamental R&D needs for bioenergy, as this underpins the development and cost of many bioenergy conversion technologies [4]. The UKERC Research Atlas for bioenergy [16] identifies research chal-lenges for bioenergy over the next 5 years including the development and delivery of new cultivars from past and current research and breeding of dedicated energy crops. In the next 10 years, there is a need to improve the total yield and develop new genotypes for a range of bioenergy crops, including oil seed crops, aquatic biomass, woody lignocellulose and grasses. R&D needs for second genera-tion energy crops include new genotypes and selective breeding to increase yields and system efficiencies, such as improving stress tolerance, disease and pest resistance, increased photosynthetic, nitrogen and water use effi-ciency and increased biomass production (Table 1) [4,16-19]. It is likely that a 30% increase on current yield will be possible over the next 10 to 15 years, using traditional breeding and selection [4]. Advances in biotechnology of second generation bioenergy crops will additionally help to make feedstocks cheaper, which is important for tech-nologies such as the production of lignocellulosic etha-nol, gasification and fast pyrolysis, which require cheaper feedstocks if overall costs are to be reduced (J. Brammer, J. Rogers, unpublished data).
Improved establishment of dedicated bioenergy crops on marginal and idle land, as recommended by the Gallagher Review [13] would also help to reduce land competition and avoid displacement of food crops, possibly increasing the social acceptance of bioenergy. This could increase the land area available to produce energy crops.
Advances in site preparation, weed elimination [16] and improvements in the agro-machinery used to grow and harvest dedicated bioenergy crops is additionally needed (C. Panoutsou, unpublished data). Improvements
Table 2: Description of the five scenarios run as part of the accelerated technology development (ATD) scenarios.
Scenario Description
ATD Bioenergy All five bioenergy technologies were accelerated together. No acceleration of any other technologies
LC-Acctech (60%) without fuel cells All technologies (wind, marine, bioenergy, solar PV, coal CCS, and nuclear) accelerated together to achieve a 60% reduction in carbon emissions by 2050
LC-Acctech (80%) without fuel cells All technologies (wind, marine, bioenergy, solar PV, coal CCS, and nuclear) accelerated together to achieve an 80% reduction in carbon emissions by 2050
LC-Acctech (60%) with fuel cells All technologies (wind, marine, bioenergy, solar PV, coal CCS, nuclear and fuel cells) accelerated together to achieve a 60% reduction in carbon emissions by 2050
include increasing not only the engine/fuel efficiency of agro-machines, but also their efficiency at picking up the harvested crop to reduce crop losses [20], integrating dif-ferent crop types with difdif-ferent harvest times, and produc-ing better irrigation systems which can cope with particles contained in recycled water (C. Panoutsou, unpublished data).
Technical improvements in existing conversion gies such as gasification, and novel conversion technolo-gies like fast pyrolysis, are also needed. R&D needs for both of these technologies include increasing conversion efficiency, reducing overall technology costs, increasing fuel flexibility so that a variety of new energy crops can be utilised as feedstocks and improving product quality through gas cleaning in gasification and producing cleaner bio-oil from fast pyrolysis [11,18,21-25]. All of these improvements will push gasification and fast pyrol-ysis technologies towards commercial deployment through increased economic viability, via the ability to scale-up.
The economic competitiveness of biofuels compared with conventional fuels is a key barrier in the deployment of biomass in the transport sector [26]. In order to stimulate a more efficient and sustainable conversion from lignocel-lulosic biomass to ethanol, key R&D needs include the improvement of feedstock flexibility and quality to enable easier breakdown of cell walls, in particular less lignin, but also development of in-situ enzyme systems for wall disas-sembly [10,26]. Better conversion technologies, with less pre-processing and enzymes with lower costs are also required [10] to make lignocellulosic ethanol more eco-nomically competitive with conventional fuel.
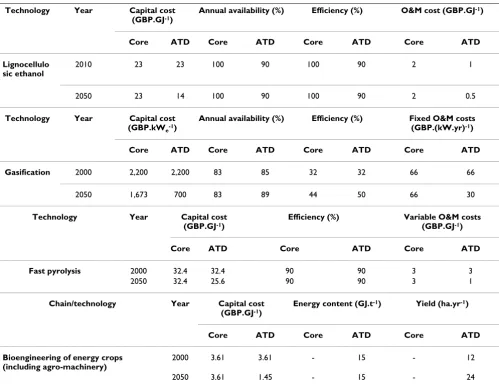
Table 1 lists the rationale, and parameters which were changed to represent accelerated technology development for each of the five bioenergy chains, while Table 3 com-pares how accelerated technological development was represented in UK-MARKAL (MED) for the ATD scenarios to reflect possible technology improvements through present and future R&D efforts. The changes between the LC-Core scenario and the ATD scenarios are outlined in more detail below. Although these datasets are based on extensive literature reviews and expert consultant, it is important to highlight that these cost reductions are very uncertain and all figures should be taken with caution.
Lignocellulosic ethanol
Major technology improvements and accelerated develop-ment which will reduce overall costs and increase effi-ciency of lignocellulosic conversion to ethanol are expected from a combination of improvements in feed-stock quality, with reduced lignin for better breakdown of cell walls, cheaper enzymes and more efficient conversion
technologies, which require less pre-processing, plus an improvement in the fermentation process (Table 1).
Parameters changed within MARKAL included capital costs and O&M costs. All other costs associated with this technology were kept the same as the core scenario. The parameters used to model lignocellulosic ethanol conver-sion were changed as follows to represent accelerated development (Table 3).
Lignocellulosic ethanol is available in the model from 2010. In the core scenario, it is modelled with an annual availability of 100%, which was reduced slightly to 90% in the accelerated scenario.
In the core scenario the efficiency is modelled as 90%. Although this figure is too high, with expected efficiencies to be around 30 to 40% (R. Slade, unpublished data), the efficiency was kept at 90% in order to keep it comparable to the non-accelerated scenario and to avoid any drastic model 'deceleration', as this would be contrary to the aim of the exercise. Laser et al. [27] suggested that mature cel-lulosic ethanol technology could reach efficiencies of 68% in combination with GTCC. The figures used to represent accelerated development, therefore, should be taken with caution, and are used as an illustration only, not a predic-tion of technical improvement.
The investment costs of lignocellulosic ethanol conver-sion in the core scenario are 23 GBP.GJ-1, which is in line
with recent US Department of Energy (DOE) research [28]. In the accelerated scenario, investment costs were reduced following the trend indicated by DOE to reach 14 GBP.GJ-1 by 2050. These changes in investment costs are
likely to occur as economies of scale are obtained when it is possible to construct larger plants (in line with increased investors' trust, better access to capital etc.) (R. Slade, unpublished data).
For the variable O&M costs, the data used in the core sce-nario (1.9 GBP.GJ-1) seems too high. In the accelerated
scenario, O&M costs were reduced to 5% of the invest-ment costs in 2000 and 2010, and to 2% of the total investment costs by 2050. These percentages are in line with expert analysis and estimates on expected develop-ment of the technology (R. Slade, unpublished data).
Gasification
above, an increase in feedstock flexibility would greatly help to reduce the over-costs of this technology (J. Rogers, unpublished data).
The main figures used for the cost assessment of gasifica-tion were obtained from the Department of Trade and Industry (DTI) [29] (a forerunner of the Department for Business, Enterprise and Regulatory Reform (BERR)) in the UK and the National Renewable Energy Laboratory (NREL) Power Energy Technologies Databook in the US [25], and figures used are therefore based on the assump-tions used within these reports. When unavailable, project costs to 2050 have been extrapolated via cost curves from the optimistic figures given in the energy crop gasification literature.
Energy crop gasification is represented in MARKAL by existing gasification (2000) and a number of technology 'vintages' in the model, including one at 2010, 2020,
2030 and 2040. The following data were used for the ATD gasification scenario (Table 3).
The annual availability in 2000 was modelled at 83% in the core scenario. For the accelerated technology scenario, this was increased to 85% in 2000 in line with the DTI economics report [29], and increased gradually to 89% by 2050.
The efficiency data for 2000 was kept at the same starting point for both scenarios (32%), but was increased to 47% in 2010 and 2020, and 50% in 2030 and 2040 in the accelerated scenario [29].
Capital costs for the accelerated scenario were kept the same in 2000 as in the core scenario at 2,200 GBP.kWe-1,
reducing to 1,450 GBP.kWe-1 in 2010, and 700 GBP.kW e-1
by 2020 as reported in the DTI [29] and could occur from a combination of factors. This cost was then assumed to
Table 3: LC-Core and ATD Bioenergy data for UK-MARKAL.
Technology Year Capital cost
(GBP.GJ-1)
Annual availability (%) Efficiency (%) O&M cost (GBP.GJ-1)
Core ATD Core ATD Core ATD Core ATD
Lignocellulo sic ethanol
2010 23 23 100 90 100 90 2 1
2050 23 14 100 90 100 90 2 0.5
Technology Year Capital cost
(GBP.kWe-1)
Annual availability (%) Efficiency (%) Fixed O&M costs (GBP.(kW.yr)-1)
Core ATD Core ATD Core ATD Core ATD
Gasification 2000 2,200 2,200 83 85 32 32 66 66
2050 1,673 700 83 89 44 50 66 30
Technology Year Capital cost
(GBP.GJ-1)
Efficiency (%) Variable O&M costs (GBP.GJ-1)
Core ATD Core ATD Core ATD
Fast pyrolysis 2000 32.4 32.4 90 90 3 3
2050 32.4 25.6 90 90 3 1
Chain/technology Year Capital cost
(GBP.GJ-1)
Energy content (GJ.t-1) Yield (ha.yr-1)
Core ATD Core ATD Core ATD
Bioengineering of energy crops (including agro-machinery)
2000 3.61 3.61 - 15 - 12
2050 3.61 1.45 - 15 - 24
level off after 2020 based on technology assumptions from the literature.
Under the accelerated technology scenario, the fixed O&M costs in 2000 were kept at 66 GBP.(kWe.yr)-1, decreasing
to 51.5 GBP.(kWe.yr)-1 in 2010 and to 30 GBP.(kW e.yr)-1
by 2030 to 2040 to be consistent with figures reported in the DTI ecomomics report and NREL powerbook [25,29].
Fast pyrolysis
The accelerated development of fast pyrolysis and there-fore the ATD figures are based on producing cleaner bio-oil, improving processing and increasing the fuel flexibil-ity of fast pyrolysis (Table 1). Although there were a number of studies that examined the economics of fast pyrolysis, many were unsuitable because they either meas-ured the cost of the bio-oil production rather than the cap-ital cost, or because they did not present enough information to convert their cost figures into a compara-ble capital cost as found in the model. The one study that was applicable was from the DTI [24]. This study pre-sented a low, medium, and high levelised capital cost esti-mate from 2005 to 2020 in GBP.MWh-1.
The DTI's medium scenario was in line with the LC-Core scenario data. In order to show the potential for accelera-tion of fast pyrolysis, in keeping with the discussions with experts (J. Rogers, J. Brammer, unpublished data) and the literature available, the costs were kept the same for both the core and accelerated scenario in 2005 at 32.4 GBP.GJ -1, but then were linearly reduced in the accelerated
sce-nario until 2020 to 25.6 GBP.GJ-1 (DTI's low estimate)
(Table 3). The capital costs were kept level from 2020 to 2050, although lower costs might be possible if feedstocks become cheaper (J. Rogers, unpublished data).
The efficiency of fast pyrolysis in the accelerated scenario did not change from the 90% found in the core scenario. Variable O&M costs were modelled in 2000 in both sce-narios at 3 GBP.GJ-1. In the accelerated scenario, however,
O&M costs were reduced after 2000 to represent a figure of 4% of the capital costs, dropping to 1 GBP.GJ-1 by 2050
(to be consistent with the literature [22]).
Bioengineering of energy plants
Acceleration of bioengineering of energy plants focused on domestic energy crops (within the UK) to reflect the environmental sustainability criteria. Imported energy crops were not accelerated. Improvements in the yield of energy crops are predicted to be the major factor that will accelerate the development of energy crops (Table 1), and therefore, future crop costs were based on a doubling of the average yield by 2050 and, to some extent, improve-ments in agro-machinery for growing and harvesting energy crops.
A literature review of energy crop costs highlighted the wide range of plants suitable as bioenergy crops. Data obtained for this scenario, however, focused only on those crops which are suitable to be grown in the UK (mis-canthus, willow, switchgrass and poplar).
Although there are a wide variety of bioenergy crops with different crop costs, MARKAL uses an average figure to represent all energy crops. The estimates for crops from the literature e.g. [30-34] therefore were averaged to give one 'energy crop' cost, to be consistent with current meth-ods used in the model. All costs found in these studies were converted into a comparable unit (GBP.GJ-1) using
an assumption of average yield of 12 t.(ha.yr)-1 increasing
to a future yield of 24 t.(ha.yr)-1 in 2050.
To model accelerated development of energy crops, costs for 2000 were kept the same as the core scenario at 3.61 GBP.GJ-1, but in the ATD scenario this was decreased to
2.9 GBP.GJ-1 in 2010 and 1.45 GBP.GJ-1 by 2050, to
repre-sent a gradual improvement in biotechnology from 2000 to 2050 (Table 3). As gradual improvements (rather than step changes) are expected, the costs were modelled as a linear decline between these capital cost points. In addi-tion to reducing the crop costs, the predicted increase in yield would also increase the upper bounds of available crops (with higher yields, more crops can be grown on the same amount of land). Therefore, in the accelerated sce-nario, the upper bound of domestic energy crops available was doubled to reflect the doubling of yield.
Agro-machinery
No new changes were made to the accelerated develop-ment dataset due to improvedevelop-ments in agro-machinery (Table 1). Improvements in agro-machinery are expected to be one of the factors influencing the declining costs of growing and harvesting energy crops. Accordingly, these improvements were included as a factor affecting the bio-engineering of energy plants accelerated data, as both of these underpinning technologies are represented as one resource cost in MARKAL.
Results
Bioenergy penetration in the Bioenergy ATD scenario
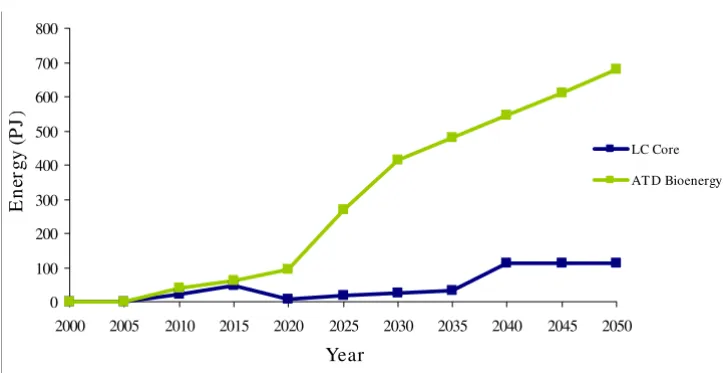
Overall, there is a larger uptake of bioenergy in the ATD Bioenergy scenario than in the LC-Core scenario.
Resources
sce-nario and produces a maximum of 113 PJ of domestic energy crops. The production of energy crops in the ATD scenario, however, reaches a physical constraint when all available domestic land for energy crop production is uti-lized in 2030 (at 415 PJ). Energy crops continue to increase in terms of PJ, after 2030 in the ATD scenario due to the accelerated assumption of increasing yields. This allows for increased energy from energy crops on the same amount of land. Accordingly, in 2050, there are 679 PJ of energy crops in the ATD scenario (compared with 113 PJ in LC-Core).
Electricity sector
The production of electricity from biomass (primarily from gasification) reaches a peak of 277 PJ of electricity (roughly 19% of total electricity generation) in 2035 in the ATD scenario, compared with a peak of only 62 PJ in the LC-Core in 2025 (Figure 4). This increase in uptake is largely due to an increased adoption of gasification tech-nologies in the ATD scenario. Gasification of solid bio-mass (energy crops) is first selected as a viable option for electricity generation in 2010 in both scenarios. However, high levels of energy crop gasification are deployed for electricity generation in the ATD scenario, whereas gasifi-cation is not deployed after 2010 in the LC-Core scenario.
In the ATD scenario, the use of solid biomass for electric-ity generation increases until 2040, when it reaches 481 PJ of energy crops. After 2040 the use of energy crops for electricity generation decreases, reaching 284 PJ by 2050 (Figure 5). This decline occurs because energy crops are shifted away from electricity production to be used for heating in the residential sector after 2040.
The deployment of gasification in the ATD Bioenergy sce-nario has an effect on the deployment of other electricity generation technologies. It takes significant market share from wind from 2015 to 2050 and from nuclear in the medium term (2025 to 2035).
The deployment of gasification in the ATD scenario also has some smaller effects on the levels of adoption of other bioenergy technologies. For instance, biomass district heating technologies (heat only) in the ATD Bioenergy scenario are used more than in the LC-Core scenario in the short term, but significantly less in the longer term. In addition, the deployment of gasification also means that biomass CHP plant (LTH) is never deployed in the ATD scenario whereas it was deployed from 2035 onwards in the LC-Core scenario.
Residential/service sector
Accelerated technology development of bioenergy creates changes in the residential heating sector when compared with the LC-Core scenario (Figure 6). There is an uptake of solid biomass (from energy crops) in the residential/ service sector in 2045 in both scenarios, but it is much higher in the ATD scenario. In the LC-Core scenario there are 80 PJ for residential heat by 2050 while in the ATD sce-nario there are 395 PJ by 2050.
In the service sector, woodchips are displaced by pellets (from energy crops) from 2040 onwards in the ATD sce-nario, unlike the LC-Core scenario where wood is used until 2050. The increasing use of energy crops for the res-idential and service sectors in the long term corresponds to the timing of the declining use of energy crops for elec-tricity and the continuing increase in production of energy crops.
Energy crop production Figure 3
Energy crop production. LC-Core (blue) and the accelerated technology development (ATD) Bioenergy scenario (green). 0
100 200 300 400 500 600 700 800
2000 2005 2010 2015 2020 2025 2030 2035 2040 2045 2050
Year
En
er
g
y
(
P
J
)
LC Core
Transport sector
Overall, final energy demand from biomass in the trans-port sector does not differ significantly between the LC-Core and ATD Bioenergy scenarios. The total transport fuel demand is the same in both scenarios until 2035 to 2040, when the total transport fuel demand in the ATD is slightly higher (152 PJ) than in the LC-Core (142 PJ) (Fig-ure 7). However, by 2050 the transport fuel mix in the ATD scenario has more conventional transport fuels than the LC-Core. In the ATD scenario, there is less ethanol and
more biodiesel, diesel and petrol than in the LC-Core sce-nario.
The overall impact of acceleration on ethanol is negative because less domestic ethanol is produced in the ATD sce-nario. Imported ethanol remains at similar levels in both scenarios. There are two pathways for the production of ethanol in MARKAL: traditional straw fermentation and lignocellulosic conversion to ethanol. In the ATD sce-nario, traditional ethanol from wheat straw fermentation
Electricity produced from biomass Figure 4
Electricity produced from biomass. LC-Core (blue) and the accelerated technology development (ATD) bioenergy sce-nario (green).
-50 100 150 200 250 300
2000 2005 2010 2015 2020 2025 2030 2035 2040 2045 2050
Year
En
e
rg
y
(P
J
)
LC Core
ATD Bioenergy
The distribution of solid biomass for electricity production Figure 5
The distribution of solid biomass for electricity production. LC-Core (blue) and the accelerated technology develop-ment (ATD) bioenergy scenario (green).
0 100 200 300 400 500 600
2000 2005 2010 2015 2020 2025 2030 2035 2040 2045 2050 Year
En
e
rg
y
(
PJ
)
LC Core
The use of biomass in the residential heating sector Figure 6
The use of biomass in the residential heating sector. LC-Core (blue) and the accelerated technology development (ATD) bioenergy scenario (green).
0 50 100 150 200 250 300 350 400
2000 2005 2010 2015 2020 2025 2030 2035 2040 2045 2050
Year
En
er
g
y
(
P
J
)
LC Core
ATD Bioenergy
Final energy demand for biofuels in the transport sector Figure 7
Final energy demand for biofuels in the transport sector. LC-Core (blue) and the accelerated technology development (ATD) bioenergy scenario (green).
0 50 100 150 200 250 300 350
2000 2005 2010 2015 2020 2025 2030 2035 2040 2045 2050
Year
E
n
er
g
y
(P
J
)
LC Core
is deployed later and at lower levels (170 PJ in LC-Core vs. 103 PJ in ATD Bioenergy). However, there is an increase in the uptake of the accelerated lignocellulosic ethanol in the ATD scenario from 2035 onwards (this technology was not deployed after 2035 in the LC-Core scenario). However, the increase in lignocellulosic ethanol is smaller than the decrease in traditional wheat ethanol and there-fore there is an overall reduction in the level of ethanol in the ATD scenario.
The overall reduction in ethanol deployment and increase in conventional fuels in the ATD scenario suggests that under the least cost assumptions of the model and accel-erated bioenergy assumptions, it is more economical to use biomass to decarbonise the electricity and residential heat sectors. As a result, in the accelerated scenario, there is more decarbonisation of electricity and heat and less need for more expensive transport sector decarbonisation.
Bioenergy in the Aggregated Accelerated scenarios
LC Acctech (60%) no fuel cells
When all the technologies are accelerated together in the LC Acctech (no fuel cells) scenario at 60% carbon reduc-tion, there is less biomass for electricity after 2040 than there was in ATD Bioenergy (Figure 8). This is likely due to the abundance of other cheap alternatives for electricity
production. However, there are dramatically higher levels of biomass being used for residential heat in LC Acctech (no fuel cells) (60%) than in ATD bioenergy (Figure 9). Whereas in 2050 there are 381 PJ of residential biomass in ATD Bioenergy there are 564 PJ in LC Acctech (no fuel cells) (60%). None of the other technologies accelerated in this scenario offers a competing low carbon option for heat and therefore more biomass is used for heat than electricity. Biomass for transport changes less noticeably between ATD Bioenergy and Acctech (no fuel cells) (60%) than it does for the electricity and heat sectors (Figure 10). However, there is a small increase in use of biomass for transport biofuels in LC Acctech (no fuel cells) (60%) as compared with Bioenergy ATD.
LC Acctech (80%) no fuel cells
When accelerating all the technologies together at an 80% carbon reduction, there are again major changes to the distribution of biomass. While there are still high levels of biomass being utilised in LC Acctech (no fuel cells) (80%), the biomass is being distributed to the sectors dif-ferently.
In LC Acctech (no fuel cells) (80%) there is much less bio-mass deployed for electricity production (a peak of 150 PJ as opposed to 290 PJ in LC Acctech (no fuel cells) (60%)
Biomass for electricity production in the aggregate scenarios Figure 8
Biomass for electricity production in the aggregate scenarios. LC-Core (60%) (dark blue); accelerated technology development bioenergy (ATD Bioenergy (60%)) (purple); LC Acctech without fuel cells (60%) (LC Acctech (no FC) 60%) (aqua); LC Acctech with fuel cells (60%) (LC Acctech 60%) (blue); LC-Core (80%) (red); LC Acctech without fuel cells (80%) (LC Acctech (no FC) 80%) (yellow); LC Acctech with fuel cells (LC Acctech 80%) (green). Percentage value corresponds to carbon reduction targets.
0 50 100 150 200 250 300 350 400
2010 2020 2030 2040 2050
Year
En
e
rg
y
(
PJ
)
LC Core 60%
ATD Bioenergy 60%
LC Acctech (no FC) 60%
LC Acctech 60%
LC Core 80%
LC Acctech (no FC) 80%
(Figure 8). There is also a significant reduction in biomass deployed to residential heating (Figure 9). In 2050 in the 60% scenario, there are 564 PJ of biomass used in the res-idential sector, while in 2050 in the 80% scenario there are only 8 PJ used in this sector. While there are reductions in biomass for electricity and residential heat, there is a large increase in biomass for transport biofuels in the 80% scenario (Figure 10). There are 281 PJ of transport biofuels in the 60% scenario and 665 PJ in the 80% scenario. With a higher carbon reduction target, there is an increased uti-lisation of biomass for transport biofuels instead of heat and electricity in LC Acctech (no fuel cells) (80%).
LC Acctech (60%) with fuel cells
When all the technologies (including fuel cells) are accel-erated for a 60% carbon reduction target then bioenergy is used more for electricity generation than in any other sce-nario (including the single technology acceleration-ATD Bioenergy) (Figure 8). However, biomass is not heavily used for heat or transport (Figures 9 and 10). In fact, from 2025 onwards there is no biomass used for residential heating and there is less biomass in the transport sector than there was even in the LC-Core scenario.
LC Acctech (80%) with fuel cells
When all the technologies (including fuel cells) are accel-erated with an 80% carbon reduction target then biomass
is used less for electricity generation than in the other accelerated scenarios (Figure 8). However, biomass is uti-lised more for heat than in any other 80% scenario in the later period (2035 onwards) (Figure 9). Transport biofu-els are utilised more than they are in the ATD Bioenergy scenario (at 60%) but significantly less than in the other 80% scenario (Figure 10). This is likely due to the new availability of hydrogen transport options to decarbonise the transport sector.
Discussion
This study highlights the potential for innovation throughout the bioenergy supply chain to contribute to the decarbonisation of multiple sectors of the UK energy system. Based on the research narratives developed and techno-economic modelling scenarios, the results suggest that bioenergy has the potential to be an affordable option to decarbonise not only the electricity and residen-tial heat sectors, but also the transport sector under an 80% carbon reduction target given further technological development.
When bioenergy technologies are accelerated in isolation in the ATD Bioenergy scenario, electricity production from biomass is highly deployed in the medium term fol-lowed by increased residential heat from pellets (energy crops) in the long term. Until 2035, a similar pattern was
Residential heat from biomass in the aggregate scenarios Figure 9
Residential heat from biomass in the aggregate scenarios. LC-Core (60%) (dark blue); accelerated technology devel-opment bioenergy (ATD Bioenergy (60%)) (purple); LC Acctech without fuel cells (60%) (LC Acctech (no FC) 60%) (aqua); LC Acctech with fuel cells (60%) (LC Acctech 60%) (blue); LC-Core (80%) (red); LC Acctech without fuel cells (80%) (LC Acctech (no FC) 80%) (yellow); LC Acctech with fuel cells (LC Acctech 80%)(green). Percentage value corresponds to carbon reduc-tion targets.
0 100 200 300 400 500 600 700 800
2010 2020 2030 2040 2050
Year
En
e
rg
y
(
P
J
)
LC Core 60%
ATD Bioenergy 60%
LC Acctech (no FC) 60%
LC Acctech 60%
LC Core 80%
LC Acctech (no FC) 80%
seen for electricity generation from biomass in the aggre-gated scenario (LC Acctech (60%) with fuel cells) with a 60% carbon reduction. However, in the 60% aggregated scenario without fuel cells, there was less electricity pro-duction from 2040 to 2050 and much more biomass for residential heating than in the ATD Bioenergy scenario. This suggests that in the aggregated scenarios, electricity produced from bioenergy crops becomes less economi-cally competitive than other accelerated low carbon elec-tricity options such as marine, wind power and solar PV. The flexibility of bioenergy means it can be used in multi-ple end use sectors, while the other renewables cannot. Biomass therefore becomes better used as a low cost option to decarbonise residential heating in the aggre-gated scenarios when competing with other renewables.
Under the increased carbon reduction targets in the aggre-gated 80% scenario without fuel cells (LC Acctech (80%) no fuel cells scenario), the distribution of biomass changes. There is significantly less electricity and residen-tial heat generated from biomass but more biomass in the transport sector (biofuels) in the 80% scenarios. The higher carbon reduction target of 80% results in more pressure on the transport sector to decarbonise compared with the 60% scenarios. Without fuel cell acceleration, there are few affordable options to decarbonise transport
and biofuels is the cheapest option. Therefore the model shifts much of the biomass away from electricity and heat and towards transport biofuels. This suggests that with a limited resource like biomass there should be a thorough investigation into the optimal utilisation of the resource to decarbonise the economy.
When fuel cells, an alternative option for decarbonising the transport sector, are introduced in LC Acctech with fuel cells at a 60% or 80% carbon reduction, the fuel cells are deployed for decarbonisation of the transport sector. In the 60% scenario this leads to biomass being used pri-marily for electricity generation and heat while in the 80% scenario biomass is used earlier for residential heating. This reinforces the message that the optimal distribution of biomass depends on the ambition of the carbon target and the availability of alternative low carbon technolo-gies. A whole system mentality must be used when deter-mining how to best use biomass resources.
Given the importance of low cost biomass resources in the increased uptake of bioenergy in the ATD Bioenergy sce-nario, cheaper feedstocks are clearly important for the future deployment of bioenergy technologies. This sug-gests that much of the scope for accelerated deployment of bioenergy comes from the development of more efficient,
Biomass for transport (biofuels) in the aggregate scenarios Figure 10
Biomass for transport (biofuels) in the aggregate scenarios. LC-Core (60%) (dark blue); accelerated technology devel-opment bioenergy (ATD Bioenergy (60%)) (purple); LC Acctech without fuel cells (60%) (LC Acctech (no FC) 60%) (aqua); LC Acctech with fuel cells (60%) (LC Acctech 60%) (blue); LC-Core (80%) (red); LC Acctech without fuel cells (80%) (LC Acctech (no FC) 80%) (yellow); LC Acctech with fuel cells (LC Acctech 80%) (green). Percentage value corresponds to carbon reduc-tion targets.
0 100 200 300 400 500 600 700 800
2010 2020 2030 2040 2050
Year
En
e
rg
y
(
PJ
)
LC Core 60%
ATD Bioenergy 60%
LC Acctech (no FC) 60%
LC Acctech 60%
LC Core 80%
LC Acctech (no FC) 80%
low cost energy crops. This can be achieved through increasing the yield, crop resistance to disease and pest species and by increasing successful establishment of per-ennial species. Feedstock flexibility is also important for many of the bioenergy technologies, and therefore improvements in this area will increase the economic competitiveness of bioenergy.
The results from all the scenarios suggest that using bio-mass for residential heat is a potential option to decarbon-ise the UK's energy market when bioenergy is competing with other accelerated technologies under 60% carbon reduction targets. However, in 80% carbon reduction sce-narios, transport biofuels are deployed at much higher rates. This suggests that to achieve a higher level of decar-bonisation, transport will need to be highly decarbonised and that lignocellulosic ethanol could be one way to achieve this. Given the uncertainties surrounding the ATD figures and our 'what-if' rather than a predictive approach, however, it remains to be seen whether bioenergy tech-nologies will develop and be deployed in this way.
Fast pyrolysis for bio-oil production was not deployed in any of the scenarios. This certainly does not mean that fast pyrolysis technology is without potential. To fully under-stand why fast pyrolysis was not deployed, a sensitivity analysis would need to be undertaken on the costs of pyrolysis technology within the model; however, due to time constraints this was not possible. It is additionally important to highlight that the model may not capture some key advantages in using fast pyrolysis in an energy system which are beyond cost competitiveness. MARKAL is used for 'what-if' analysis and focuses on 'least-cost' solutions for the energy system over the time horizon cho-sen. Consequently, MARKAL will select the technologies which supply energy at the lowest cost, even if this only represents a marginal cost saving. One of the conse-quences of this modelling paradigm is that some technol-ogies/pathways may not be selected by the model as part of the 'optimal' energy system configuration even if in reality they could be developed. In addition the MARKAL modelling framework can only capture some of the 'non-economic' benefits of certain energy technologies/path-ways, which influences its choice of 'solutions'. Although the UKERC 2050 MARKAL model has, additionally, been thoroughly tested (and has been constructed from earlier also tested versions of the UK-MARKAL model), it has not been built specifically to explore bioenergy pathways. Within the time constraints of the project, it was not pos-sible to improve the bioenergy chains represented within the model. Within the TSEC-BIOSYS modelling exercise, however, bioenergy chains were specifically improved. 'Domestic' fast pyrolysis also was not deployed in the sys-tem; however, imported bio-oil was deployed most nota-bly in the industrial sector within the TSEC-BIOSYS
model (unpublished data). The 'imported' bio-oil path-way is currently not modelled within the MARKAL model used for UKERC 2050 and this highlights an area where the model needs to be improved.
Land availability within the UK for growing bioenergy crops is, additionally, a big issue within the bioenergy field. In MARKAL, the upper bounds of available energy crops were capped to reflect the limited availability of land for biomass in the UK. However, there are also other issues associated with bioenergy that could further limit biomass levels in the UK. Bioenergy is often considered controversial due to issues surrounding direct and indirect land use change [13,35], real carbon reduction potential, social acceptability and other environmental impacts. There are many concerns about the sustainability of using first generation food crops for energy production due to possible impacts on food prices and increased and/or accelerated land-use change. As a result, there is a great deal of research and support for second generation dedi-cated energy crops, which do not compete with food crops, do not negatively affect the quality of the land and do not negatively shift the pattern of land use (for exam-ple that do not require clearing certain types of land to grow energy crops). The Gallagher Review recommended that bioenergy crops should be grown on marginal or idle land, and research in this area will become important for the future of bioenergy deployment [13]. These socio-environmental limits are not represented in the model and thus would impose additional deployment con-straints not shown in the modelling results. This high-lights some limitations of cost optimisation models. The modelling overlooks many barriers to development and deployment of technology other than costs, including some key aspects relating to both the spatial and the tem-poral infrastructure of bioenergy. It is also very important that the modelling work is underpinned by clear qualita-tive stories, including policy implications.
Limitations
Social and environmental limitations on bioenergy devel-opment and deployment, such as the wide-scale environ-mental costs and benefits of bioenergy deployment on ecosystem services, and direct and indirect land use dis-placement, may make deployment of bioenergy technol-ogies challenging. Overall, however, the work suggests that bioenergy can contribute significantly to a low car-bon UK energy future. However, it is important to keep in mind that (1) the modelling overlooks many barriers to development and deployment other than costs; (2) the modelling does not properly model some key aspects linked to bioenergy infrastructure, both spatial and tem-poral, and (3) the figures used in the ATD scenarios are uncertain and should be taken with caution. This work offers insights into the potential accelerated technology development and deployment that could occur along selected bioenergy chains in the UK. It should be taken as an illustration, rather than a prediction, of how bioenergy could be deployed in the future UK energy system. The analysis undertaken contributes mostly from the illustra-tion of 'what could be done' with MARKAL to look into the potential of ATD and bioenergy.
Our findings are limited by the uncertainty on the values chosen to represent future ATD. For example, the results for the deployment of lignocellulosic ethanol are based on very high conversion efficiencies, and should be taken with caution, and not as a prediction of the capability of lignocellulosic technology deployment. Rather, the results from this should be looked at as an illustration of the capability of the model, and as highlighting where further work is needed. The UK-MARKAL database is iteratively constructed and improved, and this has been corrected for further runs. However, as a consequence of time con-straints, it was not possible to include this revised value for the ATD runs for the present work.
In addition, the focus was mostly on one scenario. A sin-gle ATD Bioenergy scenario was modelled in MARKAL which combined the accelerated development input data of the five bioenergy chains that were selected for explora-tion. Although the use of different scenarios would help to account for some of the uncertainties in the figures used in the scenarios, this was not possible given the time con-straints of the project. In future, these uncertainties would need to be taken into account, for instance, by using dif-ferent scenarios, including the use of more bioenergy chains, and by undertaking sensitivity analyses to deter-mine which parameters are most influential on the deployment of the bioenergy technologies explored.
Moreover, the scenarios focused on five select technolo-gies/bioenergy chains. There are other promising bioen-ergy technologies which have the potential to be economically viable and sustainable, especially those
where active research is being conducted both in the UK and internationally. Some technologies, like algal fuels, have potential but are currently not represented within MARKAL.
It is also important to highlight that the failure of a tech-nology to be deployed in these scenarios does not mean that technology is without potential. As MARKAL is a least-cost optimisation model, it will select the cheapest technology to serve the demand while satisfying the con-straints, even if those cost savings are only marginal.
Although the UKERC 2050 MARKAL model has, addition-ally, been thoroughly tested (and has been constructed from earlier also tested versions of the UK-MARKAL model), it has not been built specifically to explore bioen-ergy pathways. Consequently, this means our approach is challenging, but innovative nonetheless. Here the authors have illustrated the possibilities of the model, but within the time constraints of the project, it was not possible to improve the bioenergy chains represented within the model. The 'imported' bio-oil pathway is currently not modelled within the UKERC 2050 model and this high-lights an area where the model needs to be improved.
The costs used in the modelling were additionally cali-brated on a 2000 base year and we are conscious of the limitations of this approach and the possibility of improvement to represent more carefully the 'short term'. The value of the modelling exercise, however, may be more in exploring the longer term trends.
Further work is needed to build on our proposed approach and it could be useful to systematically look at the pathways to answer the question 'how much improve-ment is necessary in the different biotechnologies before they can be expected to have a significant role in the future energy system?'
This paper has highlighted the applicability of an original modelling approach, but future work should be focused to address some of the above limitations. It is also impor-tant to note that the modelling has been underpinned by clear qualitative stories, including R&D directions and potential and policy implications, which give the model-ling results context. The UK-MARKAL model is an 'itera-tively built' database and model and by highlighting its possibilities as well as current gaps in data representation and/or capabilities, we continue to contribute to the future improvements of the model.
Conclusion
scenarios in MARKAL to explore accelerated technology development of bioenergy technologies.
The exercise has highlighted that there is much potential for accelerated technology development in the five bioen-ergy technologies investigated in this paper, particularly in bio-engineering of energy crops as it underpins many bioenergy chains. Given further development, bioenergy technologies could become increasingly more economi-cally competitive with fossil-based technologies as feed-stock costs are reduced in line with crop improvements due to plant breeding efforts, the ability to grow energy crops on marginal lands, increased crop resistance to dis-ease and pests, cheaper enzymes for lignocellulosic con-version to bio-ethanol, and improvements in gasification and fast pyrolysis technologies. There is additional poten-tial for advances in other bioenergy technologies not assessed in this paper, which could help to drive the com-mercial availability and competitiveness of bioenergy technologies in the R&D stage further forward.
This paper highlights the unique flexibility of bioenergy technologies to potentially decarbonise multiple sectors. Under all the scenarios there was a high deployment of bioenergy, which implies that it is possible that bioenergy will be a valuable part of the pathway to a decarbonised economy. It is important to highlight, however, that fig-ures used in the ATD scenario were uncertain and should be taken as an illustration of how much improvement is needed in the five technologies for the levels of market penetration seen in the model output. Interestingly, car-bon reduction targets influenced the bioenergy mix deployed in the UK energy market. Lower targets (60%) resulted in more electricity and residential heat, while higher targets (80%) resulted in increased deployment of biomass for biofuels. Acceleration of bioenergy without other technologies accelerated, however, led to more elec-tricity from biomass because other low carbon elecelec-tricity options were less cost competitive.
Innovation at all stages of the bioenergy supply chain is important and can contribute to increased chance of deployment. Future R&D efforts and innovation are there-fore essential at all points along the supply chain.
Ultimately, the future deployment of bioenergy technolo-gies is dependent on many different factors including investment and R&D efforts, carbon reduction targets and the ability to compete with other low carbon technologies as they become deployed.
Abbreviations
ATD: accelerated technological development; BERR: Department for Business, Enterprise and Regulatory Reform; CCC: Committee on Climate Change; DTI:
Department of Trade and Industry; GBP: pounds sterling; NREL: National Renewable Energy Laboratory; O&M: operating and maintenance; R&D: research and develop-ment; RD&D: research, development and demonstration; UKERC: UK Energy Research Centre.
Competing interests
The authors declare that they have no competing interests.
Authors' contributions
DC collected quantitative and qualitative data for most of the chains, interpreted the results and drafted the manu-script. SJ collected quantitative and qualitative data for the lignocellulosic chain, and helped to draft the manuscript. BM helped with data collection, interpreted the results and also drafted the manuscript. GA undertook the mod-eling work and commented on the manuscript. GT helped draft the manuscript. All authors read and approved the final manuscript.
Acknowledgements
The authors would like to acknowledge and thank the experts consulted as part of the work: Raphael Slade and Calliope Panoutsou at Imperial College, and John Brammer and John Rogers at Aston University. Their shared knowledge and help was very much appreciated. The authors would also very much like to thank Mark Winskel for his guidance on the project.
This work was undertaken as part of the UKERC Energy 2050 project, and was based on reports written by the authors for UKERC.
References
1. DTI: Meeting the Energy Challenge – A White Paper on Energy May 2007. UK: Department of Trade and Industry; 2007. 2. Stern N: The Economics of Climate Change: The Stern Review Cambridge:
Cambridge University Press; 2007.
3. IEA: Energy Technology Perspective. Scenarios and Strate-gies to 2050. Paris: IEA; 2008.
4. Taylor G: Bioenergy for heat and electricity in the UK: A research atlas and roadmap. Energy Policy 2008, 36:4383-4389. 5. UKERC Energy 2050 [http://www.ukerc.ac.uk/ResearchPro
grammes/UKERC2050/UKERC2050homepage.aspx]
6. Jablonski S, Brand C, Pantaleo AM, Bauen A, Strachan N: Review of bioenergy in the UK MARKAL Energy System Model – Working Paper. London: TESC-BIOSYS Project; 2008.
7. Strachan N, Kannan R, Pye S: Scenarios and Sensitivities on Long-term UK Carbon Reductions using the UK MARKAL and MARKAL-Macro Energy System Models. London: UKERC Research Report 2; 2008.
8. DEFRA: UK Biomass Strategy. London: Department for Environ-ment, Food and Rural Affairs; 2007.
9. Wiesenthal T, Mourelatou A, Petersen J, Taylor P: How Much Bioenergy Can Europe Produce without Harming the Envi-ronment? Denmark: European Environment Agency; 2006. 10. US Department of Energy: Breaking the Biological Barriers to
Cellulosic Ethanol: A Joint Research Agenda. A Research Roadmap Resulting from the Biomass to Biofuels Work-shop. Rockville, Maryland: US Department of Energy; 2006. 11. The Royal Society: Sustainable Biofuels: Prospects and
Chal-lenges. London: The Royal Society; 2008.
12. Faaij APC: Bio-energy in Europe: changing technology choices. Energy Policy 2006, 34:322-342.