Issues
ISSN: 2146-4138
available at http: www.econjournals.com
International Journal of Economics and Financial Issues, 2019, 9(1), 160-168.
Financial Cointegration and the Vector Error Correction
Model: The Case of MENA Countries
Kalai Lamia*, Kasraoui Naziha
Université Tunis El Manar, Tunisia. *Email: [email protected]
Received: 22 September 2018 Accepted: 29 December 2018 DOI: https://doi.org/10.32479/ijefi.7146
ABSTRACT
The aim of this paper is to study financial integration between emerging MENA countries and developed countries. We study short-term price series dynamics using Johansen’s (1991) multivariate cointegration test to determine the number of cointegration vectors and Granger’s (1987) causality test to determine causality direction across markets. The vector error correction model (VECM) model combines long-term cointegration modeling with short-term dynamics to determine equilibrium return rate. The results point to the presence of two long-term cointegration vectors between MENA and developed countries, while causality direction is bidirectional. The VECM results suggest the presence of a short-term cointegration between these countries. VECM’s residuals and the Wald test confirm the robustness of our model.
Keywords: Financial Market, Financial Cointegration, Causality, Vector Error Correction Model, MENA Countries
JEL Classifications: G15, G11, G17, G1
1. INTRODUCTION
International financial integration came to be seen as a major
concern for contemporary economic globalization movement. Understanding the notion is particularly useful for portfolio investors whose investment strategies fundamentally are balanced on integration degrees.
Over the past three decades, international portfolio diversification
has been the core of global capital markets. Several advantages have encouraged investors to invest in international portfolios. Modern portfolio theory has admitted that diversification may reduce portfolio risk by not holding perfectly correlated assets. International assets are likely to offer investors greater
diversification benefits since their prices are often less correlated
and are determined by different economic fundamentals.
Grubel (1968) and De Santis and Imrohoroglu (1997), show that a higher percentage of capital invested in foreign equities benefits
investors by increasing their expected returns, decreasing volatility in their returns, and decreasing correlation of foreign equities with domestic securities.
Bartarm and Dufey (2001) found that international investment attractions bear on diversification effects, participation in the
growth of other foreign markets, and abnormal returns due to market segmentation.
The fact that cross-border market returns do not change exactly
the same way over time translates into diversification gains. In this regard, whether country-specific factors or industry-specific factors lead to low correlation is still under review (Ang and Bekaert (2002), Gentzoglanis (2003) and Broner and Jaume (2016)).
Portfolio diversification is an investment strategy that helps reduce market unpredictability. It does not guarantee a profit or insure against
losses when markets are down, but does provide protection for some
accumulated gains. According to modern portfolio theory these gains are inversely proportional to the degree of financial integration.
Market correlation coefficients refer not only to a correlation
within developed stock markets, but also between some mature emerging markets that tend to increase slowly over time.
Nevertheless, there are several barriers to international investment.
Solnik and Longin (2001) assume that lack of knowledge of foreign markets, political risk, market inefficiency, regulations,
transaction costs, taxes, and exchange rate risks are serious problems that can hinder international investment, particularly in less developed countries.
Despite evidence of additional gains from international
diversification, individual and institutional investors prefer to
hold domestic securities. This home bias refers to the gap between the shares of assets invested in foreign markets and the optimal
shares determined by financial theory. The potential benefits of international diversification can be undermined by the direct and
indirect forms of investment barriers against foreign investors (French and Poterba, 1991).
International capital flows are also very high in volume and
have increased considerably in recent years. The increasing internationalization of economic activity has led to a decrease in “domestic” factors.
The concern with developing emerging countries’ financial markets
triggered the liberalization process. This latter process called for major regulatory changes in order to facilitate foreign investors’
access to domestic markets. Increase in capital flows helps to increase liquidity, reduce debt cost and improve profitability of some projects.
In this paper, we study empirically international financial
integration of MENA countries in developed countries in order to detect the meaning of international portfolio diversification. The first section of this paper reviews the relevant literature on the main financial integration studies. The second section analyzes financial
cointegration between the different countries of our sample using for the purpose the different cointegration and causality tests and the error correction vector model (VECM).
2. LITERATURE REVIEW
The last decade has seen a dramatic set back in stock markets
in developed economies. During the 2008 US financial crisis,
stock markets in Europe and the US fell. The accumulation of
international debts and financial crises inflicted unprecedented
damage. Record losses were recorded in emerging economies.
The recent military and political turmoil in the MENA region since 2010 has further aggravated the conditions already worsened by the US financial crisis. Financial liberalization policies have
included plans to revive the different stock markets. The removal of obstacles to capital movement and implementation of policies
conducive to strengthening the functioning of domestic financial
markets aimed at improving direct investment and foreign
investment in the region by encouraging international participation in listed companies.
Bekaert (1995), and Bekaert and Harvey (1997), examining integration of a set of MENA countries into developed countries, found that MENA stock market returns were high, predictable, and
lacked correlation with the major markets. This means that in the
event of a financial crisis these emerging stock markets may evade losses as large as those in mature markets during the last financial crisis. Diversification benefits tend to increase in the absence of financial integration with the global economic and financial system.
Using Markowitz’s mean-variance analysis, Abraham, Seyyed and Alsakran (2002),studied the investment interests of MENA countries (Bahrain, Kuwait and Saudi Arabia). Their results indicate that an optimal allocation of 20–30% considerably reduces portfolio risk and improves expected profitability. The authors point to a low correlation between MENA countries’ returns and US market returns and a positive correlation between MENA
countries’ stock returns and oil prices.
Hatemi and El-Khatib (2016) studied causality between MENA financial markets (Bahrain, Kuwait, Oman, Qatar, Saudi Arabia, United Arab Emirates). The author noted that an increasing integration between these financial markets led to a decline in
risk coverage and increased vulnerability to shocks following
assets diversification.
Neaime and Colton (2005) studied regional and international financial integration in MENA and developed countries (America,
United Kingdom, France), using Johansen’s cointegration model. The authors found that Jordan’s, Morocco’s, Egypt’s
and Turkey’s financial markets are cointegrated with developed financial markets. MENA markets present low regional financial integration, except for Behrain, Kuwait and Saudi Arabia. These latter markets are segmented in the international financial market and offer profitable diversification potential.
Bekaert and Harvey (1995), Carrieri, Errunza and Hogan (2007) and Park and Rogelio ( 2014) found that diversification benefits of
emerging countries tended to decline in recent years due to their
increasing integration into the global economic and financial system
encouraged by market opening policy. The substantial increase in inter-market relationships raises an intriguing question as to whether emerging markets’ assets remain attractive for a foreign investor.
Like mature emerging markets, MENA financial markets are
likely to become more sensitive to stock market volatility. Their increasing integration into global markets may reduce their ability to strengthen and diversify international portfolios, making stock
markets more vulnerable to external financial shocks. According to Chari and Henry (2004), long-term stock market integration increases diversification opportunities for domestic and international
investors and increases market vulnerability to price shocks.
Neaime (2006), using Engle-Granger’s co-integration approach, shows that the financial markets of Dubai, Egypt, Jordan and Kuwait are highly correlated with the US financial market, the financial markets of Tunisia and Morocco are highly correlated with the French financial market, while the market of Saudi Arabia is weakly correlated with developed financial markets.
The potential benefits of diversification in emerging markets can be
compromised by irect and indirect forms of barriers against foreign investors. Direct barriers are institutional barriers that affect the ability of global investors to invest in the assets of a particular country. They include legal restrictions on cross-border securities trading, foreign exchange regulation, repatriation limits, taxes and transaction costs.
Financial liberalization generally refers to the removal of direct barriers to capital investment. In recent decades, institutional
barriers have been significantly lowered, especially in the major
developed countries. Market liberalization allows global investors to access the market. It leads to increased international investment and increased economic well-being.
Indirect barriers can also deter foreign investors from investing in stock markets. Indirect barriers include risk perception, information asymmetries between foreign and domestic investors that mainly relate to differences in accounting standards, industrial structures, regulations and company structures. Indirect barriers
and global economic variables include specific risks such as
economic instability, currency risk and liquidity risk.
According to Bekaert (1995) the presence of barriers does not
necessarily mean market segmentation and their removal does not necessarily increase market integration. Behavioral factors
determine market segmentation. In the international financial
literature, the “home bias puzzle” is explained by behavioral variables. Investors do not always manage to use the gains of
international diversification and prefer to focus their investment
behavior on their domestic securities.
French and Poterba (1991) suggest that investors may simply be relatively more optimistic about their domestic markets. Solnik and
Roulet (2000) explains the “home bias puzzle” using regret theory.
Investors feel a painful regret if foreign assets underperform domestic assets.
Lewis (1999) shows that investors believe that domestic stocks provide better coverage of country-specific risks such as domestic inflation and wealth coverage that is not traded in capital markets.
Global economic conditions could affect stock market integration
degree. Low returns in domestic countries during recessions lead
investors to venture abroad in search of higher returns that could lead to greater integration, while high domestic returns tend to keep them at home afterwards. Similarly, low interest rates and low economic growth in a domestic market could lead to higher market integration as the capital mobility across borders increases. Finally, exchange rate volatility could lead to high market segmentation.
Determining the extent to which a domestic capital market is segmented into international capital markets is therefore a research question of great interest to investors and researchers.
If financial markets are fully integrated, the expected return
of a country portfolio should be determined uniquely by the country’s exposure to global covariance risk. On the other hand, segmentation implies that the Risk-Return relationship in each domestic market is determined essentially by domestic or local factors. Thus, when markets are partially segmented, expected returns would be determined by the country’s exposure to both
specific and global risk factors.
A growing body of literature documents the time-varying nature
of both expected returns and risk exposure in a domestic market. To account for this data feature, we estimate an international version of the asset-pricing model in which risk price and risk exposure change over time. To this end, we use information on global variables to condition global risk price and information on local variables to condition domestic risk price. Since some local variables correlate with integration and openness of domestic stock
markets, our specification implicitly allows degree of integration
to change over time.
The increasing internationalization of economic activities has led to a decrease in “domestic” factors. This latter had an effect only on the domestic level. This has in parallel induced the effect of greater integration between markets, although markets are known to be more independent in strictly updating “domestic” information
because the quantity of information that can be classified as such
is less and less available. This assumption is supported when we compare these results with those of Eun and Shim (1989) and Espitia and Santamaria (1994).
Generally, what is suggested is that international diversification
does not have excessive economic rationality because of the strong correlation and integration between markets, except that
diversification is implemented by choosing the stocks whose
differential features allow them to behave in the domestic stock market on which they are listed. In other words, it makes more sense to take advantage of information, basically what is expected by a leading market to decide on equity before that information is incorporated into the stock price.
International portfolio diversification is the source of welfare benefits for international economic relationships.
Modern portfolio diversification theory affects the level of financial
market integration through gains from trade liberalization, massive
foreign capital inflows, and barriers restriction. These results have two important implications for companies and investors; first, capital cost can be significantly different across slightly segmented
markets. Second, if domestic equity markets are segmented then international portfolios should provide higher risk-adjusted performance since a portion of domestic systematic risk can be
diversified otherwise by investing internationally and without
paying for low-return prices.
According to Stulz (1999), international stock market integration improves diversification opportunities for domestic and foreign
Harvey (1995) and Gentzoglanis (2003) assume that financial
market integration should reduce capital cost, increase investment and stimulate economic growth. However, the more integrated markets with global financial markets, the greater their
vulnerability to international financial crises. In times of global financial crisis, contagion leads to a change in market expectations and an observable structural break between the different financial
markets.
3. METHODOLOGY
We study the interdependent relationships between developed and MENA countries and their implications for the benefits of international diversification. We use Johansen’s cointegration
approach (1988), the Granger causality test and the error correction vector model.
The data for the various indices are daily and cover seven main
stock markets in the MENA zone (Tunisia, Egypt, Morocco, United Arab Emirates, Kuwait, Lebanon, Turkey) and five major stock
markets in developed countries (United States, Germany, France,
United Kingdom, Japan) over the 2010–2016 period, totaling 1964
market observations (Tables 1 and 2).
3.1. Stationarity Study
Before proceeding with the cointegration study, stationarity of
the time series of the price indices should be checked first. The Augmented Dickey Fuller test and the Phillips-Perron (PP) test
are used to estimate the null unit root hypothesis in order to see whether time series are order 1 integrated. These tests allow for error autocorrelation and heteroscedasticity.
The results of the Augmented Dickey Fuller tests for all series
of the developed countries show that the t-statistics are well below the critical threshold. The results of the PP test are similar and indicate that the stock market index series of developed markets
and MENA countries are non-stationary.
The study of the stationarity of the first differences of time series
for the different stock market indices shows probability values
>5%, rejecting thus the null hypothesis of non-stationarity (unit root) at the 1% level. It shows also that the series are order 1
stationary or order 1 integrated.
These results indicate that the series may follow a long-term equilibrium path, although in the short term they diverge substantially from equilibrium. The study of long-term relationships between time series is fundamental to study cointegration between the different markets.
Table 1: Benchmark equity indices
Equity market Benchmark index
MENA countries
Tunisia TUNINDEX index
Egypt EGEX 30 index
Morocco MASI index
United Arab Emirates DFMGI index
Kuwait KWSE index
Turkey BIST100 index
Lebanon BLOM index
Developed countries
United States SP 500 index
Germany DAX 30 index
France CAC 40 index
United Kingdom FTSE 100 index
Japan NIKKEI average index
Table 3: The number of lags (p)
Critère VAR (0) VAR (1) VAR (2) VAR (3) VAR (4)
Akaike 187.3188 138.9418 138.7313* 138.8187 138.9122
Schwarz 187.3616 139.8015 139.4983* 140.4026 141.0098
HQ 187.3347 139.1492 139.1302* 139.4090 139.6940m
Table 2: Unit root test
Countries Level series First difference
ADF PP ADF PP
Statistic P value Statistic P value Statistic P value Statistic P value MENA countries
Tunisia 1.9086 0.3285 1.9282 0.3194 28.8949 0.000 28.9497 0.000
Egypt 1.4051 0.5811 1.2466 0.6560 31.0416 0.000 31.1095 0.000
Morocco 1.5816 0.4918 1.5831 0.4910 38.628 0.000 38.6281 0.000
UAE 0.8903 0.7971 0.8790 0.7952 35.8233 0.000 35.8392 0.000
Kuwait 1.5578 0.8294 0.9964 0.7565 32.2323 0.000 35.3526 0.000
Saudi Arabia 2.1848 0.2121 2.2017 0.2058 39.9365 0.000 39.9156 0.000
Turkey 1.6441 0.7751 1.4794 0.8374 34.2206 0.000 34.2609 0.000
Lebanon 2.3139 0.1677 2.3290 0.1629 37.1341 0.000 37.1082 0.000
Developed countries
US 0.6968 0.8456 0.5276 0.8833 39.4243 0.000 40.1916 0.000
Germany 2.7867 0.2024 2.8259 0.1916 39.6748 0.000 39.7648 0.000
France 2.7781 0.2056 2.6856 0.2427 38.595 0.000 38.7031 0.000
UK 2.8632 0.2141 2.8632 0.2550 37.742 0.000 37.8615 0.000
Japan 2.8670 0.1737 2.6511 0.2575 31.0618 0.000 30.6689 0.000
3.2. Cointegration Tests
A Cointegration study determines whether the series are integrated
or not and whether they have the same long-term cointegration rank. In fact, the cointegration relationship is interpreted as a long-term equilibrium relationship between the series.
To estimate cointegration between the indices over the long term, we proceed with Johansen (1991) multivariate cointegration test
and the Granger (1987) causality test. On the short term, we
proceed with the VECM model.
The VECM model combines the modelling of a long-term
cointegration relationship with the specification of a short-term dynamic and defines the equilibrium adjustment and return rate.
3.2.1. Johansen test (1991)
The Johansen test is a multivariate generalization of the Augmented
Dickey Fuller test. This generalization allows us to examine linear combinations of unit root variables and to determine (multiple)
cointegration relationships between developed and MENA stock
indices in our case.
We use the methodology of Johansen (1991) as all the variables of
our sample are order 1 integrated. Such an approach allows us to detect the number of long-term equilibrium relationships between stock market indices using the following two tests; the trace test for the hypothesis of the presence of more n cointegration vectors and the maximum eigenvalue test for the hypothesis of the presence of the exactly n cointegration vectors.
The optimal number of VAR lags (p) by the VAR vector
autoregressive model is presented in Table 3. The results of the
Table 4: Johansen multivariate cointegration test
A. All countries
H0 H1 Eigen value Trace test Critical value
r=0 r˃0 0.05806 399.805* 334.983
r≤1 r˃1 0.05606 310.670* 285.142
r≤2 r˃2 0.04211 244.698* 239.235
r≤3 r˃3 0.02520 200.591* 197.370
r≤4 r˃4 0.02120 172.550* 159.529
r≤5 r˃5 0.01825 149.617* 125.615
r≤6 r˃6 0.01361 93.176 95.753
r≤7 r˃7 0.00947 52.744 69.818
r≤8 r˃8 0.00973 38.558 47.856
B. Developed countries (USA, UK, Germany and Japan) H0 H1 Eigen value Trace test Critical value
r=0 r˃0 0.05806 399.805* 334.983
r≤1 r˃1 0.05606 310.670* 285.142
r≤2 r˃2 0.04211 244.698* 239.235
r≤3 r˃3 0.02520 200.591* 197.370
r≤4 r˃4 0.02120 172.550* 159.529
r≤5 r˃5 0.01825 149.617* 125.615
r≤6 r˃6 0.01361 103.176 95.753
r≤7 r˃7 0.00947 52.744 69.818
r≤8 r˃8 0.00973 38.558 47.856
C. MENA countries
H0 H1 Eigen value Trace test Critical value
r=0 r˃0 0.05806 399.805* 334.983
r≤1 r˃1 0.05606 310.670* 285.142
r≤2 r˃2 0.04211 244.698* 239.235
r≤3 r˃3 0.02520 200.591* 197.370
r≤4 r˃4 0.02120 172.550* 159.529
r≤5 r˃5 0.01825 149.617* 125.615
r≤6 r˃6 0.01361 93.176 95.753
r≤7 r˃7 0.00947 52.744 69.818
r≤8 r˃8 0.00973 38.558 47.856
Denotes rejection of the hypothesis at the 5% level, the trace test indicates 5
cointegration relationships
Table 5: Granger causality test (short-term)
BLOM BIST TUNINDEX DFMGI EGEX 30 MASI KWSE FTSE 100 CAC40 DAX 30 SP500 NIKKEI Cause
BLOM - 3.7292
0.1550 7.90120.0192 0.11020.9464 3.71620.1560 0.56490.7539 0.52770.7681 1.89560.3876 2.29160.3181 6.46860.6661 0.41940.8108 3.42940.1800 0
BIST 0.9053
0.6359 - 1.16380.5581 1.47090.4793 0.02730.9864 0.42880.8070 0.17353.5028 8.67690.1131 3.40810.1819 1.84670.3972 15.5160.1454 0.25980.8782 0 TUNINDEX 2.2966
0.3177 3.55470.1691 - 3.04240.2184 0.17870.9145 2.91500.2328 0.66960.8022 0.07560.9629 0.70950.3413 0.44120.8020 5.69710.0551 2.10180.3496 0
DFMGI 1.0141
0.6022 0.85400.6524 0.75940.6841 - 0.85840.6510 0.13600.2342 0.38991.8837 8.44760.6146 0.12900.9375 0.55840.7564 4.78160.0916 3.10330.2119 0
EGEX 30 2.8888
0.2359 8.86790.2119 4.44810.1082 1.92240.3824 - 0.35880.8357 0.67580.7835 1.32850.5147 0.18940.9096 1.36810.5046 0.24030.8688 0.02750.9863 0
MASI 0.0687
0.9662 0.14950.9279 0.98790.6102 0.03810.9811 1.42300.4909 - 0.75090.5728 0.47410.7889 0.35290.8382 1.60470.4483 0.02950.9853 0.75580.6853 0
KWSE 4.9284
0.0851 0.81780.6644 0.23130.8907 2.62132.2696 2.09470.3509 5.73460.0569 - 1.16400.5588 0.02220.9889 0.56280.7547 0.34860.8400 5.73460.0569 0
FTSE100 2.8649
0.2387 2.28700.2488 1.23500.5393 3.07520.2149 0.21550.8978 0.23770.8879 0.91040.6343 - 0.78800.6744 0.47670.7879 21.61150.0000 3.47470.1760 1
CAC40 0.2614
0.8774 5.29060.0710 6.34880.1418 0.35250.8384 0.85830.6511 3.08240.1214 0.38190.8262 6.05770.0784 - 95.5270.0000 5.09780.0782 4.79630.0909 1
DAX30 0.8125
0.0394 1.79730.4071 1.27280.5292 0.82930.6606 0.86120.6501 1.03140.5971 4.29330.1169 1.68150.4314 15.22050.0005 - 1.02000.6005 6.07250.1480 2
SP500 1.6342
0.4417 0.57910.7486 3.23420.1985 2.94760.2293 1.57290.4554 0.90870.6349 0.42980.8066 9.15500.1030 2.97060.2264 3.96520.1377 - 15.70860.0004 1
NIKKEI 0.3703
0.8310 1.09190.5793 0.10340.9496 1.33930.5119 0.49370.7813 1.50970.4701 2.21370.3306 0.99420.0117 1.00170.6060 0.80590.6683 3.11630.2105 - 0
Is caused 1 0 0 0 0 0 0 0 1 1 1 1 5
Akaike, Schwarz and HQ information criteria indicate minimum values at P = 2. The VAR model to be used is then of order 2 for both the developed and MENA countries.
Johansen cointegration test uses a VAR (2) model, presented in
Table 4.
The results of Johansen multivariate cointegration test show that the estimated value of the trace test is higher than the corresponding
critical value of Order 5 integration. This finding is significant at the 5% level, indicating that there are at most 5 cointegration
relationships between the different stock market indices.
The study of long-term cointegration between the different developed countries shows that there is a cointegration relationship
between these countries, whereas for the MENA countries the results
of the trace test indicate the absence of a cointegration relationship.
Our aim is to detect the cointegration relationships between
MENA countries and the stock markets of France, the United
States, Germany, the United Kingdom and Japan. The idea is to
see whether the so-called MENA-based emerging markets are
more or less integrated into international stock markets. The results of the bivariate cointegration tests show that there is one unique
cointegration relationship between developed and MENA markets.
These results indicate that MENA-based emerging markets may represent beneficial sources and opportunities for international portfolio diversification for the developed markets’ investors.
3.2.2. Granger causality (1969)
In order to study the short-term dynamics of cointegrated series, we make recourse to the Granger causality test. This test allows for specifying the direction of causality across the different markets.
Granger causality helps to determine non-restrictions on lagged variables by assessing interdependence between the different time series in a given system. This amounts to ensuring that information available on the past values of xt does not have a statistical impact on the present or future value of yt.
It is said that xt does not Granger cause xt if past-conditioned prediction of yt is not improved by taking xt into account; thus:
xt does not cause yt if P(yt│yt-1)=P(YT│xt-1,yt-1)
Where yt-1 is the past of yt and xt-1 the past of xt.
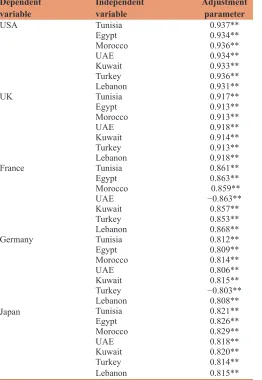
We are ready to determine Granger causality between the prices of the financial markets of developed and MENA countries. The Table 6: VECM
Dependent
variable Independent variable Adjustment parameter
USA Tunisia 0.937**
Egypt 0.934**
Morocco 0.936**
UAE 0.934**
Kuwait 0.933**
Turkey 0.936**
Lebanon 0.931**
UK Tunisia 0.917**
Egypt 0.913**
Morocco 0.913**
UAE 0.918**
Kuwait 0.914**
Turkey 0.913**
Lebanon 0.918**
France Tunisia 0.861**
Egypt 0.863**
Morocco 0.859**
UAE −0.863**
Kuwait 0.857**
Turkey 0.853**
Lebanon 0.868**
Germany Tunisia 0.812**
Egypt 0.809**
Morocco 0.814**
UAE 0.806**
Kuwait 0.815**
Turkey −0.803**
Lebanon 0.808**
Japan Tunisia 0.821**
Egypt 0.826**
Morocco 0.829**
UAE 0.818**
Kuwait 0.820**
Turkey 0.814**
Lebanon 0.815**
*, ** and *** shows statistics significant at the 1%, 5% and 10% levels, VECM: Vector
error correction model
Table 7: Error correction model (Turkey - Germany)
Cointegrating Eq: CointEq1 CointEq2
BLOM(−1) 1.000000
DAX_30(−1) 0.011473
(0.03108) [0.36916]
C −1344.593
Error correction: D (BLOM) D (DAX_30)
CointEq1 0.002836
(0.00124) [−2.28635]
0.007785 (0.00206) [−0.37691]
D (BLOM(−1)) 0.038413
(0.02587) [1.48479] (0.00156)
0.415305 (0.43086) [0.96389] (0.02595)
C −0.296478
(0.15821) [−1.87398]
3.329604 (2.63482) [1.26369]
R-squared 0.008834 0.001971
Adjusted R-squared 0.005499 −0.001387
Sum sq. residuals 55138.65 15293369
S.E. equation 6.091422 101.4477
F-statistic 2.648951 0.586908
Log likelihood −4809.917 −9006.409
Akaike AIC 6.455653 12.08098
Schwarz SC 6.476999 12.10232
Mean dependent −0.282782 3.182507
S.D. dependent 6.108240 101.3774
Determinant residual covariance (dof adj.) 381572.7
Determinant residual covariance 378509.9
Log likelihood −13815.73
Akaike information criterion 18.53852
Granger causality test bears on the notion of predictability, time-based succession and assumes the stationarity of price series on
the long term. It tests the null hypothesis that the first market’s
price series does not cause the second market’s price series against the alternative hypothesis.
The results obtained for a number of lags p equal to 1 are presented in Table 5. We notice that for 11 financial markets, 5 causality relationships have been defined at the 5% significance
level. Causality is detected for developed countries with a bidirectional relationship for the market pair (Germany, France) and unidirectional relationships for the pairs (United States, United Kingdom/United States, Japan).
The Granger causality study of developed and emerging countries shows that the market pair (Germany, Turkey) presents a unidirectional relationship. This relationship implies that the impact of shocks on one market is more intense on the other market.
The results indicate that the most integrated market is Germany, which Granger causes the Turkish market and has a two-way relationship with France. The US market in turn causes the Japanese market and is caused by the UK market.
3.3. The VECM Model
Once the cointegration relationships between developed and
MENA countries have been studied, it is possible to estimate
the long-term relationship between the different stock market indices. The Granger representation theorem is used to establish equivalence between the cointegrated system and the vector error correction model (VECM) and to compensate for the
inadequacy of the VAR representation to account for long-term
relationships.
In the VECM model, the short-term dynamics of market indices are affected by deviations from long-term equilibrium. In the presence of cointegration, it is possible to estimate the dynamic
coefficients of the model and the long-term relationship. To this
end, it is necessary that regression residuals are stationary, as
checked by ADF tests.
If yt and zt are order 1 integrated, the variables dispose of an error correction:
∆yt ∆zt yt zt t∆yt t
t N
= + + − − − − + − +
=
∑
α0 α1 α2 1 β0 β1 1 γ 1 ε
1
( )
Where β1 is an adjustment parameter that represents the cointegration vector.
ɛt is white noise, α0, α1, α2 and ɛγt are parameters.
α2 is adjustment speed in order to reach long-term stable
equilibrium. This parameter should be significantly negative to validate the VECM. Long-term equilibrium is reached when
yt−1=β0+β1 zt−1 (Table 6).
The results indicate that there are two cointegration relationships between developed and emerging countries. Equilibrium
adjustment coefficients are negative and statistically significant for both country pairs (Turkey, Germany) and (UAE, France). We notice that the prices returned to equilibrium over several periods. If we consider these adjustment coefficients, we notice
that although international price changes affect domestic stock markets, the total impact on prices does not result from a single period.
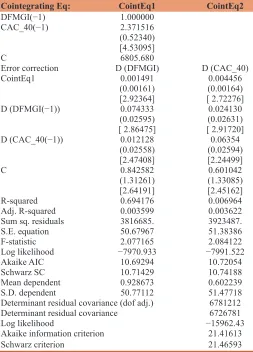
3.4. VECM of MENA and Developed Countries
The presence of cointegration relationships between MENA and
developed countries leads us to specify the equilibrium adjustment mechanisms between these markets through the VECM technique and to check the robustness of the results.
Two equations are proposed and estimate the pairs of
Turkey-Germany and UAE-France: Table 9: Wald test
Test statistic Value P
F-statistic 1.5339 0.0216
Chi-square 3.0679 0.0215
Table 10: Residual analysis
Test Value P
Breusch-godfrey serial correlation LM 0.237822 0.7874
Breusch-Pagan-Godfrey Heteroskedasticity 14.8346 0.0897
Jarque-Bera normality 3953 0.0965
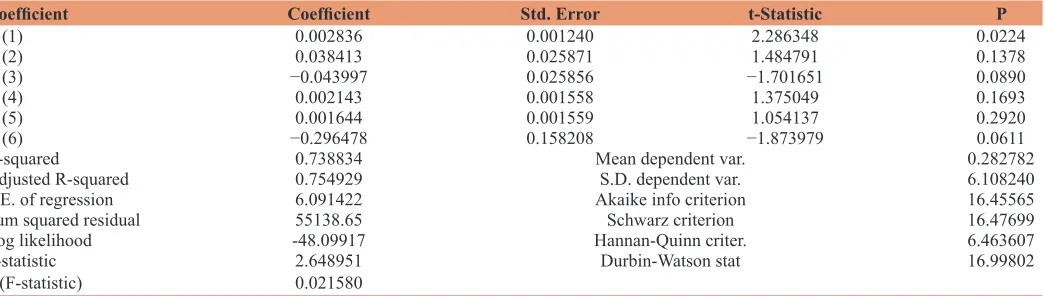
Table 8: VECM
Coefficient Coefficient Std. Error t-Statistic P
C (1) 0.002836 0.001240 2.286348 0.0224
C (2) 0.038413 0.025871 1.484791 0.1378
C (3) −0.043997 0.025856 −1.701651 0.0890
C (4) 0.002143 0.001558 1.375049 0.1693
C (5) 0.001644 0.001559 1.054137 0.2920
C (6) −0.296478 0.158208 −1.873979 0.0611
R-squared 0.738834 Mean dependent var. 0.282782
Adjusted R-squared 0.754929 S.D. dependent var. 6.108240
S.E. of regression 6.091422 Akaike info criterion 16.45565
Sum squared residual 55138.65 Schwarz criterion 16.47699
Log likelihood -48.09917 Hannan-Quinn criter. 6.463607
F-statistic 2.648951 Durbin-Watson stat 16.99802
D(BLOM) = C(1)*(BLOM(−1) + 0.0114725065582*DAX(−1) - 1344.59340389) + C(2)*D(BLOM(−1)) + C(3)*D(BLOM(−2)) + C(4)*D(DAX(−1)) + C(5)*D(DAX(−2)) + C(6)
D(DFMG) = C(1)*(DFMG(−1) - 2.37151644496*CAC40(−1) + 6805.68040547) + C(2)*D(DFMG(−1)) + C(3)*D(DFMG(−2)) + C(4)*D(CAC40(−1)) + C(5)*D(DFMG(−2)) + C(6)
The results of the VECM model show us that adjustment rates
or error correction terms are significantly negative. The results of the Wald test helped to check for the presence of a causal relationship between these country pairs. We notice that P < 5%
for the Fisher and Chie square statistics, which implies the presence of a short-term relationship between these country pairs.
The results of the study of residuals from the VECM model equations show that they do not auto correlate, are homoscedastic and are normally distributed. R2 confirms the adequacy and robustness of the model proposed to study cointegration between stock markets (Turkey, Germany).
The results for the country pair (Dubai, France) are less convincing and present a rather low R2 (Tables 7-14).
4. CONCLUSION
Markets are considered integrated when assets with identical risks
generate identical returns in all markets. Liberalization is likely to lead to integration of emerging markets into the global financial market. Foreign investors then benefit from diversification, equity
cost decreases and economic well-being increases.
We notice that despite the growing post-globalization relationships
between different countries, the liberalization process led to a small increase in emerging countries’ integration with the international market and most equity markets are segmented.
Although there are differences in financial sector development across the different MENA countries, two statistically significant
long-term co-integration relationships with developed countries were identified by applying Johansen (1991) multivariate
cointegration test and Granger (1987) causality test, and one unique short-term cointegration vector was identified by the
VECM study.
Bekaert (1995) identifies three types of barriers to financial integration between countries. The first obstacles are legal in
nature, reporting to restrictions on foreign ownership and taxes on foreign investments. The second obstacles are indirect and relate to differences in accounting standards and investor protection laws
across countries. Third barriers report to market-specific risks and
may include liquidity risk, political risk and currency risk that discourage foreign investment and promote market segmentation.
Table 13: Wald test
Test statistic Value P
F-statistic 0.237822 0.7844
Chi-square 0.475055 0.7874
Table 14: Residual analysis
Test Value P
Breusch-Godfrey serial correlation LM 0.237853 0.2817
Breusch-Pagan-Godfrey Heteroskedasticity 14.43682 0.0654
Jarque-Bera normality 3.953956 0.0815
Table 11: VECM (UAE-France)
Cointegrating Eq: CointEq1 CointEq2
DFMGI(−1) 1.000000
CAC_40(−1) 2.371516
(0.52340) [4.53095]
C 6805.680
Error correction D (DFMGI) D (CAC_40)
CointEq1 0.001491
(0.00161) [2.92364]
0.004456 (0.00164) [ 2.72276]
D (DFMGI(−1)) 0.074333
(0.02595) [ 2.86475]
0.024130 (0.02631) [ 2.91720]
D (CAC_40(−1)) 0.012128
(0.02558) [2.47408]
0.06354 (0.02594) [2.24499]
C 0.842582
(1.31261) [2.64191]
0.601042 (1.33085) [2.45162]
R-squared 0.694176 0.006964
Adj. R-squared 0.003599 0.003622
Sum sq. residuals 3816685. 3923487.
S.E. equation 50.67967 51.38386
F-statistic 2.077165 2.084122
Log likelihood −7970.933 −7991.522
Akaike AIC 10.69294 10.72054
Schwarz SC 10.71429 10.74188
Mean dependent 0.928673 0.602239
S.D. dependent 50.77112 51.47718
Determinant residual covariance (dof adj.) 6781212
Determinant residual covariance 6726781
Log likelihood −15962.43
Akaike information criterion 21.41613
Schwarz criterion 21.46593
Table 12: VECM
Coefficient Coefficient Std. Error t-Statistic Prob.
C (1) 0.001491 0.001614 2.923638 0.3558
C (2) 0.074333 0.025947 2.864748 0.0042
C (3) 0.025446 0.025952 2.980518 0.3270
C (4) 0.012128 0.025583 0.474077 0.6355
C (5) 0.003253 0.025573 0.127198 0.8988
C (6) 0.842582 1.312609 0.641914 0.5210
R-squared 0.694100 Mean dependent var. 0.928673
Adjusted
R-squared 0.003599 S.D. dependent var. 50.77112
S.E. of regression 50.67967 Akaike info criterion 10.69294
Sum squared resid 3816685. Schwarz criterion 10.71429
Log likelihood −7970.933 Hannan-Quinn criter. 10.70089
F-statistic 2.077165 Durbin-Watson stat 1.998899
REFERENCES
Abraham, A., Seyyed, F.J., Alsakran, S.A. (2002), Testing the random walk behaviour and efficiency of Gulf stock markets. The Financial Review, 37, 469-480.
Ang, A., Bekaert, G., (2002), International asset allocation with regime shifts, Review of Financial Studies 15, 1137-1187.
Bekaert, G. (1995), Market integration and investment barriers in emerging equity markets. World Bank Review, 9, 75-107.
Bekaert, G., Harvey, C.R. (1995), Time-varying world market integration. Journal of Finance, 50, 403-444.
Bekaert, G., Harvey, C.R. (1997), Emerging equity market volatility. Journal of Financial Economics, 43, 403-444.
Broner, F., Jaume, V. (2016), Rethinking the effects of financial globalization. Quarterly Journal of Economics, 131(3), 1497-1542. Carrieri, F., Errunza, V., Hogan, K., (2007), Characterizing world market
integration through time, Journal of Financial and Quantitative Analysis 42, 915-940.
Chari, A., Henry, P.B., (2004), Risk Sharing Asset Prices: Evidence From a Natural Experiment, Journal of Finance, 59(3), 1295-1324. De Santis, G., Imrohoroglu, S. (1997), Stock returns and volatility in
emerging financial markets. Journal of International Money and Finance, 16, 561-579.
Dickey, D., Fuller, W. (1979), Distribution of the estimators for autoregressive time series with a unit root. Journal of the American Statistical Association, 74, 427-431.
Espitia, M., Santamaria, R. (1994), International diversification among the capital markets of the EEC. Applied Financial Economics, 4(1), 1-10. French, K., Poterba, J. (1991), Investor diversification and international
equity markets. Americain Economic Review, 81, 222-226. Gentzoglanis, A. (2003), Financial Integration, Regulation and
Competitiveness in MENA Countries. Quebec, Canada: Department of Finance, University of Sherbrook.
Hatemi, J.A., El-Khatib, Y. (2016), An extension of the asymmetric causality tests for dealing with deterministic trend components. Applied Economics, 48, 4033-4041.
Johansen, S. (1991), Estimation and hypothesis testing of cointegration vectors in gaussian vector autoregressive models. Econometrica, 59(6), 1551-1580.
Lagoarde-Segot, T., Lucey, B.M. (2007), International portfolio diversification: Is there a role for the Middle East and North Africa? Journal of Multinational Financial Management, 17, 401-416. Lewis, K. (1999), Trying to explain home bias in equities and consumption.
Journal of Economic Literature, 37, 571-608.
Neaime, S. (2006), Volatilities in emerging MENA stock markets. Thunderbird International Business Review, 48(4), 455-484. Neaime, S., Colton, A.C. (2005), Money and Finance in the Middle East:
Missed Opportunities or future prospects ? Research in Middle East economics, 6.
Park, C.Y., Rogelio, M. (2014), Determinants of financial stress in emerging market economies. Journal of Banking and Finance, 45(C), 199-224.
Solnik, B., Roulet, J. (2000), Dispersion as cross-sectional correlation. Financial Analysts Journal, 56, 54-61.
Solnik, B., Roulet, J. (2000), Dispersion as cross-sectional correlation. Financial Analysts Journal, 56, 54-61.