54
Bloom-ing Heck! The Activities of
Australian Science Teachers and Students
Two Years into a 1:1 Laptop Program
Across 14 High Schools
Simon J. Crook, Manjula D. SharmaCorresponding author: [email protected]
Sydney University Physics Education Research group, The University of Sydney, Sydney NSW 2006, Australia
Keywords: 1:1 laptops, Australian schools, Bloom’s Digital Taxonomy, computers in science classroom, Digital Education Revolution, science
International Journal of Innovation in Science and Mathematics Education, 21(1), 54-69, 2013.
Abstract
This study examines the responses of 1245 science students and 47 science teachers from 14 Catholic high schools in Sydney, Australia, 2010. Two years into a 1:1 laptop program, the types of activities engaged in with laptops as self-reported by teachers and students are analysed. The activities are differentiated from lower- to higher-order using Bloom’s Digital Taxonomy. Though the shift has been to use pen and paper less and laptops more, it is found that the modal practice for students is the lower-order paradigm of note-taking and working from textbooks through electronic means by word processing and electronic textbooks, plus simple online searching. Students enjoy engaging in higher-order activities such as blogging and video editing but teachers do not favour these. Datalogging and databases, despite being encouraged or even mandated by the Board of Studies NSW, are rare experiences. Most science teachers report using simulations but students do not report the same experience. Investment must be made in the professional development of teachers to empower and encourage them to integrate higher-order tasks and to capitalise on the opportunities offered by 1:1 laptops.
Australian Context
In Australia 2008, the Ministerial Council on Education, Employment, Training and Youth Affairs (MCEETYA) released the Melbourne Declaration on Educational Goals for Young Australians. High on the list of priorities, MCEETYA stated that ‘young people need to be highly skilled in the use of ICT’ (2008; p.5) and that over the next decade, schools need to significantly increase the effectiveness of technologies in learning. This complemented the Digital Education Revolution (DER), launched in 2008 (Gillard 2008) to ultimately achieve a computer-to-student ratio of 1:1 over four years (DEEWR 2008).
55
Following DER guidelines, the Catholic Education Office (CEO) Sydney, opted to roll out laptops to every grade 9 student (14 to 15 years old) over 4 years, with the students taking the laptops home every evening after school for a complete 1:1 experience (Knezek & Christensen 2004). The first CEO Sydney school issued its grade 9 students with laptops in September 2008, with the other schools following suit. For CEO Sydney this has meant the provision of laptops to over 4,500 students per year for 4 years i.e. over 18,000 students. To ensure that the DER worked in its schools, CEO Sydney provided every high school with wireless connectivity, technician support plus provided a laptop and substantial professional development opportunities to teachers as a system and more locally within individual schools. This paper examines data collected from grade 10 science students and teachers from CEO Sydney schools in 2010.
Research Context
The paradigm of 1:1 laptops is not a new phenomenon, particularly in Australia (Grasso & Fallshaw 1993; Johnstone 2003; Rowe, Brown, & Lesman 1993). However, there are still many schools, school districts and even countries looking to adopt this model. Looking at the present and to the immediate future, there are also many schools and districts investigating and adopting the idea of 1:1 iPads (DEECD 2011) and personal mobile devices in general. The high profile and much acclaimed Horizon Reports (Johnson, Adams, & Haywood 2011; Johnson, Adams, & Cummins 2012; Johnson, Adams Becker, Cummins, Estrada, Freeman & Ludgate 2013) identify mobile devices as emerging technologies likely to have a large impact on teaching and learning within a year. These reports critically assert that mobile devices are compelling tools for learning; to ignore these claims would be to miss out on one of the primary ways students interact with and learn from each other. Research and understanding gained regarding the impact of 1:1 laptops in the classroom and how teachers adapt (or not) should be directly applicable to future 1:1 technology deployments.
Questions around how the laptops are used by teachers and students and their impact, if any, need to be investigated. This is being addressed through a comprehensive study in which the alignment between teacher and student self-reports of usage has been analysed as the first step (Crook, Sharma, Wilson & Muller 2013), and this paper, investigating the types of activities, is the second of perhaps five papers. In addition, formal evaluation of the DER and 1:1 laptop implementation within New South Wales (NSW) state schools is being conducted by the University of Wollongong and NSW Department of Education and Communities over the next few years (Howard & Carceller 2010, 2011; Howard, Thurtell, & Gigliotti 2012).
Existing Research
56
(2005) predicted that the uncertainties and questions around the impact of technology on learning are likely to be perennial and recurring.
Literature around the use of technology in science tells us that ‘the use of technology in the pedagogy of learning science is important’ (Elliott & Paige 2010; p.13). Online learning environments have been found to result in higher student achievement for students studying physics and chemistry (Preston 2008; Frailich, Kesner, & Hofstein 2007). Technology-rich science classrooms have been found to be essential to gains in inquiry pedagogy (Songer, Lee, & Kam 2002). In fact new pedagogies are emerging, using for example simulations, that enhance conceptual understanding in chemistry (Khan 2010).
However, to the contrary, OECD (2010) split students into nine different profiles based on leisure and educational ICT (Information and Communications Technology) use. These profiles were found to relate differently to performance in science (as well as gender and socio-economic status (SES)) such that, interestingly, higher performance in science is related to lower educational use of computers (in all bar four countries, one of which is Australia, discussed below).
With regard to science teachers specifically and their use of technology, Van Rooy working with Biology teachers notes that ‘if professional development opportunities are provided where the pedagogy of learning and teaching of both the relevant biology and its digital representations are available, then teachers see the immediate pedagogic benefit to student learning’ (2012; p.65). Policy makers and principals can improve the quality of technology integration of science teachers by creating robust professional development opportunities for innovative technology-enhanced science instruction (Shen, Gerard, & Bowyer 2009; Higgins & Spitulnik 2008).
Regarding assessment, computer-based assessment has been identified as having the potential to more broadly assess the objectives of scientific literacy education (Martin 2008). The use of handheld technology has been demonstrated as supporting more frequent assessment practices in science (Yarnall, Shechtman, & Penuel 2006).
Considering specifically 1:1 laptop use in science, embedding laptop use in the science classroom has been shown to make schools more engaging, relevant, modern, and effective institutions (Zucker & Hug 2007). Science classrooms with 1:1 laptops have been found, amongst other things, to increase student motivation, engagement, interest, self-directed learning and student interaction with teachers (Zucker & McGhee 2005). In the study of high school physics, 1:1 laptop programs have presented teachers and students with more opportunities and higher quality tools to explore scientific concepts (Zucker & Hug 2008).
57
about one quarter of Australian teachers cited their own knowledge of using ICT in pedagogy as a limiting factor. In terms of science teaching at grade 8, Ainley et al conclude that Australian science teachers are leaders in the use of ICT with a significantly greater percentage of Australian grade 8 science teachers using ICT in teaching (particularly simulations, 63% compared to an average of 41%) than in all the other 18 countries studied (c.f. OECD (2010) ranking Australia 9th of the 40 countries studied for overall computer use at school in 2006). Interestingly, Ainley et al also find within Australia that the use of ICT is higher for science than mathematics but that this is not associated with age or gender. Bucking the trend internationally, OECD identified Australia as one of only four countries where the effect of increased frequency of computer use, at home or at school, is systematically positive for general value of science, general interest in science and science related activities.
These studies show that computers are being used in Australian science classrooms and have been for some time (though historically on an ad hoc basis (Ng & Gunstone 2003)). The next question is how are 1:1 laptops specifically being used by teachers and students? Is the usage higher- or lower-order? This study examines students’ and teachers’ self-reports of laptop use in science. Future research to further support assertions in this study should also include student and teacher interviews as well as classroom observations.
Theoretical Framework
The study described in this paper examines both teacher and student use of laptops in the classroom and whether new pedagogies have evolved (Khan 2010) or traditional pedagogical practices have remained (Cuban 2001) albeit within a new medium.
The types of use considered in this study are aligned to Bloom’s Digital Taxonomy (BDT) in terms of lower- through to higher-order activities (Churches 2009) as in Figure 1. Bloom’s Digital Taxonomy is an adaptation of the long established Bloom’s Taxonomy (Bloom, Engelhart, Furst, Hill, & Krathwohl 1956), which classified learning objectives in a hierarchy. In 2001, the hierarchy was revised to place ‘creating’ at the top (Anderson & Krathwohl 2001).
58
Figure 1: Bloom’s Digital Taxonomy (reproduced with permission from A. Churches)
59
In the context of this study and the teachers surveyed, it must be highlighted that Bloom’s Digital Taxonomy is part of the vernacular used in eLearning professional development within CEO Sydney schools and would be familiar to many if not most teachers. Examples of the explicit reference to BDT within CEO Sydney professional development are found in the CEO Web 2.0 Course (CEO Sydney 2009), iLE@RN Ning (CEO Sydney 2011) and Catholic Schools Leadership Program (CEO Sydney 2009-2011).
Methodology
In this study, a sample of 14 high schools were issued an online survey in late 2010 to examine the activities of science teachers and students, two years since the 1:1 laptop program had begun. (The first author works with 14 high schools with grade 10. All 14 schools are used in the sample). The schools range from the lowest socio-economic status (SES) with significant fractions of students within the English as a Second Language (ESL) program to some of the highest SES with low ESL high schools in CEO Sydney. All 14 schools are comprehensive and non-academically-selective. Eight schools are single-sex and six are co-educational schools. Four schools cater for grades 7-10 and ten schools cater for grades 7-12. In terms of the size of schools, in 2010, the grade 10 cohorts ranged in size from 108 to 218 with the number of practicing grade 10 science teachers ranging from 4 to 8 per school.
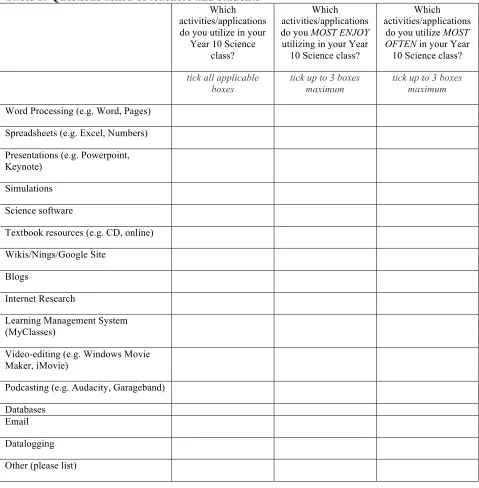
Online surveys were issued to grade (Year) 10 science teachers and students from the participating schools. The surveys were administered online via Google Docs Forms for ease, removing the need, cost, time and errors involved with transcription, whilst retaining security (128-bit encryption). As well as collecting meta-data plus responses to be used in further studies, teachers and students were, for the purpose of this study, asked the same three questions around the types of activities they use their laptops for (see Table 1).
In total, 47 teachers (64% of all grade 10 science teachers) and 1245 students (60% of all grade 10 science students) completed the online surveys. The response rates in this study of over 60% each exceed the normal response rates of online surveys of around 25% (Kaplowitz, Hadlock, & Levine 2004). Furthermore, the sample size is large and there is a range of schools involved.
60
Table 1: Questions asked of teachers and students Which activities/applications do you utilize in your
Year 10 Science class?
Which activities/applications do you MOST ENJOY
utilizing in your Year 10 Science class?
Which activities/applications
do you utilize MOST OFTEN in your Year
10 Science class?
tick all applicable boxes
tick up to 3 boxes maximum
tick up to 3 boxes maximum
Word Processing (e.g. Word, Pages)
Spreadsheets (e.g. Excel, Numbers)
Presentations (e.g. Powerpoint, Keynote)
Simulations
Science software
Textbook resources (e.g. CD, online)
Wikis/Nings/Google Site
Blogs
Internet Research
Learning Management System (MyClasses)
Video-editing (e.g. Windows Movie Maker, iMovie)
Podcasting (e.g. Audacity, Garageband)
Databases Email
Datalogging
Other (please list)
Results and Discussion
61
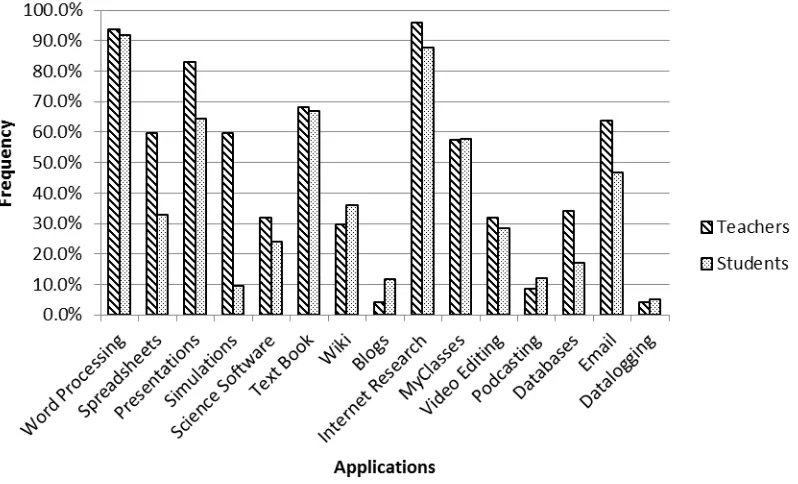
Figure 3: Frequencies of Use for All Applications
There are two noteworthy features from Figure 3. Firstly, regarding all applications/activities, every option was selected within the total samples of teachers and students. However, given the option to tick as many boxes as possible, teachers selected more options (48%) compared to students (39%). This would indicate that teachers use a greater variety of applications than students. Secondly, the four applications used most by teachers, in order, are: internet research (96%), word processing (94%), presentations (83%) and textbook (68%). For students they are: word processing (92%), internet research (88%), textbook (67%) and presentations (64%). The teachers report the same as the students, adding validity to the results, but in a slightly different order. Comments obtained by the survey from the individual students e.g. “not a lot of
application to science unless it’s taking notes in class”, plus anecdotal evidence would suggest
62
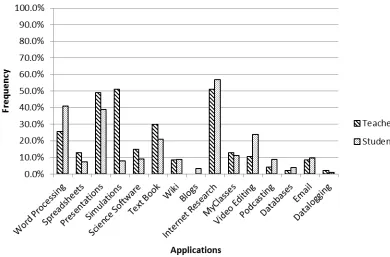
Figure 4: Frequencies of the 3 Most Enjoyable Applications
63
Figure 5: Frequencies of the 3 Applications Used Most Often
Perhaps of most interest are the results of the three most utilised applications/activities (see Figure 5). These results essentially paint a picture of what is actually taking place in the classroom. Teachers most often use word processing (45%), internet research (40%) and an electronic textbook (36%) i.e. lower-order activities. Students report most often using word processing (80%), internet research (58%) and an electronic textbook (40%) i.e. the same three applications in the same order as identified by the teachers, again adding validity to the results. These results would suggest that the students are mostly taking notes by typing into their laptops (whereas previously this would have been the same exercise but writing into a book). Even if the students were involved in higher-order word processing, it would still be a digital replication of the pedagogy of pen and paper (with the exception of publishing). Equally, students are now using an electronic textbook where they would previously have been using an actual textbook. (In a few exceptional cases electronic textbooks include interactive simulations (Zucker & Hug 2008) but in many cases they are not much more than the original textbooks now in PDF or HTML format). It is perhaps surprising that teachers do not rank presentations higher (25%). It would appear then that students are taking notes from the textbook, the board and perhaps dictation more than ‘death by Powerpoint’. The only new classroom practice that appears to be taking place in any sizeable frequency is internet research, usually performed in a lower-order manner (Churches 2009).
Of particular interest are the asymmetries between what teachers and students most enjoy and what they report using most often. Most strikingly, whereas 80% of students report doing word processing most often only 41% report actually enjoying it. Taking notes is very much a teacher-centred knowledge delivery activity rather than student-teacher-centred knowledge creation activity. Research indicates that the prevalence of such practices will lead to disengagement and decreased motivation (Guthrie & Davis 2003). Similarly 40% of students report using an electronic textbook most often in class whereas only 21% enjoy using it.
Regarding middle order activities, comparing across the three figures, it is interesting to note that almost twice as many teachers (60%) report using spreadsheets (‘analysing’ in BDT) as students (33%). This would imply spreadsheets are used more for class administration and teacher-centred activities than student-teacher-centred learning. Spreadsheets are not enjoyable or popular for teachers (13%) or students (7%) it would appear. Given that spreadsheets can be incredibly valuable during experimentation, data analysis and interpretation in science, their full value is not being exploited, perhaps requiring constructivist learning to rectify this (Abbott, Townsend, Johnston-Wilder & Reynolds 2009).
64
However, only 34% of teachers and 17% of students report having used them. This would appear non-compliant with Board of Studies requirements. In defence of the science teachers, it is somewhat arbitrary the way databases were designated to science in preparation for the School Certificate Computing Skills Test. Many teachers viewed databases as an add-on and left until just prior to the Computing Skills Test. (This occurred after the time of the surveys). The Computing Skills hark back to 1990’s Microsoft Office®. It can be argued that the most commonplace database package, Microsoft Access®, is unintuitive. In addition, 8 of the 14 schools have Apple MacBooks® which one could argue have database packages that are even less intuitive and less familiar. This low frequency of use of datalogging is backed up by Ainley et al (2010) for Australian schools across the board.
The starkest difference in reported use is with regard to simulations. 60% of teachers report using simulations at one time or another (very close to the 63% measured by Ainley et al (2010)) whereas only 9% of students report the same. Compare this with 55% of students using simulations weekly at the Denver School of Science and Technology (Zucker & Hug 2008). It is heartening that teachers rank simulations in equal first place thereby taking advantage of science specific offerings that the laptops can access. However, the disparity between teachers and students is a dilemma, why is this so? This needs further follow up with interviews. It possibly indicates teachers checking out simulations but not implementing them. Or, perhaps more likely, teacher-centred instruction and a lack of student experimentation and exploration with simulations. This is of great surprise and perhaps disappointment as simulations are particularly engaging for science students (Khan 2010; Baggott la Velle, Wishart, McFarlane, Brawn, & John 2007). There are many great simulations for students to use in learning science e.g. Scootle
http://www.scootle.edu.au, Celestia http://www.shatters.net/celestia/, PhET
http://phet.colorado.edu/, Java Applets on Physics http://www.walter-fendt.de/ph14e/ and AMPS
http://www.hscphysics.edu.au/resource/template.swf. At first glance students do not rate simulations (8%). However, considering only 9% report using simulations in the first place, they are in fact very popular amongst users. If teachers could tap into this affinity for simulations it is arguable that students would be more motivated and engaged in science (Garrigan 2011) when using laptops. It has been demonstrated that more interactive instruction can prompt improved understanding of science (Tanahoung, Chitaree, Soankwan, Sharma, & Johnston 2010). With many of these simulations, middle- to higher-order Bloom’s would be possible, depending of course on how they are used.
65
using the higher-order technologies video-editing (28%) and podcasting (12%), most of these students enjoy using them. Surprisingly this is not the case with wikis (36% dropping to 9%). However, from the teachers’ point-of-view, only 11% enjoy video-editing, 4% enjoy podcasting and 0% enjoy blogs! A lack of appreciation of activities by teachers would no doubt deny students opportunities to explore such technologies. Of the 28% of students that report they enjoy video-editing, only 4% get to engage in it often. Making students engage in lower-order activities they do not enjoy and denying them new found opportunities through the laptops to activities they do enjoy is counter-productive and counter-intuitive, potentially leading to disaffection with studying science (Elliott & Paige 2010).
Implications for Research and Practice
This research provides an indication of the practices of science teachers and the experiences of science students in 1:1 laptop classrooms in Australia in 2010. This paper, along with previous complementary research (Crook et al 2013), will contribute to a larger study assessing the impact of 1:1 laptops on student performance in science. In time, longitudinal data will emerge for the 14 schools in this study.
To further support the claims made in this study it would be beneficial to conduct interviews with teachers and students, classroom observations and analyse students’ work. A particular point of focus could be to drill in on the actions and activities associated with word processing since arguably word processing can cover all levels (see Figure 2). Such findings would argue for or against the assertions in this paper that most word processing is around lower-order thinking skills.
Further investigation should also add to the body of research, e.g. Valanides and Angeli (2008), around what role teacher professional development plays on shifting pedagogy and which models work best with time-poor teachers. Similarly, school leadership and culture could be scrutinised to investigate how they impact on the embedding of new practices.
Conclusion
In 2010, two years into the Digital Education Revolution and 1:1 paradigm, it can be seen that the teachers and students studied are partaking in a variety of activities. However, though the shift has been to use pen and paper less and laptops more, by and large teachers are still instructing students in a lower-order, teacher-centred paradigm, albeit electronically. It is of concern that a greater shift has not occurred since 1:1 laptops have been in Australia (the first place in the world) since 1990 (Johnstone 2003). Such shifts need to occur if schools are now to embrace the prevalence and use of mobile devices (Johnson, Adams, & Cummins 2012).
66
schools seemed to pick up on affordances that reinforced institutionalized priorities. Rather than opening up new opportunities to reframe how teachers teach and students learn, it seemed as though instructionalism bent technologies to extend existing pedagogical, curriculum delivery, and assessment practices (2009; p.52).
In Bloom’s Digital Taxonomy, Churches writes ‘it’s not about the tools; it’s about using the tools for learning’ (2009). That is, it is not simply about giving students laptops. Indeed, it is not even about telling students to engage in higher-order activities such as wiki-ing and blogging. What is important is that any technologies are incorporated into teaching and learning to compliment the practices and to strategically and appropriately benefit the pedagogy e.g. through increased opportunities for interaction and feedback (Hattie 2009). We need to get the pedagogy right in the first place, with or without the technology. We should be probing the affordances provided by new technologies for two compelling reasons: (1) the new technologies provide greater opportunities for the diverse range of students and (2) the student body is very different today and new technologies are central to their everyday lives. As the proverb goes (often credited to Rabindranath Tagore):
do not confine your children to your own learning, for they were born in another time.
We should be questioning the role of chalk-and talk and textbooks in pedagogy rather than propagating them because they were used on us; students have a right to be engaged in more contemporary, student-centred learning. We should be questioning how different tools can be integrated to support a multiplicity of learning activities and opportunities with the student at the centre. We should be questioning if and how the tools can be used to facilitate differentiated teaching and learning opportunities.
The Digital Education Revolution has provided our teachers and particularly our students with a unique opportunity to access contemporary learning activities. Given the relative readiness of many students in this study, it is evident that we need to invest further in the teachers to empower them to become more aligned with their students (Crook et al 2013). Key to this is equipping teachers with a greater understanding of the value of technology (Ottenbreit-Leftwich, Glazewski, Newby, & Ertmer 2010), how this translates into practice and to provide a multiplicity of professional development opportunities.
67
Acknowledgements
This project has human ethics approval from CEO Sydney and The University of Sydney. We are extremely grateful for the support, participation and openness from the teachers and students of the participating schools and the cooperation and support of CEO Sydney.
References
Abbott, I., Townsend, A., Johnston-Wilder, S., & Reynolds, L. (2009). Literature Review: Deep learning with technology in 14- to 19-year-old learners: University of Warwick.
ACARA. (2011). The Australian Curriculum. Retrieved 4th May, 2011, from http://www.australiancurriculum.edu.au/
Ainley, J., Eveleigh, F., Freeman, C., & O'Malley, K. (2010). ICT in the teaching of science and mathematics in year 8 in Australia: report from the IEA Second International Technology in Education Study (SITES) survey. from http://research.acer.edu.au/acer_monographs/6
Anderson, L. W., & Krathwohl, D. R. (2001). A Taxonomy for learning, teaching, and assessing: A revision of Bloom's taxonomy of educational objectives. New York: Longman.
Baggott la Velle, L., Wishart, J., McFarlane, A., Brawn, R., & John, P. (2007). Teaching and learning with ICT within the subject culture of secondary school science. Research in Science & Technological Education, 25(3), 339-349.
Baylor, A. L., & Ritchie, D. (2002) What factors facilitate teacher skill, teacher morale, and perceived student learning in technology-using classrooms?, Computers & Education, 39(4), 395-414, ISSN 0360-1315, http://dx.doi.org/10.1016/S0360-1315(02)00075-1.
Bebell, D., & Kay, R. (2010). One to One Computing: A summary of the quantitative results from the Berkshire Wireless Learning Initiative. Journal of Technology, Learning and Assessment, 9(2).
Bebell, D., & O’Dwyer, L. M. (2010). Educational outcomes and research from 1:1 computing settings. Journal of Technology, Learning and Assessment, 9(1).
Bloom, B. S., Engelhart, M. D., Furst, E. J., Hill, W. H., & Krathwohl, D. R. (1956). Taxonomy of educational objectives: Classification of educational goals. London: Longmans.
Board of Studies NSW. (1998). Science stages 4–5: Syllabus: Board of Studies NSW. Board of Studies NSW. (2003a). Science years 7–10: Syllabus: Board of Studies NSW.
Board of Studies NSW. (2003b). School Certificate Computing Skills Test: Board of Studies NSW.
Bower, M., Hedberg, J. G., & Kuswara, A. (2010). A framework for Web 2.0 learning design Educational Media International, 47(3), 177-198.
Crook, S. J., Sharma, M. D., Wilson, R., & Muller, D. A. (2013). Seeing eye-to-eye on ICT: Science student and teacher perceptions of laptop use across 14 Australian schools. Australasian Journal of Educational Technology. 29(1), 82-95.
CEO Sydney. (2008). eLearning with the iLE@RN Model. Retrieved 8th September, 2008, from http://www.ceosyd.catholic.edu.au/Parents/Curriculum/Documents/dp-elearn.pdf
CEO Sydney. (2009). Web 2.0 Course. Retrieved 3rd September, 2009, institutional website
CEO Sydney. (2009-2011). Catholic schools leadership program. Retrieved 2nd May, 2012, institutional professional development programs
CEO Sydney. (2011). iLE@RN resources and links. Retrieved 29th May, 2011, from http://ilearn.ceosyd.catholic.edu.au/page/resources-and-links
Churches, A. (2009). Bloom's digital taxonomy. Retrieved 6th June, 2009, from http://edorigami.wikispaces.com/Bloom%27s+Digital+Taxonomy
Cuban, L. (2001). Oversold and underused: Computers in the classroom. Cambridge, MA: Harvard University. DEECD. (2011). iPads 4 Learning: 21 Steps to iPad Success. Retrieved 25th November, 2011, from
http://www.ipadsforeducation.vic.edu.au/1-to-1-learning-success
DEEWR. (2008). National secondary school computer fund. Retrieved 6th February, 2008, from
http://www.deewr.gov.au/SCHOOLING/DIGITALEDUCATIONREVOLUTION/COMPUTERFUND/Pages/Na tionalSecondarySchoolComputerFundOverview.aspx
68
Farmer, B., Yue, A., & Brooks, C. (2008). Using blogging for higher order learning in large cohort university teaching: A case study. Australasian Journal of Educational Technology, 24(2), 123-136.
Frailich, M., Kesner, M., & Hofstein, A. (2007). The influence of web-based chemistry learning on students' perceptions, attitudes, and achievements. Research in Science & Technological Education, 25(2), 179-197. Fried, C. B. (2008). In-class laptop use and its effects on student learning. Computers & Education, 50(3).
Garrigan, S. (2011). Interactive simulations to develop higher-level science and math skills with your laptops. One-to-One, 7(4). Retrieved from http://www.aalf.org/articles/view.php?ArticleID=100
Gillard, J. (2008). Delivering a Digital Education Revolution. Retrieved from http://ministers.deewr.gov.au/gillard/delivering-digital-education-revolution.
Grasso, I., & Fallshaw, M. (1993). Reflections of a learning community: views on the introduction of laptops at MLC. Kew Vic.: Methodist Ladies College.
Greaves, T., Hayes, J., Wilson, L., Gielniak, M., & Peterson, R. (2010). The technology factor: Nine keys to student achievement and cost-effectiveness: MDR.
Gulek, J. C., & Demirtas, H. (2005). Learning with technology: The impact of laptop use on student achievement.
Journal of Technology, Learning and Assessment, 3(2).
Guthrie, J. T., & Davis, M. H. (2003). Motivating struggling readers in middle school through and engagement model of classroom practice. Reading & Writing Quarterly, 19(1), 59-85.
Halverson, R., & Smith, A. (2009). How new technologies have (and have not) changed teaching and learning in schools. Journal of Computing in Teacher Education, 26(2), 49-54 Retrieved 30th September, 2010, from http://dm.education.wisc.edu/rrhalverson/intellcont/Halverson_Smith_How_New_Technologies-1.pdf Hattie, J. (2009). Visible learning: A synthesis of over 800 meta-analyses relating to achievement: Routledge. Higgins, T. E., & Spitulnik, M. W. (2008). Supporting teachers’ use of technology in science instruction through
professional development: A literature review. Journal of Science Education and Technology, 17(5), 511-521. Howard, S. K., & Carceller, C. (2010). The impact of the Digital Education Revolution in NSW government schools:
Baseline data. Sydney: NSW Department of Education and Training.
Howard, S. K., & Carceller, C. (2011). DER-NSW 2010: Implications of the 2010 data collection. Sydney: New South Wales Department of Education and Communities.
Howard, S. K., Thurtell, E., & Gigliotti, A. (2012). DER-NSW Evaluation: Report on the implications of the 2011 data collection. Sydney: NSW Department of Education and Communities.
Ingram, D., Willcutt, J., & Jordan, K. (2008). Laptop initiative: Evaluation report. University of Minnesota: Center for Applied Research and Educational Improvement.
Johnson, L., Adams Becker, S., Cummins, M., Estrada V., Freeman, A., & Ludgate, H. (2013). NMC Horizon Report: 2013 K-12 Edition. Austin, Texas: The New Media Consortium.
Johnson, L., Adams, S., & Cummins, M. (2012). NMC Horizon Report: 2012 K-12 Edition. Austin, Texas: The New Media Consortium.
Johnson, L., Adams, S., & Haywood, K. (2011). The NMC Horizon Report: 2011 K-12. Austin, Texas: The New Media Consortium.
Johnstone, B. (2003). Never mind the laptops: Kids, computers, and the transformation of learning. New York: iUniverse, Inc.
Kaplowitz, M. D., Hadlock, T. D., & Levine, R. (2004). A comparison of web and mail survey response rates. The Public Opinion Quarterly, 68(1), 94-101.
Khan, S. (2010). New pedagogies on teaching science with computer simulations. Journal of Science Education and Technology, 20(3), 215-232.
Knezek, G., & Christensen, R. (2004). Student home access and the digital divide: An exploratory analysis of laptop computer access with take-home privileges versus restrictions to use only in school. University of North Texas: Institute for the Integration of Technology into Teaching & Learning.
Li Q. (2007) Student and teacher views about technology: a tale of two cities? Journal of Research on Technology in Education 39(4), 377–397.
Love, B. J. (2009). The inclusion of Bloom's taxonomy in state learning standards: A content analysis. Southern Illinois University at Carbondale.
Martin, R. (2008). Utilising the potential of computer delivered surveys in assessing scientific literacy. Paper presented at the CBAS. Retrieved from
https://mypisa.acer.edu.au/index.php?option=com_content&task=view&id=117&Itemid=448 MCEETYA. (2008). Melbourne Declaration on educational goals for young Australians.
69
Ng, W., & Gunstone, R. (2003). Science and computer-based technologies: attitudes of secondary science teachers.
Research in Science & Technological Education, 21(2), 243-264.
OECD. (2010). Are the new millennium learners making the grade? Technology use and educational performance in PISA.
OECD. (2011). PISA 2009 results: Students online digital technologies and performance.
Ottenbreit-Leftwich, A. T., Glazewski, K. D., Newby, T. J., & Ertmer, P. A. (2010). Teacher value beliefs associated with using technology: Addressing professional and student needs. Computers & Education, 55(3), 1321-1335. Penuel, W. R. (2006). Implementation and effects of one-to-one computing initiatives: A research synthesis. Journal
of Research on Technology in Education 38(3), 329-348.
Piccoli, A. (2011). Government to abolish school certificate. [Press release] Retrieved from
http://www.boardofstudies.nsw.edu.au/rosa/pdf_doc/110804-government-to-abolish-school-certificate.pdf Preston, J. F. (2008). Technology's impact on student understanding and retention of motion and forces. Michigan
State University.
Rieger, O. Y. (2009). Search engine use behavior of students and faculty: User perceptions and implications for future research. First Monday, 14(12).
Rowe, H. A. H., Brown, I., & Lesman, I. (1993). Learning with personal computers : issues, observations, and perspectives. Hawthorn: Australian Council for Educational Research.
Ruth, A., & Houghton, L. (2009). The wiki way of learning. Australasian Journal of Educational Technology, 25(2), 135-152.
Shen, J., Gerard, L., & Bowyer, J. (2009). Getting from here to there: The roles of policy makers and principals in increasing science teacher quality. Journal of Science Teacher Education, 21(3), 283-307.
Songer, N. B., Lee, H.-S., & Kam, R. (2002). Technology-rich inquiry science in urban classrooms: What are the barriers to inquiry pedagogy? Journal of Research in Science Teaching, 39(2), 128-150.
Tanahoung, C., Chitaree, R., Soankwan, C., Sharma, M. D., & Johnston, I. D. (2010). The effect of interactive lecture demonstrations on students’ understanding of heat and temperature: a study from Thailand. Research in Science & Technological Education, 27(1), 61-74.
U.S. Department of Education. (2010). Evaluation of evidence-based practices in online learning: A meta-analysis and review of online learning studies. Washington, D.C.
Valanides, N., & Angeli, C. (2008). Professional development for computer-enhanced learning: a case study with science teachers. Research in Science & Technological Education, 26(1), 3-12.
Valiente, O. (2010). 1-1 in education: Current practice, international comparative research evidence and policy implications. OECD Education Working Papers, No. 44.
Van Rooy, W. S. (2012). Using information and communication technology (ICT) to the maximum: learning and teaching biology with limited digital technologies. Research in Science & Technological Education, 30(1), 65-80. Vigdor, J. L., & Ladd, H. F. (2010). Scaling the digital divide: Home computer technology and student achievement.
National Bureau of Economic Research Working Paper Series, No. 16078.
Wellington, J. (2005). Has ICT come of age? Recurring debates on the role of ICT in education, 1982–2004.
Research in Science & Technological Education, 23(1), 25-39.
Weston, M. E., & Bain, A. (2010). The end of techno-critique: The naked truth about 1:1 laptop initiatives and educational change. Journal of Technology, Learning and Assessment, 9(6).
Yarnall, L., Shechtman, N., & Penuel, W. R. (2006). Using handheld computers to support improved classroom assessment in science: Results from a field trial. Journal of Science Education and Technology 15(2), 142-158. Zucker, A. A., & Hug, S. T. (2007). A study of the 1:1 laptop program at the Denver School of Science &
Technology. Denver, CO: Denver School of Science & Technology.
Zucker, A. A., & Hug, S. T. (2008). Teaching and learning physics in a 1:1 laptop school. Journal of Science Education and Technology, 17(6), 586-594