METHODOLOGY
Studies on cellulase-ultrasonic
assisted extraction technology for flavonoids
from
Illicium verum
residues
Danna Huang
1†, Xiaolei Zhou
1,2†, Jianzhi Si
1, Xiaomei Gong
1,3and Shuo Wang
1,3*Abstract
Background: Illicium verum is widely cultivated in southern China especially in Guangxi province. Its fruits has been traditionally used in Chinese medicine. In recent years, it has been the industrial source of shikimic acid. Usually the residues after extracting shikimic acid are treated as waste. Thus, the aim of this study was to optimize the extraction conditions of cellulase-ultrasonic assisted extraction technology for flavonoids from I. verum residues.
Results: The optimum extraction conditions with a maximum flavonoids yield of 14.76 % are as follows: the con-centration of ethanol is 51.14 %, the liquid–solid ratio is 20.52 mL/g, the enzymatic hydrolysis pH is 5.303, the sonica-tion time is 60 min, the enzyme solusonica-tion temperature is kept at 45 °C, the amount of added enzyme is 70 mg/g, the enzymatic hydrolysis time is 2 h and the crushed mesh size is 0.355–0.85 mm.
Conclusions: The data indicate that the cellulase-ultrasonic assisted extraction technology has the potential be used for the industrial production of flavonoids from I. verum.
Keywords: Cellulase-ultrasonic, Extraction, Flavonoid, Illicium verum
© 2016 The Author(s). This article is distributed under the terms of the Creative Commons Attribution 4.0 International License (http://creativecommons.org/licenses/by/4.0/), which permits unrestricted use, distribution, and reproduction in any medium, provided you give appropriate credit to the original author(s) and the source, provide a link to the Creative Commons license, and indicate if changes were made. The Creative Commons Public Domain Dedication waiver (http://creativecommons.org/ publicdomain/zero/1.0/) applies to the data made available in this article, unless otherwise stated.
Background
Illicium verum Hook. f., known as Chinese star anise, is a magnoliaceae evergreen arbor plant that grows mainly in Southwest China, especially in the provinces of Guangxi, Guangdong, Yunnan and Fujian. China is already the world’s largest producer of I. verum, with its cultivation as a medicinal plant in the Guangxi province account-ing for approximately 90 % of the total output [1–3]. As a kind of popular cooking spice, the dried fruits of I. verum have also been used traditionally in Chinese medi-cines. In 2002, I. verum was categorized as both food and medicine by the Ministry of Health, People’s Republic of China and it is listed in the Chinese Pharmacopoeia with the actions of warming yang and dispelling cold, and regulating the flow of Qi to relieve pain [4–6]. The most valuable part of I. verum is the essential oil extracted
from it which has a wide range of commercial applica-tions including the production of perfumes, cosmetics, soaps, foods and beverage flavoring [7, 8]. Furthermore,
I. verum is the industrial source of shikimic acid, a key intermediate used in the production of Tamiflu, which is a well-known antiviral drug and has recently been used to reduce the effects of bird flu [9]. I. verum has also been reported to possess antioxidant and antimicrobial activi-ties due to its high concentrations of phenol compounds, and it is known that flavonoids also play an important role in this regard [10–12].
Medicinal plant material is used in a large number of phytopharmaceutical industries but the growing demand for these medicines means that the medicinal plant sources might no longer be capable of providing enough material in the future. However, the rich extracts from the I. verum biomass have traditionally been considered as waste because of inefficient extraction and separa-tion processes [3], and usually the residues are treated as waste. A great number of innovative extraction meth-ods such as ultrasound-assisted extraction, supercritical
Open Access
*Correspondence: [email protected]
†Danna Huang and Xiaolei Zhou contributed equally to this work 1 Guangxi Botanical Garden of Medicinal Plants, Nanning 530023, People’s Republic of China
fluid extraction, extrusion and microwave extraction are now employed in the food industry [8]. Enzyme-assisted extraction is a mild, efficient and environmental friendly extraction method and it has been adopted for extract-ing various kinds of compounds recently [13]. The ultra-sound-assisted extraction technique causes collapse of cavitation bubbles which generates sufficient energy to give rise to collisions between suspended plant particles for accelerating the release, diffusion and dissolution of active substances in the cell. On the other hand, enzyme-assisted extraction uses enzyme preparations either alone or in mixtures that catalyze hydrolysis of the cytoderm and glycoproteins, and enhance the release of bioactive substances by disrupting plant cells [14]. Enzymolysis-ultrasonic assisted extraction is a combined extraction method, which has advantages of the two extraction methods such as mild extraction conditions, lower investment costs and energy requirements, and simpli-fied manipulation [15].
Recently, response surface methodology (RSM), which is a statistical technique to determine the influences of individual factors and their interactive influences, has been used increasingly to optimize processing param-eters [8, 16–18]. In some previous reports, the opti-mization studies on enzymolysis-ultrasonic assisted extraction of Cucurbita moschata, Lycium barbarum,
Momordica charabtia, wheat bran and corn silk have been performed using RSM [13–15, 19, 20]. Hence, the cellulase-ultrasonic assisted extraction technology for fla-vonoids from plants, combining the mild bio-enzymatic hydrolysis conditions and the rapid ultrasonic extraction technology, will protect the maximum bio-activity of the flavonoids. In this paper, we studied the optimization of cellulase-ultrasonic assisted extraction for flavonoids from I. verum residues using response surface method-ology. The adsorption conditions were optimized from a single factor and orthogonal design experiments and orption conditions were optimized from dynamic des-orption experiments.
Experimental
Materials
The dried fruits of I. verum Hook. f. were collected from Baise County, Guangxi, China. A voucher specimen of this material was deposited in the herbarium of the Guangxi Botanical Garden of Medicinal Plants.
Cellulase was purchased from Sigma Company (USA, No. SC118401). Rutin used as the control was obtained from Sinopharm Chemical Reagent Co., Ltd (China, No. U1606503). Ethanol, methanol, petroleum ether were bought from Guangdong Xilong Chemical Factory (China). Hydrochloric acid was from Shanghai Ailian Chemical Reagent Company (China) and sulfuric acid
was from Tianjing Qingfa Chemical Factory. Other rea-gents used in the experiments were purchased from Sin-opharm Chemical Reagent Co., Ltd (China).
Methodologies
Sample preparation
1 kg dried plant materials was powdered with a mill (Fz-02, Zhejiang Baile Mill Factory). After drying at 60 °C for 12 h, 0.9 kg of crushed material was used for extracting shikimic acid by a water extraction method [21], and then the residues were degreased and decolorized in petro-leum ether with a ratio of 1:3 (m/v) at 60 °C, and carried on a backflow for 4 h. Subsequently, the residue product was dried at 60 °C for 48 h and weighed, then stored in a desiccator in order to maintain a constant weight for use in the subsequent experiments. The weight of the residue product was 0.8865 kg, which accounted for 98.5 % of the raw crushed materials.
Identification of flavonoids
An appropriate amount of the prepared samples was reflux with 80 % ethanol at a solid liquid ratio of 1:10 (m/v) at 80 °C for 2 h. The ethanol solution was con-centrated by reducing the pressure and dried by vacuum. The total flavonoid extracts obtained were dissolved in methanol and then tested using the HCl–Mg reaction and the aluminum chloride colorimetric methods. The extracts responded positively to these characteristic color reactions for flavonoids.
Standard curve preparation
5.0 mg of rutin was dissolved in 60 % ethanol to a con-centration of 0.2 mg/mL for use as the rutin standard solution. A set of standard solutions containing 0, 0.08, 0.16, 0.24, 0.32, 0.4 and 0.48 mg of rutin were made up in a total of 5 mL of 60 % ethanol. 0.4 mL of 5 % NaNO2
solution was added to each tube, which was incubated and shaken for 6 min, and then 0.4 mL of 5 % Al(NO3)3
solution was added and shaken for a further 6 min. 4 mL of 4 % NaOH solution was added and this was made up to 10 mL with 60 % ethanol. After incubation for 15 min, the rutin standard solutions with extracted flavonoids were developed by addition of a Na2NO2–Al(NO3)3–NaOH
coloration system. This was the read at the wavelength range of 200–700 nm on an ultraviolet spectrophotome-ter. The absorbance was measured at 500 nm which is the selected maximum absorption wavelength and a stand-ard curve was created.
Determination of optimum conditions for extraction of flavonoids
buffer was used to adjust pH. The enzymatic hydrolysis was conducted at a constant temperature and pH for sev-eral hours. After inactivating the cellulose at 100 °C for 5 min, 15 mL ethanol was added and the mixture was subjected to ultrasonic treatment. The extraction process was designed with these corresponding conditions. Using the following conditions of 10 mg/mL cellulase, 50 % ethanol, a mesh size of 0.355–0.85 mm, 2 h of enzymatic hydrolysis at pH 5, a liquid–solid ratio of 20:1, 60 min of sonication time and 40 °C, extraction temperature, the extraction yield of flavonoids from the I. verum resi-dues was determined. Each of the parameters was kept as above while the others were varied as follows: cellu-lase concentrations (2, 6, 10, 14 and 18 mg/mL), ethanol concentrations (10, 15, 20, 25, 30 and 50 %), mesh sizes (0.85–2.0, 0.355–0.85, 0.25–0.355 and 0.18–0.25 mm), enzymatic hydrolysis times (0.5, 1, 1.5, 2, 2.5 and 3 h), pH (3, 4, 5, 6 and 7), different liquid–solid ratios (5:1, 10:1, 15:1, 20:1, 25:1 and 30:1), sonication times (15, 30, 45, 60, 75 and 90 min) and extraction temperatures (35, 40, 45, 50, 55, 60 and 65 °C). All tests were carried out in triplicate.
Response surface optimization design
Determination of main experimental factors
On the basis of the single factor determinations of extraction experiments, we selected a set of experimen-tal factors. The main experimenexperimen-tal factors were further subjected to selection by the Plackett–Burman design in order to simplify the subsequent response surface experi-mental design.
Optimization by Box–Benhnken design
According to the principles of the Box–Benhnken design, the main experimental factors that affect the extraction process of flavonoids from residues of I. verum samples were optimized and the response surface analysis was carried out. The relationship between the extraction yield and each factor was established.
Data analysis
Results were analyzed in triplicate and expressed as mean ± standard deviation. The data were analyzed by DPS statistical software and p < 0.05 was considered to be statistically significant.
Results and discussion
Standard curve and regression equation
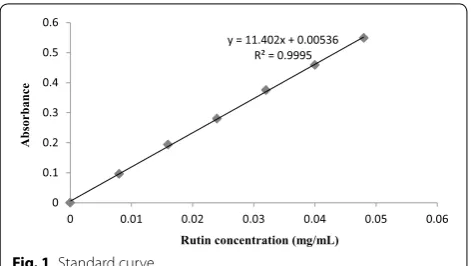
The absorbance was measured at the wavelength of 500 nm and the standard curve of rutin is shown in Fig. 1. Using the linear least square approach, the regres-sion equation between the concentration and absorb-ance of rutin standard solutions was obtained as,
A = 11.402C + 0.00536 (R2 = 0.9995). Its linear range is
from 0.008 to 0.048 mg/mL. The linear calibration was performed to enable quantification of the flavonoids. The extraction yield of flavonoids from the samples was cal-culated as the percentage of the content according to the following equation:
where A is absorbance, C is concentration of flavonoids (mg/mL), V is volume of solution (mL), and m is content of the test sample (mg).
Single factor experiment
Effect of sonication time on the extraction yield
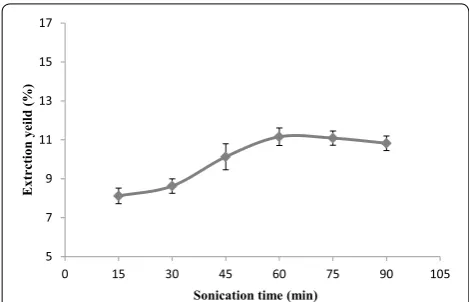
Starting from 15 min, the extraction yield increased with an increase of sonication time and reached the maximum value of 11.16 % at 60 min, and then it decreased gradu-ally (Fig. 2). This may be due to low stability of some fla-vonoids which degraded due to ultrasonic heat effects, and may further result in destruction of their basic structures. The optimum ultrasonic processing time for extracting the flavonoids was determined to be 60 min.
Effect of liquid–solid ratio on the extraction yield
Figure 3 reveals that the extraction yield of flavonoids was raised with an increased amount of the extract-ing agent initially from 5 mL and reached the maximum value of 14.63 % at the liquid–solid ratio of 20:1 after which it levelled off. When the liquid–solid ratio was too low, the flavonoids cannot be extracted adequately from the lysed cells. However, when ratio is too high, this will weaken the effect of ultrasonic waves on the fragmenta-tion of the sample. Therefore, the liquid–solid ratio of 20:1 was selected.
Effect of ethanol concentration on the extraction yield
The effect of ethanol on flavonoids extraction was inves-tigated from 30 to 80 %. It is seen in Fig. 4 that different
Extraction yield(%)=
C×V
m ×100 %
y = 11.402x + 0.00536 R² = 0.9995
0 0.1 0.2 0.3 0.4 0.5 0.6
0 0.01 0.02 0.03 0.04 0.05 0.06
Rutin concentration (mg/mL)
Absorbance
concentrations of ethanol have an impact on the flavo-noids extraction yield. Low or high concentrations of ethanol are not conducive to the optimum extraction and this is related to the type of flavonoids present in the sample. The flavonoid glycoside components with less polar portions are soluble in ethanol, however, those that are more polar are soluble in water. So when the ethanol concentration reaches the correct proportion, the total flavonoids extraction yield reached the highest value. The experimental results showed that 50 % ethanol was the optimal concentration to extract the flavonoids from the samples.
Effect of enzymatic hydrolysis pH on the extraction yield
Figure 5 shows that in the range of pH from 3 to 7, the extraction yield was raised below pH 5 and reached the maximum extraction yield of 15.42 % at pH 5 and then it declined as it neared a neutral pH. This can be explained by the fact that the enzymatic hydrolysis pH had an effect on the cell wall with respect to the hydrolysis of cellulase. Reaction conditions with too much acid or alkali will lead to a loss of biological enzyme activity, and also increase the loss of other non-flavonoids ingredients, so those conditions are not conducive to the extraction of the tar-get components.
Effect of extraction temperature on the extraction yield
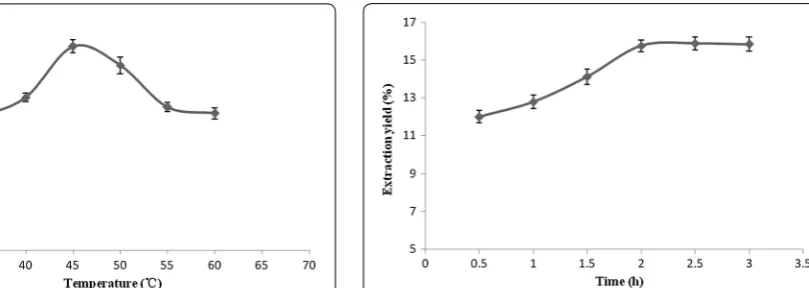
Figure 6 shows that from 35 to 45 °C, the flavonoids extraction yield increased with a rise of the enzymatic extraction temperature, and the peak yield (15.73 %) was reached at an extraction temperature of 45 °C. When the extraction temperature was higher than 45 °C, the extrac-tion yield kept on decreasing due to the fact that the high extraction temperature always resulted in an increase of
5 7 9 11 13 15 17
0 15 30 45 60 75 90 105
Extrction
yeild (%)
Sonication time (min)
Fig. 2 The effect of sonication times on the extraction yield of flavonoids
5 7 9 11 13 15 17
0 5 10 15 20 25 30 35
Extrction
yeild (%)
Liquid-solid ratio (mL/g)
Fig. 3 The effect of liquid–solid ratios on the extraction yield of flavonoids
Fig. 4 The effect of ethanol concentrations on the extraction yield of
enzyme activity [19, 20]. Therefore, it can be considered that the optimum reaction temperature for enzymatic hydrolysis of the cell wall of I. verum is at 45 °C.
Effect of cellulase concentration on the extraction yield
It is seen in Fig. 7 that the flavonoids extraction yield increased with a rise in the concentration of cellulase. When the concentration was higher than 70 mg/g, the extraction yield dropped instead of increased. This means the cellulase concentration of 70 mg/g is high enough, and a higher concentration up to 70 mg/g did not fur-ther improve the extraction yield. It may be the viscous enzyme solution with high concentrations of cellulase is not conducive to the enzymatic reaction process.
Effect of enzymatic hydrolysis time on the extraction yield
It can be seen in Fig. 8 that the extraction yield is increased with a longer time of cellulase enzymatic hydrolysis, while after 2 h, the extraction yield levelled off. Therefore it seems that the enzymatic hydrolysis reac-tion completely destroyed the cell wall of the sample and
released the maximum flavonoids composition within 2 h of incubation.
Effect of crushed mesh size on the extraction yield
As shown in Fig. 9, the crushed mesh size 0.355–0.85 mm is the optimum one to use under these conditions. It can be seen that improving the ability to crush raw materi-als will lead to an increased rate of flavonoids extraction, while high degrees of crushing will reduce the extraction yield. It might be that high degrees of grinding the raw materials will make the samples become more prone to stick into small groups and this may not be conducive to the enzymatic hydrolysis reaction and subsequent ultra-sound extraction.
Response surface methodology and results analysis
Plackett–Burman design and data analysis
Plackett–Burman design and data analysis can be seen in Tables 1 and 2. The individual factors of sonication time (A), liquid–solid ratio (B), ethanol concentration (C), pH
Fig. 6 The effect of temperatures on the extraction yield of flavo-noids
Fig. 7 The effect of concentrations of cellulase on the extraction yield of flavonoids
Fig. 8 The effect of times of enzymatic hydrolysis on the extraction yield of flavonoids
5 7 9 11 13 15 17
0.85-2.0 0.355-0.85 0.25-0.355 0.18-0.25
Extraction yield
(%)
Mesh size (mm)
(D), temperature (E), cellulase concentration (F), enzy-matic hydrolysis time (G) and extraction yield (Y) were used. As shown in Table 2, the p value of the regression model is <0.05, which indicates that the results from the model are significant. For each of the experimental fac-tors, the level of significance was C, B, D, F, A, E and G in that order. Since the ethanol concentration (C), liquid– solid ratio (B) and pH (D) have higher significant effects than the other factors, they were selected as the main optimization experimental factors for further response surface analysis.
Box–Benhnken design and data analysis
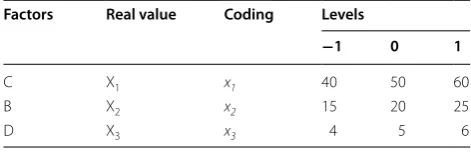
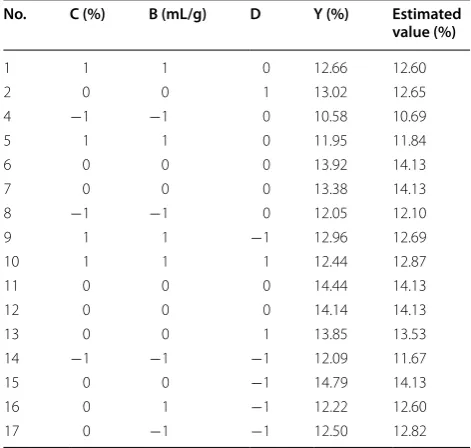
Using the basic of Plackett–Burman design, we selected the main optimization experimental factors and levels for analysis by Box–Benhnken response surface design and show the results in Table 3. Other factors levels that were used are sonication time of 60 min, a temperature of 45 °C, a cellulase concentration of 70 mg/g and an enzy-matic hydrolysis time for 2 h.
The analysis of variance for Box–Benhnken response surface design can be seen in Table 4. The regression
equation for the extraction yield of flavonoids and the relevant analysis items are shown in the formula below:
where Y is the extraction yield of flavonoids (%), X1 is the
ethanol concentration (%), X2 is the liquid–solid ratio
(mL/g) and X3 is the pH.
Y(%)= −55.90654+1.73559X1+1.73800X2
+2.97425X3−0.010872X1X2
−9.98845E−003X1X3+0.055244X2X3
−0.014268X21−0.035944X22−0.33907X23
Table 1 Scheme and experimental results of Plackett–Burman design
No. A (min) B (mL/g) C (%) D E (°C) F (mg/g) G (h) Y (%)
1 75 15 60 4 40 50 2.5 9.89
2 75 25 60 4 50 90 1.5 11.78
3 75 15 40 6 50 90 1.5 7.96
4 75 25 40 6 40 50 1.5 10.51
5 45 15 60 6 40 90 1.5 10.81
6 45 25 60 6 40 90 2.5 11.56
7 75 15 60 6 50 50 2.5 13.05
8 45 25 40 6 50 50 2.5 10.81
9 45 15 40 4 40 50 1.5 7.70
10 45 15 40 4 50 90 2.5 6.95
11 45 25 60 4 50 50 1.5 11.50
12 75 25 40 4 40 90 2.5 9.15
Table 2 Variance analysis of Plackett–Burman design
Source Sum of squares Degree of freedom Mean square F-value p value
Regression model 35.31 7 5.04 7.69 0.0335
A 0.75 1 0.75 1.14 0.3449
B 6.64 1 6.64 10.13 0.0335
C 20.03 1 20.03 30.55 0.0052
D 4.99 1 4.99 7.61 0.0509
E 0.49 1 0.49 0.75 0.4341
F 2.29 1 2.29 3.49 0.1350
G 0.11 1 0.11 0.17 0.7006
Table 3 The factor coding and levels of the Box–Benhnken design
x1 = (X1 − 50)/10; x2 = (X2 − 20)/5; x3 = (X3 − 5)/1
Factors Real value Coding Levels
−1 0 1
C X1 x1 40 50 60
B X2 x2 15 20 25
The analysis of variance of the regression model were evaluated using the corresponding F and p values, and presented in Table 5. As shown in Table 5, the F value is calculated to be 6.05 and the p value is 0.0135, which suggests that the model is statistically significant. The model’s coefficient of determination (R2) is 0.9871, which
indicates that more than 98.71 % of the response vari-ability is explained by the model. The quadratic terms X12
and X22 are significant (p < 0.05), while, the interaction
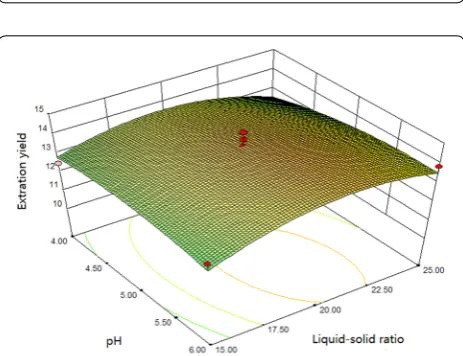
terms and linear terms are not significant (p > 0.05). This indicates that the extraction yield and relevant analysis items have obvious surface relationships, and interac-tions among each experimental factor are not significant. The lack of fit is not significant (p > 0.05), which means the regression equation may fit the actual situation. The response surface and contour plots of the ethanol con-centration, liquid–solid ratio and enzymatic hydrolysis pH are shown in Figs. 10, 11 and 12.
Results of response surface optimization and verification tests
The optimum extraction conditions via response surface optimization are as follows: the ethanol concentration, X1 = 51.14 %, the liquid–solid ratio, X2 = 20.52 mL/g, the
enzymatic hydrolysis pH, X3 = 5.303, and the estimated
optimal extraction yield is 14.20 %. The optimal experi-mental conditions were carried out on three repeated experiments to optimize and verify the reliability of the con-ditions used, and the levels of the other factors were as fol-lows: sonication time was 60 min, enzymolysis temperature was 45 °C, enzyme concentration was 70 mg/g, enzymatic hydrolysis time was 2 h and the crushed mesh number was 0.355–0.85 mm. The test results are shown in Table 6.
The results of the validation test show that the RSD of the extraction yield is less than 5 %, and the average extraction yield is 14.76 %, which is near equivalent to the maximum extraction yield of 14.79 % seen in previ-ous experiments listed in Table 4. It is concluded that this method is both effective and feasible.
Under the uniform extraction conditions of ultrasonic treatment 60 min, a liquid–solid ratio of 20.52 mL/g and
Table 4 Observed and estimated values of Box–Benhnken response surface design
No. C (%) B (mL/g) D Y (%) Estimated value (%)
1 1 1 0 12.66 12.60
2 0 0 1 13.02 12.65
4 −1 −1 0 10.58 10.69
5 1 1 0 11.95 11.84
6 0 0 0 13.92 14.13
7 0 0 0 13.38 14.13
8 −1 −1 0 12.05 12.10
9 1 1 −1 12.96 12.69
10 1 1 1 12.44 12.87
11 0 0 0 14.44 14.13
12 0 0 0 14.14 14.13
13 0 0 1 13.85 13.53
14 −1 −1 −1 12.09 11.67
15 0 0 −1 14.79 14.13
16 0 1 −1 12.22 12.60
17 0 −1 −1 12.50 12.82
Table 5 Variance analysis of regression equation for the extraction yield
* Means significant (p < 0.05)
Source Sum of squares Degree of freedom Mean square F-value p value
Regression model 16.90 9 1.88 6.05 0.0135*
X1 1.37 1 1.37 4.42 0.0737
X2 0.22 1 0.22 0.70 0.4320
X3 0.29 1 0.29 0.92 0.3693
X1X2 1.18 1 1.18 3.81 0.0920
X1X3 0.04 1 0.04 0.13 0.7305
X2X3 0.31 1 0.31 0.98 0.3544
X12 8.57 1 8.57 27.62 0.0012*
X22 3.40 1 3.40 10.95 0.0129*
X32 0.48 1 0.48 1.56 0.2519
Residual error 2.17 7 0.31
Lack of Fit 1.04 3 0.35 1.23 0.4088
Pure error 1.13 4 0.28
Total 19.08 16
an ethanol concentration of 51.14 %, the average of fla-vonoids extraction yield without enzyme assistance was 10.15 % (n = 3), while, with enzyme assistance this was increased to 14.76 % (n = 3) which is effectively a relative increase of 45.42 %.
Conclusions
In this study, a regression model of cellulase-ultrasonic assisted extraction technology for flavonoids from I. verum residues was established. Using ethanol concen-tration, liquid–solid ratio and enzymatic hydrolysis pH as the independent variables, and the extraction yield of flavonoids as the dependent variable the optimum extraction process was determined. The concentration of ethanol is 51.14 %, the liquid–solid ratio is 20.52 mL/g, the enzymatic hydrolysis pH is 5.303, the sonication time is 60 min, the enzyme solution temperature is 45 °C, the amount of added enzyme is 70 mg/g, the enzymatic hydrolysis time is 2 h and the crushed mesh size is 0.355– 0.85 mm. Under these optimum extraction conditions, the maximum flavonoids yield achieved is 14.76 %. Thus the data presented here indicate that the cellulase-ultra-sonic assisted extraction technology has the potential be used for the industrial production of flavonoids from I. verum.
Authors’ contributions
DH designed the study, analyzed the data and statistics, discussed the results and wrote the manuscript. XZ collected the plant samples, confected herbarium, performed the laboratory work, analyzed the data and drafted the paper. JS contributed to preparing the experimental materials and also performed the laboratory work. XG collected and dried the plant samples and performed the laboratory work. SW contributed to designing the study and data analysis, supervised the laboratory work, made conclusions and critically read the manuscript. All authors read and approved the final manuscript.
Author details
1 Guangxi Botanical Garden of Medicinal Plants, Nanning 530023, People’s Republic of China. 2 Guangxi Key Laboratory of Medicinal Resources Conserva-tion and Genetic Improvement, Nanning 530023, People’s Republic of China. 3 State Engineering Laboratory of Southwest Endangered Medicinal Resources Development, Nanning 530023, People’s Republic of China.
Acknowledgements
Thanks are due to Dr. Dev Sooranna for editing the English revision of the manuscript and to the China Science-technology Support Plan Project (No.2011BAI01B04) and Guangxi province Science-technology Project (No.14123001-2 and No. 15104002-3-8) for financial support.
Competing interests
The authors declare that they have no competing interests.
Received: 2 April 2016 Accepted: 6 September 2016
References
1. Miao JH, Peng Y, Xiao PG (2014) Southern and Pan-southern Medicine. China Press of Traditional Chinese Medicine, Beijing, p 10
2. Yan JH, Xiao XX, Huang KL (2002) Component analysis of volatile oil from Illicium verum Hook. f. J Cent South Univ Technol. 9(3):173–176 Fig. 10 Response surface and contour plots showing the effect of
ethanol concentration and liquid–solid ratio on the extraction yield
Fig. 11 Response surface and contour plots showing the effect of ethanol concentration and pH on the extraction yield
Fig. 12 Response surface and contour plots showing the effect of liquid–solid ratio and pH on the extraction yield
Table 6 The results of the validation test
Test no. 1 2 3 Average RSD %
3. Peng W, Lin Z, Chang J, Gu F, Zhu X (2013) Biomedical molecular charac-teristics of YBSJ extractives from Illicium verum fruit. Biotechnol Biotechnol Equip. 27(6):4311–4316
4. Wei LL, Hua RM, Li MY, Huang YZ, Li SG, He YJ, Shen ZH (2014) Chemical composition and biological activity of star anise Illicium verum extracts against maize weevil, Sitophilus zeamais adults. J Insect Sci. 14(2):80 5. Wang GW, Hu WT, Huang BK, Qin LP (2011) Illicium verum: a review on its
botany, traditional use, chemistry and pharmacology. J Ethnopharmacol 136:10–20
6. State Pharmacopoeia Committee (2015) Pharmacopoeia of the People’s Republic of China. Med Sci Technol Press, Beijing, p 4
7. Li G, Sun Z, Xia L, Shi J, Liu Y, Suo Y, You J (2010) Supercritical CO2 oil extraction from Chinese star anise seed and simultaneous compositional analysis using HPLC by fluorescence detection and online atmospheric CI-MS identification. J Sci Food Agric 90:1905–1913
8. Lee AY, Kim HS, Choi G, Moon BC, Chun JM, Kin HK (2014) Optimization of ultrasonic-assisted extraction of active compounds from the fruit of star anise by using response surface methodology. Food Anal Meth 7:1661–1670
9. Just J, Deans BJ, Olivier WJ, Paull B, Bissember AC, Smith JA (2015) New method for the rapid extraction of natural products: efficient isolation of shikimic acid from star anise. Org Lett 17:2428–2430
10. Cai M, Guo X, Liang H, Sun P (2013) Microwave-assisted extraction and antioxidant activity of star anise oil from Illicium verum Hook. f. Int J Food Sci Technol 48:2324–2330
11. Chung H-J (2009) Evaluation of the biological activity of extracts from star-anise (Illicium verum). J Food Sci Nutr. 14:195–200
12. Luna C, Chávez VHG, Barriga-Castro ED, Núñez NO, Mendoza-Reséndez R (2015) Biosynthesis of silver fine particles and particles decorated with nanoparticles using the extract of Illicium verum (star anise) seeds. Spec-trochim Acta Part A 141:43–50
13. Liu Y, Gong G, Zhang J, Jia S, Li F, Wang Y, Wu S (2014) Response surface optimization of ultrasound-assisted enzymatic extraction polysaccha-rides from Lycium barbarum. Carbohydr Polym 110:278–284 14. Wu H, Zhu J, Diao W, Wang C (2014) Ultrasound-assisted enzymatic
extraction and antioxidant activity of polysaccharides from pumpkin (Cucurbita moschata). Carbohydr Polym 113:314–324
15. Chen S, Tian J, Wang J, Wang Y, Xing L (2014) Enzymolysis-ultrasonic assisted extraction, chemical characteristics and bioactivities of polysac-charides from corn silk. Carbohydr Polym 101:332–341
16. Tabaraki R, Nateghi A (2011) Optimization of ultrasonic-assisted extrac-tion of natural antioxidants from rice bran using response surface methodology. Ultrason Sonochem 18:1279–1286
17. Lee WC, Yusof S, Hamid NSA, Baharin BS (2006) Optimizing conditions for enzymatic clarification of banana juice using response surface methodol-ogy (RSM). J Food Eng 73:55–63
18. Wang J, Chen Y, Ge X, Yu H (2007) Optimization of coagulation–floccula-tion process for a paper-recycling wastewater treatment using response surface methodology. Colloids Surf A 302:204–210
19. Fan T, Hu J, Fu L, Zhang L (2015) Optimization of enzymolysis-ultrasonic assisted extraction of polysaccharides from Momordica charabtia L. by response surface methodology. Carbohydr Polym 115:701–706 20. Wang J, Sun B, Liu Y, Zhang H (2014) Optimisation of ultrasound-assisted
enzymatic extraction of arabinoxylan from wheat bran. Food Chem 150:482–488