Optimization of process parameters for extraction of deoiled rice
bran protein and its utilization in wheat based cookies
Gurleen Singh Mann
1, Surekha Bhatia
2*, Amarjeet Kaur
3and M S Alam
2(1. Department of Biochemistry, 2. Department of Processing and Food Engineering, 3. Department of Food Science and Technology, Punjab Agricultural University, Ludhiana, Punjab, India)
Abstract: Deoiled rice bran protein was extracted using alkali extraction method. Optimization of protein extraction by alkali
extraction method was done using box-behnken design of response surface methodology (RSM). Yield and protein content of protein concentrate were found to be affected by extraction conditions viz. bran/water ratio, pH and time. The pH had most significant effect on yield of protein concentrate followed by time of extraction and bran/water ratio of extraction solvent. Optimum process variables for extraction of protein concentrate from deoiled rice bran were 0.175 bran/water ratio, 9.5 pH of solution and 45 min of extraction time which gave 8.63% yield of protein concentrate having protein content of 83.75%. Albumin (37.23%), globulin (20.27%) and glutelin (46.82%) were found to be three major fractions of deoiled rice bran protein concentrate, while prolamin (1.18%) was a minor component. Highest anti-oxidative activity was detected in albumin fractions followed by glutelin, then globulin. Deoiled rice bran protein concentrate was incorporated on cookies at 1%, 2% and 3% level by replacing the wheat flour. Cookies with 1% level of incorporation of deoiled rice bran protein concentrate were most liked by the panel of semi trained judges.
Keywords: deoiled rice bran, protein, yield, extraction conditions, cookies
Citation: Mann, G.S., S. Bhatia, A. Kaur, and M. S. Alam. 2016. Optimization of process parameters for extraction of
deoiled rice bran protein and its utilization in wheat based cookies. Agricultural Engineering International: CIGR Journal, 18(4):243-251.
1 Introduction
1Rice (Oryza sativa L.) is one of the main cereal crops, as well as staple food for most of the world’s population, especially Asian countries. The worldwide production area for rice is about 150 million ha, while the annual production is about 661 Mt (USDA 2009). It is grown in more than 100 countries and there are around 18,000 varieties of rice. Rice as harvested from the field is called paddy. In the rice milling process, first the outermost layer (the hull) is removed to produce brown rice. Milling of paddy yields 70% of rice endosperm as the major product and by-products consisting of 20% rice husk, 8% rice bran and 2% rice germ. Rice bran contains
Received date: 2016-06-24 Accepted date: 2016-10-03
*Corresponding author: Surekha Bhatia, Department of
Processing and Food Engineering, Punjab Agricultural University, Ludhiana, Punjab, India. Email: [email protected]
many micronutrients like oryzanol, tocopherol, phytosterol, 20% oil, 15% protein and 50% carbohydrate (Prasad et al. 2011).
2.5 for casein. Protein digestibility of rice bran is greater than 90%. Rice bran is considered a good source of hypoallergenic proteins and may serve as a suitable ingredient for infant food formulations (Helm and Burks, 1996). The nutritional and pharmaceutical potential of rice bran has been recognized. Recently, rice bran protein has been found to make a flavoring agent. Due to these multitudes of benefits, it is suitable to be used as functional ingredient in the food products.
At present, rice bran protein concentrates and isolates are not commercially available. This lack of availability could be due to the complex nature of proteins in rice bran and poor solubility of rice bran protein due to strong aggregation and extensive disulfide bond cross-linking (Hamada, 1999). Also rice bran contains high phytate (1.7%) and fiber content (12%) which could bind with proteins, making the protein bodies very hard to separate from other components (Juliano, 1985).
Several methods including alkaline method, enzymatic method and physical treatments have been applied to extract protein from rice bran. However, a large proportion of rice bran protein cannot be extracted by ordinary aqueous solvent because of its extensive disulfide bonds and aggregation. The most commonly used procedure for protein extraction from rice bran is an alkali hydrolysis method followed by acid precipitation. An optimized method for isolation of deoiled rice bran protein concentrate is necessary to formulate the strategies for its application in food products. As a potential food ingredient, deoiled rice bran protein was subjected to various processing conditions leading to conformational and structural changes in the proteins (Adebiyi et al., 2009). Information on the characteristics of protein concentrate extracted is also essential for development of value-added products from deoiled rice bran proteins. Therefore present investigation was undertaken to optimize the process parameters for extraction of deoiled rice bran protein concentrate and to
utilize protein concentrates in wheat based cookies preparation.
2 Material and methods
2.1 Procurement of deoiled rice bran
Deoiled rice bran used in present study was procured from solvent extraction plant located at Dhuri, Punjab, India.
2.2 Proximate analysis of deoiled rice bran
Proximate analysis of deoiled rice bran in terms of moisture content, crude protein, crude fat, ash and crude fibre were estimated by standard methods(AOAC, 2000). Protein content was estimated by using Micro-Kjeldhal method and nitrogen (%) obtained was then multiplied with a factor of 5.95 to obtain % crude protein.
2.3 Extraction of protein from deoiled rice bran
Defatted rice bran sample and distilled deionized water were mixed. pH of mixture was adjusted according to experimental design and stirred for particular time at room temperature (RT). The slurry was centrifuged at 5000 g for 30 min (RT). The pH of supernatant was adjusted to 4.5 and centrifuged again at 5000 g for 30 min. Precipitate was washed using water (pH 4.5). The residue was suspended in distilled deionized water (pH 7.0) and freeze dried overnight. The final product, which is called deoiled rice bran protein concentrate (DRBPC), was then freezing dried and stored.
2.4 Estimation of extracted protein
2.4.1 Yield of protein
Percentage yield of protein was calculated of all the deoiled rice bran samples extracted under different treatment conditions.
Yield of protein was calculated by the following Formula:
Percentage yield of protein=
Protein concentrate obtained (g)
100
Amount of deoiled rice bran (g)
2.4.2 Estimation of proteins
simultaneously with bovine serum albumin (25-250 µg/ml) as standard.
2.5 Optimization of protein extraction using response
surface methodology
2.5.1 Experimental design
For carrying out the study on optimization of extraction conditions of protein, an experimental plan was chosen from the family of three variables as suggested by Box and Behnken (1960). Using Box- Behnken design for three factors, 17 runs were planned for experimentation. The design was taken from response surface designs and it fulfills most of the requirements needed for optimization of the protein extraction conditions.
Design summary
File version 9.0.6.2
Study type Response Surface Runs 17
Design type Box-Behnken Blocks No. No blocks
Design model Quadratic Build time, ms 1.80
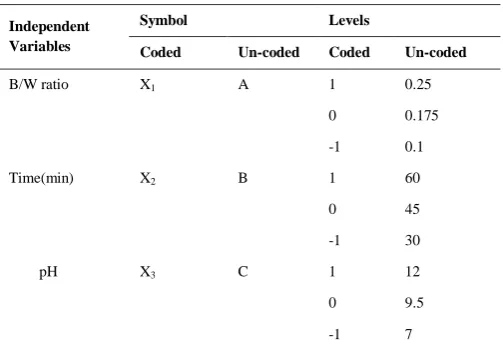
Following range of variables as bran/water ratio, time and pH were selected for experimental design: 0.1-0.25, 30-60 min extraction and pH 7-12 (Table 1) and two responses i.e. yield and % protein recorded.
Table 1 Process variables and their levels
Independent Variables
Symbol Levels
Coded Un-coded Coded Un-coded
B/W ratio X1 A 1 0.25
0 0.175
-1 0.1
Time(min) X2 B 1 60
0 45
-1 30
pH X3 C 1 12
0 9.5
-1 7
2.5.2 Optimization of process parameters
Response surface methodology was applied to the experimental data using a commercial statistical package, Design-Expert version 9.0.6 (Statease Inc., Minneapolis, USA, Trial version). The same software was used for the
generation of response surface plots, superimposition of 3-D plots and optimization of process variables. 3-D plots were generated for different interaction for any two independent variables, while holding the value of other variable as constant (at the central value). Such three-dimensional surfaces could give accurate geometrical representation and provide useful information about the behavior of the system within the experimental design (Cox and Cochran, 1964; Montgomery 2004). The optimization of the protein extraction process aimed at finding the levels of independent variables viz. bran/water ratio, extraction time and pH of solution which could give maximum possible yield and protein yield.
2.6 Isolation and characterization of protein fractions
2.6.1 Isolation of protein fractions
Sequential extraction of water soluble (WS) and salt soluble (SS) fractions from deoiled rice bran protein concentrate were carried out using 2% NaCl, followed by extraction with 70% ethanol to obtain ethanol soluble (ES) fraction. The alkaline soluble (AS) fraction was extracted from the residue by using 0.05 M NaOH. All the extracts were extensively dialyzed against water at 4oC. The WS and SS fractions were separated from the 2% NaCl extract by centrifugation after dialysis, with the supernatant and sediment collected respectively (Adebiyi and Aluko, 2011)). All protein extracts were centrifuged at 5600g for 30 min and then freeze dried separately. The protein content was then determined using the method of Lowry et al (1951).
2.6.2 Determination of anti-oxidative activity of protein fractions
Radical scavenging activity was determined by measuring the spectrophotometre changes of the ABTS radical cation, using trolox as standard (Satio et al. 2003). Antioxidant activity was expressed as mg Trolox equivalent (TE) per gram dry weight.
2.7 Preparation of cookies and their analysis
replacing the wheat flour and were compared with control sample. Proximate analysis of cookies was done as per procedure AOAC (2000).The developed cookies and muffins were sensory evaluated for appearance, color, flavor, texture and overall acceptability by a panel of semi trained judges on a nine point hedonic scale with following individual scores: liked extremely-9, liked very much-8 liked moderately-7, liked slightly-6, neither liked nor disliked-5, disliked slightly-4, disliked moderately-3, disliked very much-2, and disliked extremely-1 to find out the most suitable composition of cookies for commercialization.
3 Results and discussion
3.1 Proximate analysis of deoiled rice bran
Deoiled rice bran contained 12.1% moisture, 12.52% crude fiber and 14.92% crude protein respectively (Table 2). Total protein content (14.92%) was in the range of 10%-38% protein obtained from the other work in rice bran using various methods (Juliano, 1985; Shih et al, 1999; Parrado et al. 2006 and Ali et al. 2010). Deoiled rice bran contained 9.7% ash and 0.6% silica. Jiamyangyuen et al (2005) reported that crude fiber in deoiled rice bran was 6.03%, crude protein 13.89% and ash content was 10.13%. The difference in proximate composition might be due to the varietal difference among deoiled rice bran.
Table 2 Proximate chemical composition of deoiled
rice bran
Parameter
Raw deoiled rice bran
Moisture,% 12.1±0.10
Crude Protein,% 14.92±1.02
Crude Fibre,% 12.52±0.52
Ash,% 9.70±0.30
Silica,% 0.6±1.02
Note: Values are the mean of 3 replications+ S.E
3.2 Extraction of protein concentrate and its
optimization
3.2.1 Extraction of protein concentrate
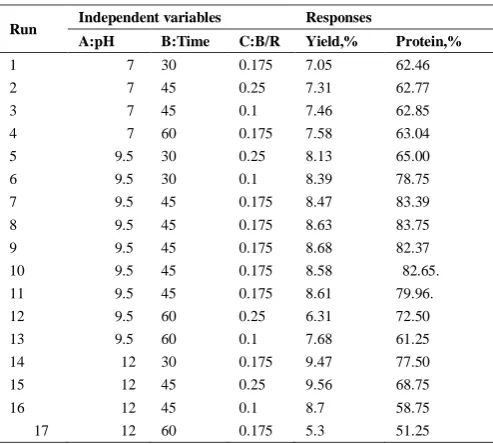
Under different experimental combinations, a wide variation in both the responses was observed i.e. 5.3% to 9.56% for yield of protein concentrate with 51.25% -83.75% protein content (Table 3). Maximum yield of protein concentrate from deoiled rice bran was obtained when extracted with bran/water ratio of 0.25 for 45 min at pH 12.0, whereas maximum protein (%) was found with bran/water ratio of 0.175, time 45 min and pH 9.5 indicating that yield and properties of protein concentrates were affected by extraction conditions (Table 3). The protein content increased linearly from pH 7 to 9.5 and then decreased at 12.0. According to Jiamyangyuen et al (2005), at high pH some non- protein nitrogen could solubilize and contribute to protein quality and quantity.
Table 3 Effect of different factors on yield and protein
conc. of protein extracted from deoiled rice bran
Run Independent variables Responses
A:pH B:Time C:B/R Yield,% Protein,%
1 7 30 0.175 7.05 62.46
2 7 45 0.25 7.31 62.77
3 7 45 0.1 7.46 62.85
4 7 60 0.175 7.58 63.04
5 9.5 30 0.25 8.13 65.00
6 9.5 30 0.1 8.39 78.75
7 9.5 45 0.175 8.47 83.39
8 9.5 45 0.175 8.63 83.75
9 9.5 45 0.175 8.68 82.37
10 9.5 45 0.175 8.58 82.65.
11 9.5 45 0.175 8.61 79.96.
12 9.5 60 0.25 6.31 72.50
13 9.5 60 0.1 7.68 61.25
14 12 30 0.175 9.47 77.50
15 12 45 0.25 9.56 68.75
16 12 45 0.1 8.7 58.75
17 12 60 0.175 5.3 51.25
A regression analysis was carried out to fit the mathematical models to the experimental data. The quadratic model obtained from regression analysis for yield % and protein content % in terms of un-coded levels of the variables was developed as follows:
Yield (%) = +8.60 +0.95 *A -0.78 * B -0.63 * C -0.92 *
Protein Conc. = +83.75 +3.30 * A -4.46 * B -1.73 * C -1.40 * AB +2.52 * AC +0.94 * BC -7.83 * A2 -7.05 * B2 -12.64 * C2
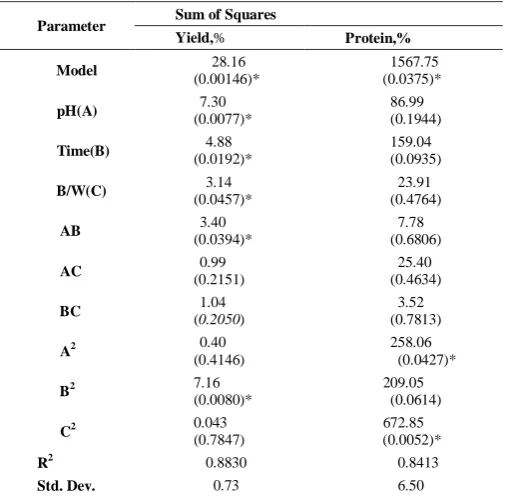
Table 4 showed the sum of square values and p-values for different responses viz. yield of protein concentrate and protein content in concentrate. Values of ‘p’ less than 0.05 indicate model terms are significant at 5% level of significance.
Table 4 ANOVA for yield and protein % of protein
concentrate extracted from deoiled rice bran
Parameter Sum of Squares
Yield,% Protein,% Model 28.16
(0.00146)*
1567.75 (0.0375)*
pH(A) 7.30
(0.0077)*
86.99 (0.1944)
Time(B) 4.88
(0.0192)*
159.04 (0.0935)
B/W(C) 3.14
(0.0457)*
23.91 (0.4764)
AB 3.40
(0.0394)*
7.78 (0.6806)
AC 0.99
(0.2151)
25.40 (0.4634)
BC 1.04
(0.2050)
3.52 (0.7813)
A2 0.40
(0.4146)
258.06 (0.0427)*
B2 7.16
(0.0080)*
209.05 (0.0614)
C2 0.043
(0.7847)
672.85 (0.0052)*
R2 0.8830 0.8413
Std. Dev. 0.73 6.50 Note: *indicate significant effect Data in parenthesis represent the p-value
3.2.2 Effect of variables on yield of protein
Figure 1 showed that the yield of extracted protein concentrate increased with the increase in time and then decreased. Yield of protein concentrate increased with increase in pH and then declined with further increase. Lysinoalanine, a possible toxic product, is identified during strong alkali extraction between pH 10-12 (De Groot and Slump, 1969) might be the reason for decreased yield at high pH. Variables ie. pH, temperature and bran/water ratio had a significant effect on yield of protein. Among all the variables least p-value found for pH. So, pH of extraction solvent witnessed most significant effect on protein concentrate yield from deoiled rice bran followed by time of extraction and
bran/water ratio as shown in Table 4. It was also significantly affected by time: pH interaction (p<0.05).
Figure 1 Effect of variables on yield of protein concentrate
3.2.3 Effect of variables on protein content of extracted protein concentrate
Design-Expert® Software Factor Coding: Actual Yield (g)
Design points above predicted value Design points below predicted value
11.7
5.3
X1 = A: pH X2 = B: Time
Actual Factor C: B/R = 0.175
30 36 42 48 54 60 7 8 9 10 11 12 5 6 7 8 9 10 11 12 Y i e l d ( g ) A: pH B: Time (min)
Design-Expert® Software Factor Coding: Actual Yield (g)
Design points above predicted value Design points below predicted value
11.7
5.3
X1 = A: pH X2 = C: B/R
Actual Factor B: Time = 45
0.1 0.13 0.16 0.19 0.22 0.25 7 8 9 10 11 12 5 6 7 8 9 10 11 12 Y i e l d ( g ) A: pH C: B/R Design-Expert® Software Factor Coding: Actual Yield (g)
Design points above predicted value Design points below predicted value
11.7
5.3
X1 = B: Time X2 = C: B/R
Actual Factor A: pH = 9.5
0.1 0.13 0.16 0.19 0.22 0.25 30 36 42 48 54 60 5 6 7 8 9 10 11 12 Y i e l d ( g )
Protein content of extracted protein concentrate first increased with increase in pH and increase in time of extraction and then declined with further increase in these variables (Figure 2). It was effected significantly by pH:pH interaction (p<0.05). pH, time and bran/water ratio had no significant effect on protein content of extracted protein concentrate (Table 4).
.
Figure 2 Effect of variables on protein of extracted protein concentrate
3.2.4 Optimization of results
The optimum process parameters obtained by computer generated response surfaces, canonical analysis and 3D- plot interpretation were: 0.175 B/W ratio, 9.5 pH of extraction solvent solution and 45 min of extraction time which gave protein concentrate yield of 8.63% and protein content 83.75 of protein concentrate. The experimental results were found to be close to optimized selected value with a variation 1.39% in yield and 0.44% protein content (Table 5). Jongjareonrak et al (2015) reported that optimized conditions for extraction of rice bran proteins were NaOH concentration 0.13 M at an extraction temperature of 41oC for 170 min where they found 43% of protein yield.
Table 5 Optimized vs experimental values of yield
and protein content of protein concentrate extracted
from deoiled rice bran
Bran/water ratio
Time,
min. pH Yield,% Protein,% Optimized 1/6 45 9.5 8.63 83.75
Experimental 1/6 45 9.5 8.75 84.12
Variation, % ---- ---- ---- 1.39 0.44
3.3 Fractionation and characterization of protein
concentrate
3.3.1 Yield of protein fractions
Table 6 shows the relative proportions of deoiled rice bran protein concentrate fractionated according to their solubility in different solvent systems. Yield is reported as gross weight and was obtained as the percentage ratio of the freeze-dried protein fraction to the original weight of protein concentrate ( Venkatachalam and Sathe, 2007). The glutelin fraction was the predominant protein fraction (46.82%) followed by albumins fraction (37.23%), globulin fraction (20.27%) and prolamin fraction (1.18%). However, Cagampang et al (1966) found albumins and globulins as a major protein of the rice bran samples. There is possibility of the yield
Design-Expert® Software Factor Coding: Actual Protein conc. (g/g)
Design points above predicted value Design points below predicted value
83.75
51.25
X1 = A: pH X2 = B: Time
Actual Factor C: B/R = 0.175
30 36 42 48 54 60 7 8 9 10 11 12 50 60 70 80 90 P r o t e i n c o n c . ( g / g ) A: pH B: Time (min)
Design-Expert® Software Factor Coding: Actual Protein conc. (g/g)
Design points above predicted value Design points below predicted value
83.75
51.25
X1 = A: pH X2 = C: B/R
Actual Factor B: Time = 45
0.1 0.13 0.16 0.19 0.22 0.25 7 8 9 10 11 12 50 60 70 80 90 P r o t e i n c o n c . ( g / g ) A: pH C: B/R Design-Expert® Software Factor Coding: Actual Protein conc. (g/g)
Design points above predicted value Design points below predicted value
83.75
51.25
X1 = A: pH X2 = C: B/R
Actual Factor B: Time = 45
being affected by the original protein precipitate preparation method. Protein content (%) in water soluble (WS) fraction had the highest value (92.45%), followed by salt soluble (SS) fraction (86.83%) and alkaline soluble (AS) fraction (83.8 %) while ethanol soluble (ES) fraction had the significantly lowest (p < 0.05) value of (76.6%). The relatively low protein content of ES fraction might be due to its low solubility in the NaOH solution that was used in the Lowry Assay method and also the presence of non-protein components such as polyphenols that might have been extracted by the alcoholic solution used during fractionation (Adebiyi and Aluko, 2011).
Table 6 Yield and protein content of deoiled protein
fractions isolated from deoiled rice bran protein
concentrate
Protein Fraction Yield/ 100 g DRBPC Protein % in fractions
WS, albumins 35.23± 1.52 92.45±3.86
SS,globulins 19.17±0.96 86.83±2.65
AS,glutelin 44.31±1.73 83.8±3.23
ES,prolamin 1.18±0.13 76.6±1.3
Note: Values are the mean of 3 replications+ S.E
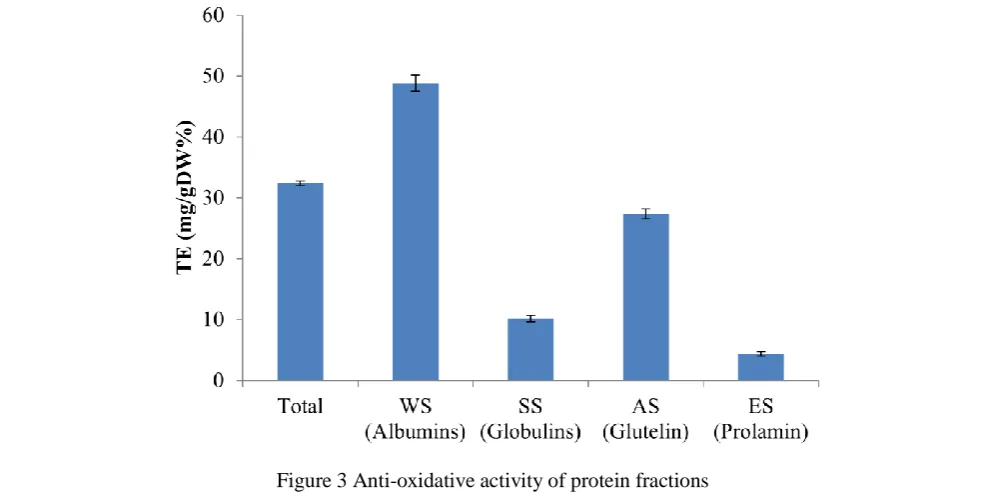
3.3.2Antioxidant activity of protein concentrates fractions Antioxidant activity of deoiled rice bran and protein fractions of deoiled rice bran protein concentrates had been shown in Figure 3. The albumin fraction had the highest antioxidant activity (48.81 mgTE/gDW) followed by glutelin fraction (27.35 mgTE/gDW), globulin fraction had antioxidant activity of 10.18 mgTE/gDW whereas lowest antioxidant activity was found in prolamin fraction i.e 4.36 mgTE/gDW. High antioxidant activity of albumin fraction might be caused by high phytic acid content. Phytic acid is reported to be natural antioxidant (Graf et al 2006) and was found in albumin fraction of deoiled rice bran protein (Adebiyi et al. 2009).
3.4. Analysis of deoiled rice bran protein concentrate
incorporated cookies
3.4.1 Proximate composition of cookies
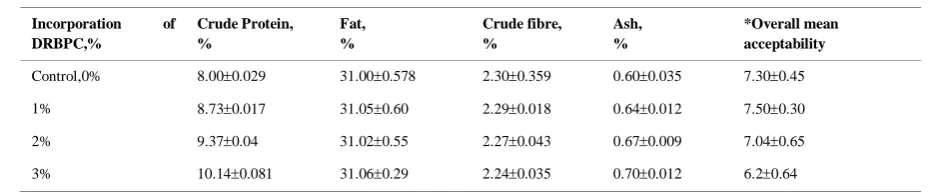
Refined flour in the cookies was substituted with deoiled rice bran protein concentrate at 1.0%, 2.0% and 3.0% level. The proximate composition of cookies at different levels of substitution of deoiled rice bran protein
concentrate is shown in Table 7. An increase in protein from (8% to 10.14%), and ash content (0.60% to 0.70%) was found in deoiled rice bran protein concentrate
substituted cookies with increase in level of substitution, whereas non-significant difference in fat content and non-significant decrease in fibre content was found in these cookies with respect to control.
3.4.2 Sensory evaluation of cookies
Sensory evaluation of cookies was done by group of semi trained panelist on a 9 point hedonic scale. The sensory evaluation revealed that cookies with deoiled rice protein concentrate (Table 7) at 1% deoiled rice bran protein concentrate were more palatable with adequate sensory characteristics.
Overall acceptability was highest for cookies developed at 1% level of substitution of flour with deoiled rice bran concentrate. Overall acceptability for cookies at 2% and 3% level of substitution of flour with deoiled rice bran concentrate was less as compared to control which might be due to unfamiliar taste of deoiled rice bran protein concentrate. Jiamyangyuen et al (2005) also found that 1% level of deoiled rice bran protein concentrate in bread was most acceptable.
So, even through high use deoiled rice bran protein concentrate in cookies is desirable in terms of chemical composition, sensory evaluation of product has restricted its use up to 1% level in order to maintain consumer acceptability of product.
4 Conclusions
Optimum process variables for extraction of protein concentrate from deoiled rice bran ratio were 0.175 bran/water ratio, 9.5 pH of solution and extraction time of 45 min where the yield of protein concentrate was 8.63%
having protein content of 83.75%. Major fractions of deoiled rice bran protein concentrate were albumin (37.23%), globulin (20.27%) and glutelin (46.82%), while prolamin (1.18%) was a minor component. Highest
antioxidative activity was detected in albumin fraction followed by glutelin, then globulin. Cookies with 1% level of incorporation of deoiled rice bran protein concentrate were most accepted.
Acknowledgement
The authors acknowledge the financial support provided by ICAR under All India Coordinated Research project on Postharvest Engineering and Technology, New Delhi, India.
References
Adebiyi, A. P., A. O. Adebiyi, Y. Hasegawa, T. Ogawa, and K Muramoto. 2009. Isolation and characterization of protein fractions from deoiled rice bran.European Food Research and Technology, 228(3):391–401.
Adebiyi, A. P., and R. E. Aluko. 2011. Functional properties of protein fractions obtained from commercial yellow field pea (Pisum sativum L) seed protein isolate. Journal of Food Chemistry,128(4):902-908.
Ali, R., F. F. Shih, and M. N. Riaz. 2010. Processing and Functionality of Rice Bran Proteins and Peptides in Bioactives Proteins and Peptides as Functional Food and Nutraceuticals.
IFT Press and Wiley-Blackwell. Chapter, 16.
AOAC (Association of official analytical chemists). 2000. Official Method of Analysis. Washington D.C.
Box, G. E., and D. W. Behnken. 1960. Some new three level designs for the study of quantitative variables. Technometrics,
2(4):455-475.
Table 7 Proximate composition and overall acceptability of cookies prepared by using deoiled rice bran
protein concentrate
Incorporation of DRBPC,%
Crude Protein, %
Fat, %
Crude fibre, %
Ash, %
*Overall mean acceptability
Control,0% 8.000.029 31.000.578 2.300.359 0.600.035 7.300.45
1% 8.730.017 31.050.60 2.290.018 0.640.012 7.500.30
2% 9.370.04 31.020.55 2.270.043 0.670.009 7.040.65
3% 10.140.081 31.060.29 2.240.035 0.700.012 6.20.64
Note: Values are the mean of 3 replications+ S.E
Chagampang, G. B., L. Z. Cruz, S. G. Espiritu, R. G. Santiago, and B. O. Juliano. 1966. Studies on the extraction and composition of rice proteins. Cereal Chemistry, 43(2)145-155.
Cox, G. M., and W. G. Cochran. 1964. Experimental designs. New York: John Wiley & Sons, Inc.
De Groot, A. P., and P. Slumps. 1969. Effect of severe alkali treatment of proteins on amino acid composition and nutritive value. Journal of Nutation, 98(98):45-56.
Graf, E., T. P. Labuza, and K. L. Empson. 2006. Phytic acid as a food antioxidant. Journal of Food Science, 56(2):560-563. Hamada, J.1999. Use of protease to enhance solubilization of rice
bran proteins. Journal of Food Biochemistry, 23(3):307-321. Helm, R. M., and A. W. Burks. 1996. Hypoallergenicity of rice
bran protein. Cereal Foods World, 41(11):839-843.
Jiamyangyuen, S., V. Srijesdaruk, and W. J. Harper. 2005. Extraction of rice bran protein concentrate and its application in bread. SongklanakarinJournal of Science and Technology,
27(1):55-64.
Jongjareonrak, A., K. Srikok, N. Leksawasdi, and C. Andreotti. 2015. Extraction and Functional Properties of Protein from De-oiled Rice Bran. Chiang Mai University Journal of Neural Sciences, 14(2):163-174.
Juliano, B.O. 1985. Rice bran. In Rice: Chemistry and Technology; American Association of Cereal Chemists: St. Paul, MN.
Lowry, O. H., N. J. Rosebrough, A. L. Farr, and R. J. Randall. 1951. Protein measurement with the Folin-phenol reagents.
Journal of Biological Chemistry, 193(1):265-275.
Montgomery, D. C. 2004. Designs and analysis of experiments. New York: John Wiley & Sons.
Parrado, J., E. Miramontes, M. Jover, J. F. Gutierrez, L. C. Teran, and J. Bautista. 2006. Preparation of a rice bran enzymatic extract with potential use as functional food. Food Chemistry,
98(4):742-748.
Prasad, M. N., K. R. Sanjay, K. M. Shravya, M. N. Vismaya, and S. S. Nanjunda. 2011. Health Benefits of Rice Bran - A Review.
Journal of Nutrition & Food Science, 1(3):108. doi:10.4172/2155-9600.1000108
Adebiyi, A. P., A. O. Adebiyi, Y. Hasegawa, T. Ogawa, and K. Muramoto. 2009. Isolation and characterization of protein fractions from de-oiled rice bran. European Food Research & Technology,228(3):391-401.
Venkatachalam, M, and S. K Sathe. 2007. Val bean (Lablab purpureus L.) proteins: composition and biochemical properties. Journal of Science, Food & Agriculture,
87(8):1539-1549
Shih, F. F., E. T.Champagne, K. Daigle, and Z. Zarins. 1999. Use of enzymes in the processing of protein products from rice bran and rice flour. Food,43(1):14-18.