S O F T W A R E
Open Access
Visual ModuleOrganizer: a graphical interface
for the detection and comparative analysis of
repeat DNA modules
Sebastien Tempel and Emmanuel Talla
*Abstract
Background: DNA repeats, such as transposable elements, minisatellites and palindromic sequences, are abundant in sequences and have been shown to have significant and functional roles in the evolution of the host genomes. In a previous study, we introduced the concept of a repeat DNA module, a flexible motif present in at least two
occurences in the sequences. This concept was embedded intoModuleOrganizer, a tool allowing the detection of repeat modules in a set of sequences. However, its implementation remains difficult for larger sequences. Results: Here we presentVisual ModuleOrganizer, a Java graphical interface that enables a new and optimized version of theModuleOrganizertool. To implement this version, it was recoded in C++ with compressed suffix tree data structures. This leads to less memory usage (at least 120-fold decrease in average) and decreases by at least four the computation time during the module detection process in large sequences.Visual ModuleOrganizerinterface allows users to easily chooseModuleOrganizerparameters and to graphically display the results. Moreover,Visual ModuleOrganizerdynamically handles graphical results through four main parameters: gene annotations, overlapping modules with known annotations, location of the module in a minimal number of sequences, and the minimal length of the modules. As a case study, the analysis of FoldBack4 sequences clearly demonstrated that our tools can be extended to comparative and evolutionary analyses of any repeat sequence elements in a set of genomic sequences. With the increasing number of sequences available in public databases, it is now possible to perform comparative analyses of repeated DNA modules in a graphic and friendly manner within a reasonable time period.
Availability: Visual ModuleOrganizerinterface and the new version of theModuleOrganizertool are freely available at: http://lcb.cnrs-mrs.fr/spip.php?rubrique313.
Keywords: Compressed suffix tree, Maximal repeats, Repeat modules, Graphical interface
Background
Repeated sequences (e.g. transposable elements, mini-satellites, ...) are present in all living organisms studied until date [1]. They are evolutionary conserved sequences and have been shown to have a significant functional importance [2]. Recent studies show the role of trans-posable elements in the evolution of host genomes [3-5], including transposable elements domestication (neogene), exaptation, and transcription regulators [1,6,7]. A number of tools has been described for the search of repeated elements in a genome. However, most of them
*Correspondence: [email protected]
Aix-Marseille Université, CNRS, LCB, UMR 7283, 13009 Marseille, France
(RepeatMasker [8], Censor [9], and ISFinder [10]) are BLAST-like tools that detect repeats (such as transposable elements) using a library of consensus sequences. Except for phylogeny analysis, there are few bioinformatic tools (VISTA [11], GATA [12], GraphDNA [13], Recon [14] and DomainOrganizer [15]) that facilitate the analysis of rela-tionships and variations between the copies of a given family of repeats [16,17].
In a previous study, we developpedModuleOrganizer that indexed all maximal repeats (MR) of sequences via a suffix tree in order to detect conserved modules within the repeated sequences [18]. Indeed, the algorithm recur-sively associates two MR if the spacer between them is smaller than the size of the largest maximal repeat and if
the edit distance between spacers of all occurrences is not greater than the size of the smallest maximal repeat. The MR association yields to the formation of modules under restrictions defined by the user such as the minimal length of the module (MinSizeModule) and the minimal number sequences (MinSequences) [18].
Although the previous version of the ModuleOrga-nizertool can efficiently detect repeated modules within sequences of smaller sizes (<100 Kbp), its implementation with larger sequences remains problematic. This is often because memory usage becomes bottleneck. Since Mod-uleOrganizer command lines are the limiting factors for its use, a graphical interface should be useful for launch-ing and analyzlaunch-ingModuleOrganizerresults. To overcome these difficulties, we propose an optimized version of the ModuleOrganizersoftware with its corresponding graph-ical interface calledVisual ModuleOrganizer.
Implementation
Since the previous algorithm was written in C language, the new version ofModuleOrganizer [18] was first com-pletely recoded in C++ which drives better memory man-agement. Then, as using a standard suffix tree [19] to compute and store all maximal repeats (MR) leads to a high memory usage during the process of ModuleOrga-nizer, a data structure based on the compressed suffix tree Välimäki [20] was applied to the new algorithm version.
Therefore, the final re-implementation of the new ver-sion contains options of the previous algorithm such as ‘search of palindromic modules’, ‘search of exact repeats’, ‘search of truncated modules’, ‘creation of a classifica-tion tree file’, ‘search in a minimal number of sequences’ and ‘association distance between MR’. In addition, new options were also developed including: the ‘-limit inte-ger’ option which stops the ModuleOrganizer run pro-cess after the detection of integer modules, and the ‘-f MinSizeMR’option that selects MR of equal or greater size thanMinSizeMRbp before the formation of the mod-ule. This option decreases theModuleOrganizerrun time but have little effects on the sensitivity/specificity of mod-ule detection (data not shown). Finally, the new option ‘-p m’prints eachmminute the approximative progress of the software.
As the input,ModuleOrganizer needs FASTA file con-taining the nucleotide sequence(s) (input-file1, manda-tory). It can also use a FASTA reference (input-file2, optional) file. This reference sequence file must contain a unique sequence. The ‘-REF input-file2’ option limits the module detection to MR present in both input and reference sequences.
ModuleOrganizer creates one mandatory output file (named ‘Module File’) that contains the list of detected modules in a tabular format as follows:
>seq1_name length_seq1
START1 END1 MODULE x nb_sequence orientation
START2 END2 MODULE y nb_sequence orientation
...
>seq2_name length_seq2
START3 END3 MODULE x nb_sequence orientation
START4 END4 MODULE y nb_sequence orientation
...
whereSTART1,START2,START3 andSTART4 (END1, END2, END3 and END4) correspond to the start (end) location of modules within the sequences.xandy repre-sent the identification number of modules.nb_sequenceis the number of sequences in which the module is present and orientation gives the orientation of the module in sequences (letter ‘d’ for the direct strand and letter ‘c’ for the reverse strand).
If the input file contains three or more sequences, Mod-uleOrganizercreates an Unweighted Pair Group Method with Arithmetic Mean (UPGMA)-based tree from the matrix of presence/absence of modules in sequences. This tree is then saved as a second output file, with ‘upgma’ extension name. The‘-MR’option writes out (in a tabular format) the list of detected MR (see Additional file 1). The option ‘-SVG’ allows the creation of an optional output file in Scalar Vector Graphics (SVG) format, a XML-based vector language that grants modifications with any Scalar Vector Graphics-enabled image processing tool.
The new ModuleOrganizer version was successfully compiled and tested on Linux 64 bits, Windows7 32/64 bits, and MacOsX 64 bits. TheVisual ModuleOrganizer interface was coded and compiled with Java version 1.6.
Results and discussion Data-processing improvements
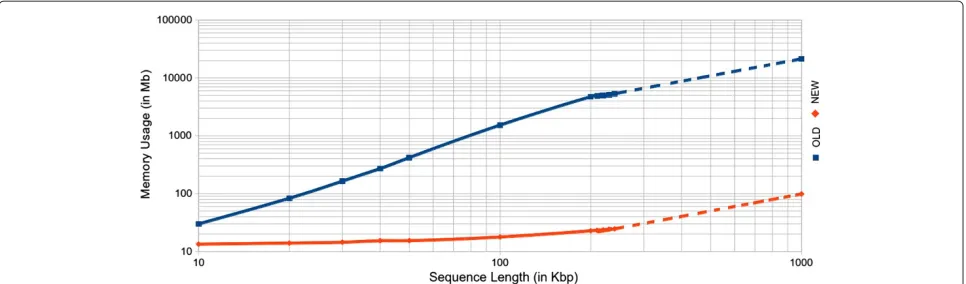
Figure 1Memory usage comparison between old and new versions of the ModuleOrganizer algorithm.The blue (red) line corresponds to the old (new) version of the algorithm. The size range of the sequences is from 10 Kbp to 1000 Kbp. Experienced and expected results are displayed with plain and dotted lines, respectively.
for a standard computer) while it should only require 98 Mb with the new version. Interestingly, a typical running process with the new version ofModuleOrganizerreduces the required memory space by at least 120 times in aver-age when compared to the old version. Moreover, the new ModuleOrganizerversion is faster than the previous one, especially for sequences greater than 200 Kbp (Additional file 2). Indeed, for a 240-Kbp sequence, the new tool is 4.8 times faster than the previous version (57 and 277 min-utes, respectively). For larger sequences (about 1 Mb), the expected running time do not exceed four hours with the new algorithm ofModuleOrganizer.
The visual ModuleOrganizer graphical interface
For an user-friendly ModuleOrganizer and results easily handle, aVisual ModuleOrganizer interface was created and divided into two main areas as described below.
The visual ModuleOrganizer tool parameters
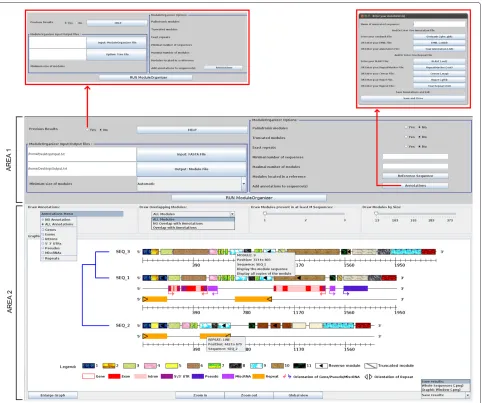
Through Visual ModuleOrganizer, ModuleOrganizer parameters (Area 1 in Figure 2) can be used in two dif-ferent ways: (i)ModuleOrganizeris launched by selecting ‘No’ on the ‘Using Previous Results’ button; or (ii) pre-vious results from ModuleOrganizer are displayed by selecting ‘Yes’ with the same button.
In the first case, the two first mandatory parameters are the ‘Input: FASTA File’ button, which selects the input file, and the ‘Output: Module File’, in whichModuleOrganizer results are written and displayed by the Visual Module-Organizerinterface. The third mandatory parameter (e.g. MinSizeModule) is the minimal size of the module, which is chosen from a list (Figure 2). Therefore, a module is detected and selected by the algorithm if its size is equal or longer thanMinSizeModule. By default (with ‘Automatic’ size),ModuleOrganizerproposes to setMinSizeModuleto the minimal value ofxsuch that it does not exists a word of sizexin the sequence(s).
In addition to the three mandatory parameters,Visual ModuleOrganizerhas the seven optional parameters. The three first parameters (‘Palindromic modules’, ‘Truncated modules’, and ‘Exact repeats’) provide binary choices and were described in the previous version [18]. Four others were computed in the new version ofModuleOrganizer. ‘Minimal number of sequences’ (e.g. MinSequences) and ‘Maximal number of modules’ (e.g. MaxModules) options require an integer valuex, and limit the detection of mod-ules in at leastxsequences and to a maximal number of modulesxin the whole set of sequences, respectively. The option ‘Module located in a reference’ refers to detected modules located in the reference sequence as well as in the mandatory ‘Input FASTA File’ sequences. The last option, labeled ‘Annotations’, opens a new frame (see upper right frame in Figure 2) that allows the user to add genomic annotations from Genbank [21], EMBL [22], AB-BLAST [23], or NCBI-AB-BLAST [24] and/or repeat annota-tions from RepeatMasker [8], Censor [9], and Repet [25] formats within the graphical interface. It is noteworthy that each annotation should be added independently for each sequence. Interestingly, the user can add its own annotation in a tabular format.
In the second case, when the button ‘Yes’ from ‘Using Previous Results’ is selected (see upper left frame in Figure 2),ModuleOrganizerparameters become invisible. They are replaced by a mandatory parameter ‘Input: Mod-uleOrganizer File’ and two optional parameters labeled ‘Option: Tree file’ from an upgma-based tree and ‘Annota-tions’ as described above. Both ‘Input: ModuleOrganizer File’ and ‘Option: Tree file’ use the result file created from a previousModuleOrganizerrun.
Figure 2Screenshoot of the Visual ModuleOrganizer graphical interface.Text legends of the module textures, genomic objects and repeat annotations are shown under the graphic display.
Graphical display and optional parameters
A graphical display of theModuleOrganizerresults is illus-trated in Figure 2 (Area 2). By default, each sequence (e.g.SEQ_3) is represented by two lines: one corresponds to a graduated ruler along the sequence (from 5’ to 3’) and the other consists of modules (boxes with different textures). Identical modules are displayed with the same texture to facilitate intra- and inter-sequence compar-isons. A reverse module is indicated by a black triangle (e.g.module 9 in SEQ_3) while a truncated module (e.g. module 3 in SEQ_3) is shown by a dark grey diagonal line within the texture. When an user clicks on a graphical ele-ment, a menu with the detailed information (nature of the genetic object and its location) is displayed (e.g.a detailed information is shown for a repeat on SEQ_2 in Figure 2). Similar pop-up menu (e.g.module 9 in SEQ_3) allows the
user to display the nucleotide sequence of a particular or all copies of repeated modules (with their co-ordinates along each sequence), which can be useful for further analysis. It is noteworthy that the sequence order is based on upgma-based tree (by default) instead of alphabetical name order.
two and one additional lines, in the context of ‘ALL annotations’ item). The genomic annotations include six different items: ‘Genes’, ‘Exons’, ‘Introns’, ‘5’ ‘3’ UTRs’, ‘Pseudos’ (pseudogenes), ‘MiscRNAs’; that can be selected independently. Their orientations are shown by an arrow shape while repeat annotation orientations are indicated by a black triangle. The ‘NO Annotation’ item removes all annotations.
The ‘Draw Overlapping Modules’ menu displays or removes detected modules based on their overlap or not with visible annotations (genomic or repeat). ‘All Modules’ item draws modules wherever the annotations (Figure 2, Area 2), while ‘Overlap with Annotations’ and ‘NO Over-lap with Annotations’ (see Additional file 4), respectively draws and removes the modules that overlap the annota-tion posiannota-tions.
‘Draw Modules present in at least M Sequences’ and ‘Draw Modules by Size’ sliders display modules located within a minimal number of sequences and with a min-imal length, respectively. Minimun and maximum val-ues of the two sliders are automatically taken from the ModuleOrganizerprocess with the ‘M Sequences’ ranges from 1 to total number of sequences and the ‘Size’ ranges from minimal and maximal length of the detected modules.
Under the graph, four buttons facilitate the modification of the graphical view: ‘Zoom in’ and ‘Zoom out’ but-tons increase and decrease by a factor 2 the graph width, respectively. ‘Global view’ button adjusts the graph width (including the graph elements) according to the largest sequence. The last button, labeled ‘Enlarge Graph’, (or ‘Reduce Graph’ after a click on it) removes the parameter area (Figure 2, Area 1) (or displays it) from the interface.
Finally, the ‘Save results’ combo-list saves the graph (whole graph or viewed graph in a PNG format) for exter-nal use. All graphical options can be changed and associ-ated at any moment and the graph dynamically displays the elements based on the user choices. Detailed informa-tion about parameters and graphical opinforma-tions are available through the ‘HELP’ button (Additional file 3).
A case study: the FoldBack4 transposable element family of Drosophila melanogaster
FoldBack elements are a family of transposable elements described in Drosophila melanogaster. Structurally, the members of this dispersed repetitive family have long inverted terminal repeats and a central loop between the repeats. The lengths of these repeats and loops vary from element to element [26,27]. The inverted repeats of all the family members are homologous [27] and carry a peculiar organization of sequences with highly conserved complex sequences at the termini [28]. Several families of Fold-Back, including the FoldBack4 (FB4) family, are known to be non-autonomous transposable elements [26,27].
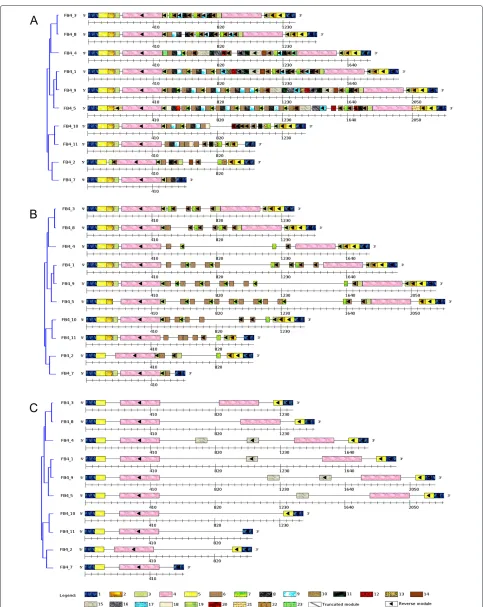
For this study, 10 FB4 sequence elements ranging from 627 to 2266 bp were chosen. These elements are gen-erally highly variable in their internal sequence, includ-ing numerous insertions, deletions, and repetitions, but share consensus palindromic extremities in all their copies because they are necessary for the transposition [28]. With aMinSizeModulesettled to 25 bp, ‘Palindromic modules’ and ‘Truncated modules’ options selected, the Module-Organizeralgorithm discovered 23 modules (Figure 3A). Palindromic structures of the FB4 sequences are described by modules 1-5 that should correspond to Terminal Inverted Repeat (TIR). Internal sequences are mainly composed of the modules 8-10 which are repeated in tan-dem, looking like minisatellites. Those are often present in the internal sequence of non-autonomous transpos-able elements [1,28]. According to the module composi-tion, the upgma-based tree clusters the FB4 sequences in 4 distinct groups: Group1 = FB4_3, FB4_8, and FB4_4; Group2 = FB4_1, FB4_9, and FB4_5; Group 3 = FB4_10 and FB4_11; Group4 = FB4_2 and FB4_7, allowing inter-and intra-groups comparison of the detected modules. Indeed, the reverse occurrence of modules 3 and 4 were deleted in FB4_2 and FB4_7 (from Group4) and reverse modules 2-5 were absent in FB4_10 and FB4_11 (from Group3). These findings clearly suggest that partial dele-tions of these palindromic structures would impair the transposition of these FB4 sequences.
Through the Visual ModuleOrganizer interface, the ‘Draw Modules present in at least M Sequences’ slider was settled to 9, allowing only the display of modules present in at least nine of the ten FB4 sequences. As a result, the palindromic modules (module 1 to 5) and the module 9 from the internal sequence are still displayed (Figure 3B), indicating that those palindromic modules are evolu-tionary conserved within the FB4 family and might be essential for the transposition. This observation also puts forward that the ‘Draw Modules present in at least M Sequences’ option can be useful for comparative analysis (insertions, deletions, repetitions, rearrangements, ...) of modules in a given set of a sequence family. In a similar way, when the ‘Draw Modules by Size’ slider is set to 58 (e.gthe displayed modules are equal or longer than 58 bp), only modules 1, 4, 5 and 15 are displayed in Figure 3C, therefore allowing the identification of large conserved modules.
graphical tools fail to retrieve a good organization of the non-autonomous elements for a typical family such as FB4 [18]. Therefore,ModuleOrganizer remains the sole algorithm that is able to identify distinct structural repeats such as duplicated, palindromic and truncated modules, allowing the user to infer putative functional role of these modules.
Conclusion
We have described Visual ModuleOrganizer, a novel graphical interface with a new optimized implementa-tion of the ModuleOrganizer tool. The key features of these tools are: (1) detection of modules within larger sequences and with efficient low memory usage; (2) user-friendly handling ofModuleOrganizer thanks to a graph-ical interface; and (3) dynamic graphgraph-ical parameters that tune the visualization of the results based on the user needs. In addition,Visual ModuleOrganizer will be use-ful to investigate evolutionary and comparative analysis (modules insertions, deletions, rearrangements, ...) from all type of DNA repeats (transposable elements, CRISPR, minisatellites, ...).ModuleOrganizerremains applicable in principle to any set of nucleic sequences sharing some similarities and for which a multiple alignment fails to correctly retrieve the architecture of conserved blocks in the sequences. With the increasing number of sequence data available in biological databases, these features in theVisual ModuleOrganizerinterface clearly provide new opportunities for inter- and intra-sequence comparative analysis of repeat DNA modules in an easy, user-friendly manner within a reasonable time.
Additional files
Additional file 1: Example maximal repeat (MR) output file in a tabular format.Each file shows six columns: the maximal repeat word, the identification number in the suffix tree, the MR size, the occurrence number, the number of sequences where the MR is present and the list of start positions.
Additional file 2: Run time comparison between old and new versions of ModuleOrganizer.The blue (red) line represents running time process observed with old (new) version ofModuleOrganizer. The size range of the sequences is from 10 Kbp to 1000 Kbp. Experienced and expected results are displayed with plain and dotted lines, respectively.
Additional file 3: Screenshoot of the HELP interface.
Additional file 4: Module display when the ‘NO Overlap with Annotations’ item is selected.Some modules (e.g. Module 1 and 2) became invisible when the ‘NO Overlap with Annotations’ item is selected.
Abbreviations
CRISPR: Clustered regularly interspaced short palindromic repeats; FB4: FoldBack4; MR: Maximal repeats; RAM: Random access memory; SVG: Scalar vector graphics; UPGMA: Unweighted pair group method with arithmetic mean.
Competing interests
The authors declare that they have no competing interests.
Authors’ contributions
ST and ET conceived the study, analyzed the results and wrote the paper. ST performed the computational implementations. All the authors read and approved the final manuscript.
Acknowledgements
We thank our sources of funding (Aix-Marseille Université and CNRS).
Received: 16 December 2013 Accepted: 25 February 2014 Published: 28 March 2014
References
1. Bigot Y:Mobile genetic elements, protocols and genomic applications; 2012. ISBN:978-1-61779-602-9.
2. Romanish MT, Nakamura H, Lai CB, Wang Y, Mager DL:A novel protein isoform of the multicopy human naip gene derives from intragenic alu sine promoters.PLoS One2009,4:5761.
3. Joly-Lopez Z, Forczek E, Hoen DR, N J, Bureau TE:A gene family derived from transposable elements during early angiosperm evolution has reproductive fitness benefits in arabidopsis thaliana.PLoS Genet 2012,8:1002931.
4. Li Y, Li C, J X, Jin Y:Domestication of transposable elements into microrna genes in plants.PLoS One2011,6:19212.
5. Siddique A, Buisine N, Chalmers R:The transposon-like correia elements encode numerous strong promoters and provide a potential new mechanism for phase variation in the meningococcus.PLoS Genet2011,7:1001277.
6. Hayward A, Ghazal A, Andersson G, Andersson L, Jern P:Zbed evolution: repeated utilization of dna transposons as regulators of diverse host functions.PLoS One2013,8(3):59940.
7. Rebollo R, Farivar S, Mager DL:C-gate - catalogue of genes affected by transposable elements.Mob DNA2012,3(1):9.
8. Smit AFA, Hubley R, Green P:RepeatMasker Open-3.0.http://www. repeatmasker.org
9. Pavlicek A, Kohany O, Jurka J:Repeat Mining: Basic Tools for Detection and Analysis.InAnalytical Tools for DNA, Genes and Genomes Nuts and Bolts. Edited by Markoff A. Eagleville: DNA Press; 2005.
10. Siguier P, Perochon J, Lestrade L, Mahillon J, Chandler M:Isfinder: the reference centre for bacterial insertion sequences.Nucleic Acids Res 2006,34(1):32–36.
11. Dubchak I, Poliakov A, Kislyuk A, Brudno M:Multiple whole-genome alignments without a reference organism.Genome Res2009,
19(4):682–9.
12. Nix DA, Eisen MB:Gata: a graphic alignment tool for comparative sequence analysis.BMC Bioinformatics2005,6:9.
13. Thomas JM, Horspool D, Brown B, Tcherepanov V, Upton C:Graphdna: a java program for graphical display of dna composition analyses.
BMC Bioinformatics2007,8:21.
14. Bao Z, Eddy SR:Automated de novo identification of repeat sequence families in sequenced genomes.Genome Res2002,12:1269–1276. 15. Tempel S, Giraud M, Lavenier D, Lerman IC, Valin AS, CouéeI, Amrani AE,
Nicolas J:Domain organization within repeated dna sequences: application to the study of a family of transposable elements.
Bioinformatics2006,22:1948–54.
16. Böhne B, Zhou Q, Darras D, Schmidt C, Schartl M, Galiana-Arnoux D, Volff JN:Zisupton-a novel superfamily of dna transposable elements recently active in fish.Mol Biol Evol2012,29(2):631–45.
17. Marzo M, Bello X, Puig MXM, Ruiz A:Striking structural dynamism and nucleotide sequence variation of the transposon galileo in the genome of drosophila mojavensis.Mob DNA2013,4(1):6. 18. Tempel S, Rousseau C, Tahi F, Nicolas J:Moduleorganizerdetecting
modules in families of transposable elements.BMC Bioinformatics 2010,11:474.
19. Gusfield D:Algorithms on Strings, Trees and Sequences: Computer Science and Computational Biology: Cambridge University Press; 1997. ISBN 0-521-58519-8.
20. Välimäki W, Gerlach N abd, Dixit K, Mäkinen V:Compressed suffix tree-a basis for genome-scale sequence analysis.Bioinformatics2010,
23:629–630.
22. Kulikova T, Akhtar R, Aldebert P, Althorpe Nea:Embl nucleotide sequence database in 2006.Nucleic Acids Res2007,35(1):16–20. 23. Gish W:AB-BLAST.http://blast.advbiocomp.com
24. Johnson M, Zaretskaya I, Raytselis Y, Merezhuk Y, McGinnis S, Madden TL:
Ncbi blast: a better web interface.Nucleic Acids Res2008,36:5–9. 25. Flutre T, Duprat E, Feuillet C, Quesneville H:Considering transposable
element diversification in de novo annotation approaches.PLoS ONE 2011,6(1):16526.
26. Brierley H, Potter S:Distinct characteristics of loop sequences of two drosophila foldback transposable elements.Nucleic Acids Res1985,
13(2):485–500.
27. Silber J, Bazin C, Lemeunier F, Aulard S, Volovitch M:Distribution and conservation of the foldback transposable element in drosophila.
J Mol Evol1989,28(3):220–4.
28. Potter SS:Dna sequence of a foldback transposable element in drosophilia.Nature1982,297:201–204.
doi:10.1186/1759-8753-5-9
Cite this article as:Tempel and Talla:Visual ModuleOrganizer: a graphical interface for the detection and comparative analysis of repeat DNA modules.Mobile DNA20145:9.
Submit your next manuscript to BioMed Central and take full advantage of:
• Convenient online submission
• Thorough peer review
• No space constraints or color figure charges
• Immediate publication on acceptance
• Inclusion in PubMed, CAS, Scopus and Google Scholar
• Research which is freely available for redistribution