Gene Microarray Cancer Classification using Correlation
Based Feature Selection Algorithm and Rules Classifiers
https://doi.org/10.3991/ijoe.v15i08.10617
Mohammad Al-Batah, Belal Zaqaibeh (*), Saleh Ali Alomari, Mowafaq Salem Alzboon
Faculty of Science and Information Technology, Jadara University, Jordan
Abstract—Gene microarray classification problems are considered a chal-lenge task since the datasets contain few number of samples with high number of genes (features). The genes subset selection in microarray data play an im-portant role for minimizing the computational load and solving classification problems. In this paper, the Correlation-based Feature Selection (CFS) algo-rithm is utilized in the feature selection process to reduce the dimensionality of data and finding a set of discriminatory genes. Then, the Decision Table, JRip, and OneR are employed for classification process. The proposed approach of gene selection and classification is tested on 11 microarray datasets and the per-formances of the filtered datasets are compared with the original datasets. The experimental results showed that CFS can effectively screen irrelevant, redun-dant, and noisy features. In addition, the results for all datasets proved that the proposed approach with a small number of genes can achieve high prediction accuracy and fast computational speed. Considering the average accuracy for all the analysis of microarray data, the JRip achieved the best result as compared to Decision Table, and OneR classifier. The proposed approach has a remarkable impact on the classification accuracy especially when the data is complicated with multiple classes and high number of genes.
Keywords—Feature selection, gene expression data, Correlation-based Feature Selection algorithm, Decision Table, JRip, and OneR.
1
Introduction
the classifier by minimizing redundancy, removing noisy data and maximizing the relevance [8]. The relevance and the redundancy level of a gene are often measured by correlation coefficients such as: Symmetrical Uncertainty [13], Mutual Information (MI) [32], Pearson’s correlation [6][28].
Problems in high-dimensional data analysis have motivated the researchers to search for possible solutions and propose viable algorithms [14]. Alternatively, differ-ent meta-heuristic algorithms have been adapted for feature selection issues [19][29]. Examples of these algorithms are Principle Component Analysis [34], Genetic Algo-rithm [3], Ant Colony Optimization [9], Simulated Annealing [16] and Particle Swarm Optimization [5][33].
Correlation-based Feature Selection (CFS) is a simple filter algorithm that ranks feature subsets according to a correlation-based heuristic evaluation function [38]. CFS is one of the most well-known feature selection algorithms that take advantage of a redundancy filter. The CFS evaluates subsets of features using the hypothesis "Good feature subset contain features that are highly correlated with the classification and yet uncorrelated to each other" [39].
CFS evaluates the worth of a subset of attributes by considering the individual pre-dictive ability of each feature along with the degree of redundancy between them [19]. Correlation coefficients is used to estimate correlation between subset of attributes and class, as well as inter-correlations between the features. Relevance of a group of features grows with the correlation between features and classes, and decreases with growing inter-correlation. CFS is used to determine the best feature subset and is usually combined with search strategies such as forward selection, backward elimina-tion, bi-directional search, best-first search and genetic search. In this paper, Greedy Stepwise is used as search method with CFS algorithm.
2
Background
Nowadays, various kinds of machine learning and statistical approaches are used to classify tumour cells accurate such as support vector machines [15], k-nearest neigh-bor [30], and neural network techniques [24]. Also, several researchers thus hybridize the classification techniques with optimization algorithms for further enhancement of accuracy [1][22].
Two-phase hybrid model is suggested in [23] for cancer classification, integrating Correlation-based Feature Selection (CFS) with improved-Binary Particle Swarm Optimization (iBPSO) using Naive-Bayes classifier as the only classifier.
The Pearson’s Correlation Coefficient (PCC) [18] is used in combination with Bi-nary Particle Swarm Optimization (BPSO) or Genetic Algorithm (GA) along with various classifiers for the selection and classification of high dimensional microarray data. It was noticed that the PCC filter showed a remarkable improvement in the clas-sification accuracy when it was combined with BPSO or GA. Also, the results show that the BPSO is working faster and has better performance than GA.
Pavicd algorithm works on the space of feature values instead of the features’ space. Experiments show that Pavicd gets the best performance in terms of running time and classification accuracy when using Ripper-k and C4.5 as classifiers.
A Collaborative Representation (CR)-based classification with regularized least square was developed [31] to classify gene data. The CR codes a testing sample as a sparse linear combination of all training samples and then classifies the testing sample by evaluating which class leads to the minimum representation error. Experiments results on several diseases show that the CR-based algorithm achieves high classification accuracy and fast computational speed than the traditional classifiers, such as support vector machine algorithm.
The K-Nearest Neighbor (K-NN) classifier and feature selection using ANOVA test was developed based on MapReduce programming model [26]. The approach works in a distributed manner on scalable clusters. The algorithms are successfully implemented on Hadoop framework and comparative analysis is done using various microarray datasets.
A multi-test decision tree (MTDT) was applied for solving biological problems [10]. The application of several univariate tests in each non-terminal node of the decision tree is considered. Comparison results with eight classifiers show that MTDT has a statistically significantly higher accuracy than popular decision tree classifiers, and it was highly competitive with ensemble learning algorithms.
Moreover, the Support Vector Machine (SVM) classifier was applied on four microarray datasets [2]. The study analyzed two different kernels of SVM; radial kernel and linear kernels. The results showed that the SVM exceeded the performance and accuracy compared to K-nearest neighbor (KNN) and neural network (NN).
3
The Proposed Work
In this paper, 11 different high dimensional datasets are applied. The Correlation-based Feature Selection (CFS) with Greedy Stepwise search method is proposed for genes selection. Also, multiple classifiers are utilized to show the quality of each of them.
3.1 Datasets
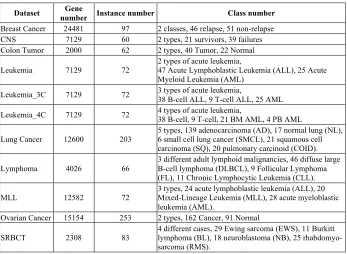
Table 1. Gene microarray datasets
Dataset number Instance number Gene Class number Breast Cancer 24481 97 2 classes, 46 relapse, 51 non-relapse CNS 7129 60 2 types, 21 survivors, 39 failures Colon Tumor 2000 62 2 types, 40 Tumor, 22 Normal
Leukemia 7129 72 2 types of acute leukemia, 47 Acute Lymphoblastic Leukemia (ALL), 25 Acute Myeloid Leukemia (AML)
Leukemia_3C 7129 72 3 types of acute leukemia, 38 B-cell ALL, 9 T-cell ALL, 25 AML
Leukemia_4C 7129 72 4 types of acute leukemia, 38 B-cell, 9 T-cell, 21 BM AML, 4 PB AML
Lung Cancer 12600 203 5 types, 139 adenocarcinoma (AD), 17 normal lung (NL), 6 small cell lung cancer (SMCL), 21 squamous cell carcinoma (SQ), 20 pulmonary carcinoid (COID).
Lymphoma 4026 66 3 different adult lymphoid malignancies, 46 diffuse large B-cell lymphoma (DLBCL), 9 Follicular Lymphoma (FL), 11 Chronic Lymphocytic Leukemia (CLL).
MLL 12582 72 3 types, 24 acute lymphoblastic leukemia (ALL), 20 Mixed-Lineage Leukemia (MLL), 28 acute myeloblastic leukemia (AML).
Ovarian Cancer 15154 253 2 types, 162 Cancer, 91 Normal
SRBCT 2308 83 4 different cases, 29 Ewing sarcoma (EWS), 11 Burkitt lymphoma (BL), 18 neuroblastoma (NB), 25 rhabdomyo-sarcoma (RMS).
These datasets are related to studies of human cancer, including Breast Cancer, Central Nervous System (CNS), Colon Tumor, Leukemia, Leukemia_3C, Leuke-mia_4C, Lung Cancer, Lymphoma, Mixed Lineage Leukemia (MLL), Ovarian Can-cer, and Small Round Blue-Cell Tumor (SRBCT).
3.2 Correlation based feature selection algorithm
A common procedure for choosing the foremost applicable characteristics within the dataset is to use correlation. Correlation is additional strictly remarked as Pear-son’s coefficient of correlation in statistics. We are able to compute the correlation among every characteristic and also the output variable and choose solely those char-acteristics that have a moderate-to-high positive or correlational statistics (close to -1 or 1) and drop those characteristics with a coffee correlation (value near zero).
Correlation-based feature selection (CFS) ranks characteristics in keeping with a heuristic analysis operate supported correlations [17]. The operate gauges subsets product of characteristic vectors, that are correlative with the category label, however freelance of every alternative.
3.3 Classification model
In this paper, three classifiers are applied; Decision Table, JRip, and OneR. The choice of various classifiers is due to the fact that there is no any specific classifier to work perfectly for all datasets and not all classifiers work in the same way on a da-taset.
• Decision Table constructs a decision table majority classifier [25]. It evaluates feature subsets using best-first search and can use cross-validation for evaluation. • JRip implements RIPPER, including heuristic global optimization of the rule set
[35].
• OneR is the 1R classifier with one parameter: the minimum bucket size for dis-cretization [20].
4
Experimental Design and Results Discussion
Initially, the Decision Table, JRip, and OneR classifiers were applied on the origi-nal datasets. Then, the all eleven datasets were filtered using Correlation-based Fea-ture Selection (CFS) algorithm. After that, the filtered datasets were tested against the applied classifiers. This was done in order to compare the classification accuracy of the dataset with the one before filtration. In each dataset, experiment was performed in full training method and 2-folds to 10-folds cross validation.
The features of the datasets were filtered and the number of selected genes using CFS is tabulated in Table 2. From the results, we can notice that CFS has selected fewer number of genes compared to that of original dataset. The results show that the number of selected genes for Breast Cancer is reduced from 24481 to 138, CNS from 7129 to 39, Colon Tumor from 2000 to 26, Leukemia from 7129 to 79, Leukemia_3C from 7129 to 104, Leukemia_4C from 7129 to 119, Lung Cancer from 12600 to 548, Lymphoma from 4026 to 175, MLL from 12582 to 142, Ovarian Cancer from 15154 to 35, and SRBCT from 2308 to 112 genes.
Table 2. Number of selected genes before/after applying CFS algorithm Dataset #Total Genes #Gene After CFS
Breast Cancer 24481 138
CNS 7129 39
Colon Tumor 2000 26
Leukaemia 7129 79
Leukaemia-3C 7129 104
Leukaemia-4C 7129 119
Lung Cancer 12600 548
Lymphoma 4026 175
MLL 12582 142
Ovarian Cancer 15154 35
The accuracy of the classifiers applied on the original and filtered datasets was evaluated as shown in Table 3. Results in bold indicate the best performed classifier for each specific dataset. The results show that generally the accuracy of the classifi-ers on the filtered dataset performed better results when compared with those applied directly on the original datasets. However, there are some cases with few classifiers in which the accuracy on the original dataset is same as filtered dataset.
In addition, the results show that the Decision Table and Jrip are the best classifiers for the datasets, while the OneR is the worst classifier. The Breast Cancer had the highest accuracy of 88.7% with Jrip, CNS (90.0% with Decision Table), Colon (96.8% with Decision Table and Jrip), Leukemia (98.6% with Decision Table), Leu-kemia_3C (100.0% with Decision Table), Leukemia_4C (98.6% with Decision Table and JRip), Lung (97.5% with JRip), Lymphoma (100.0% with JRip), MLL (95.8% with JRip), Ovarian (100.0% with Decision Table), and SRBCT (97.6% with JRip).
Table 3. Accuracy for the original and filtered microarray datasets
Datasets Classifier Train Full Fold 2- Fold 3- Fold 4- Fold 5- Fold 6- Fold 7- Fold 8- Fold 9- Fold 10- Aver-age
Breast Can-cer
Decision Table 79.4 64.9 50.5 57.7 64.9 50.5 63.9 60.8 55.7 61.9 61.0 Decision
Table-CFS 85.6 68.0 66.0 59.8 75.3 73.2 67.0 62.9 72.2 67.0 69.7 JRip 84.5 58.8 53.6 57.7 56.7 49.5 54.6 59.8 56.7 66.0 59.8 Jrip-CFS 88.7 62.9 73.2 59.8 68.0 70.1 71.1 69.1 59.8 68.0 69.1 OneR 82.5 55.7 46.4 45.4 49.5 52.6 54.6 51.5 42.3 56.7 53.7 OneR-CFS 81.4 58.8 53.6 59.8 54.6 53.6 61.9 54.6 58.8 57.7 59.5
CNS
Decision Table 90.0 63.3 56.7 56.7 56.7 51.7 63.3 60.0 56.7 75.0 63.0 Decision
Table-CFS 90.0 63.3 71.7 71.7 73.3 66.7 81.7 68.3 70.0 76.7 73.3 JRip 75.0 61.7 68.3 40.0 68.3 51.7 56.7 60.0 60.0 58.3 60.0 Jrip-CFS 88.3 71.7 80.0 63.3 68.3 70.0 68.3 71.7 68.3 65.0 71.5 OneR 88.3 60.0 55.0 55.0 48.3 48.3 56.7 65.0 53.3 48.3 57.8 OneR-CFS 83.3 53.3 76.7 63.3 70.0 58.3 66.7 65.0 58.3 65.0 66.0
Colon
Decision Table 96.8 62.9 72.6 71.0 69.4 72.6 75.8 72.6 72.6 77.4 74.4 Decision
Table-CFS 96.8 67.7 85.5 80.6 80.6 80.6 83.9 80.6 88.7 83.9 82.9 JRip 85.5 71.0 75.8 75.8 67.7 75.8 74.2 72.6 69.4 75.8 74.4 Jrip-CFS 96.8 88.7 74.2 82.3 80.6 72.6 82.3 87.1 82.3 77.4 82.4 OneR 88.7 51.6 75.8 74.2 71.0 66.1 79.0 71.0 62.9 69.4 71.0 OneR-CFS 88.7 64.5 77.4 82.3 79.0 77.4 79.0 71.0 77.4 74.2 77.1
Leukemia
Decision Table 98.6 76.4 88.9 80.6 90.3 83.3 81.9 81.9 84.7 83.3 85.0 Decision
Table-CFS 98.6 76.4 90.3 81.9 91.7 83.3 87.5 83.3 86.1 88.9 86.8 JRip 95.8 76.4 87.5 80.6 91.7 83.3 84.7 84.7 87.5 87.5 86.0 Jrip-CFS 95.8 76.4 90.3 84.7 95.8 83.3 90.3 84.7 87.5 91.7 88.1 OneR 95.8 76.4 87.5 84.7 87.5 90.3 80.6 79.2 86.1 81.9 85.0 OneR-CFS 95.8 76.4 87.5 84.7 87.5 90.3 80.6 77.8 86.1 83.3 85.0
Leuke-mia_3C
Decision Table 100.0 72.2 69.4 76.4 81.9 90.3 70.8 86.1 84.7 84.7 81.7 Decision
Datasets Classifier Train Full Fold 2- Fold 3- Fold 4- Fold 5- Fold 6- Fold 7- Fold 8- Fold 9- Fold 10- Aver-age Jrip-CFS 98.6 79.2 83.3 83.3 91.7 91.7 94.4 94.4 94.4 94.4 90.6 OneR 86.1 58.3 77.8 69.4 70.8 75.0 69.4 68.1 72.2 69.4 71.7 OneR-CFS 86.1 80.6 77.8 73.6 72.2 75.0 69.4 68.1 72.2 69.4 74.4
Leukemia-_4C
Decision Table 98.6 52.8 66.7 69.4 83.3 75.0 76.4 73.6 79.2 77.8 75.3 Decision
Table-CFS 98.6 75.0 72.2 76.4 87.5 81.9 77.8 79.2 80.6 79.2 80.8 JRip 97.2 55.6 80.6 81.9 81.9 86.1 83.3 83.3 75.0 84.7 81.0 Jrip-CFS 98.6 72.2 83.3 87.5 80.6 83.3 87.5 90.3 79.2 90.3 85.3 OneR 83.3 63.9 70.8 70.8 77.8 72.2 69.4 68.1 76.4 76.4 72.9 OneR-CFS 83.3 65.3 70.8 70.8 77.8 72.2 69.4 68.1 76.4 76.4 73.1
Lung
Decision Table 94.1 77.3 82.3 83.7 81.8 85.2 79.8 84.2 84.2 84.2 83.7 Decision
Table-CFS 95.6 80.8 87.2 81.8 85.7 89.2 87.7 87.2 85.2 84.2 86.5 JRip 97.5 83.3 85.7 88.7 91.6 88.7 87.2 86.2 84.2 89.7 88.3 Jrip-CFS 97.5 87.7 92.1 92.1 92.1 92.1 92.1 89.2 88.2 92.6 91.6 OneR 81.8 77.3 72.9 76.4 73.4 72.9 74.4 73.4 73.9 76.8 75.3 OneR-CFS 81.8 77.3 74.9 77.3 74.9 73.4 76.8 73.4 73.9 76.8 76.1
Lymphoma
Decision Table 98.5 89.4 80.3 83.3 81.8 78.8 87.9 75.8 83.3 77.3 83.6 Decision
Table-CFS 98.5 89.4 84.8 83.3 84.8 80.3 90.9 80.3 83.3 78.8 85.5 JRip 100.0 74.2 72.7 81.8 80.3 86.4 90.9 90.9 89.4 93.9 86.1 Jrip-CFS 100.0 71.2 93.9 95.5 95.5 93.9 97.0 98.5 98.5 93.9 93.8 OneR 97.0 74.2 86.4 84.8 77.3 80.3 83.3 78.8 81.8 81.8 82.6 OneR-CFS 97.0 83.3 86.4 84.8 87.9 80.3 83.3 78.8 81.8 81.8 84.5
MLL
Decision Table 94.4 81.9 86.1 86.1 73.6 84.7 84.7 80.6 83.3 83.3 83.9 Decision
Table-CFS 93.1 83.3 86.1 87.5 88.9 87.5 87.5 86.1 83.3 81.9 86.5 JRip 91.7 68.1 77.8 77.8 79.2 76.4 87.5 87.5 84.7 91.7 82.2 Jrip-CFS 95.8 81.9 84.7 88.9 86.1 81.9 90.3 88.9 83.3 88.9 87.1 OneR 90.3 81.9 76.4 81.9 75.0 75.0 77.8 73.6 77.8 75.0 78.5 OneR-CFS 90.3 81.9 76.4 81.9 79.2 75.0 77.8 75.0 77.8 75.0 79.0
Ovarian
Decision Table 100.0 92.9 96.0 96.8 96.0 97.6 96.8 96.0 97.6 98.0 96.8 Decision
Table-CFS 99.6 95.3 96.8 96.8 97.2 95.7 96.8 96.4 97.2 96.8 96.9 JRip 99.2 94.9 96.4 96.4 97.6 96.4 98.0 97.6 96.4 98.4 97.2 Jrip-CFS 99.2 97.6 97.6 96.0 97.6 94.9 96.8 98.0 98.0 96.8 97.3 OneR 98.0 94.9 97.2 95.7 96.8 97.2 97.2 97.2 97.2 97.2 96.9 OneR-CFS 98.0 94.9 97.2 95.7 96.8 97.2 97.2 97.2 97.2 97.2 96.9
SRBCT
Decision Table 95.2 65.1 74.7 62.7 68.7 73.5 71.1 69.9 73.5 67.5 72.2 Decision
Table-CFS 94.0 68.7 72.3 69.9 67.5 81.9 72.3 71.1 75.9 65.1 73.9 JRip 97.6 80.7 89.2 79.5 85.5 81.9 85.5 84.3 85.5 86.7 85.7 Jrip-CFS 97.6 86.7 90.4 88.0 85.5 85.5 90.4 91.6 90.4 89.2 89.5 OneR 74.7 44.6 61.4 54.2 57.8 59.0 57.8 60.2 56.6 56.6 58.3 OneR-CFS 74.7 44.6 61.4 39.8 50.6 63.9 55.4 60.2 56.6 60.2 56.7
was 85.5% with Decision Table-CFS, 83.6% with Decision Table, 84.5% with OneR-CFS, and 82.6% with OneR.
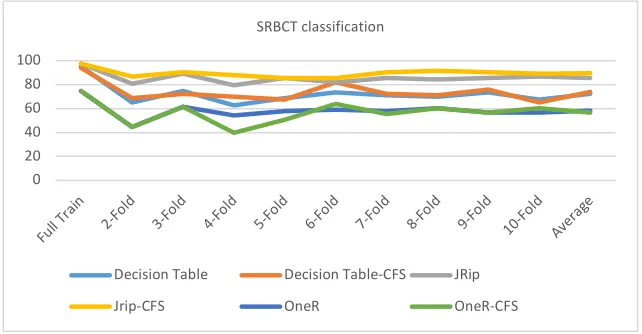
Considering the datasets analysis in full training method and 2-folds to 10-folds cross validation. The results showed that the JRip exceeded the performance and accuracy compared to Decision Table and OneR. As example, Figure 1 shows the classification accuracy for the SRBCT dataset using the 3 classifiers in the ten differ-ent tests. The results in Figure 1 prove that JRip combined with CFS was the best functional method since it yielded better results than the other methods.
Fig. 1. Accuracy of SRBCT using full training and cross validation method
Moreover, considering the average accuracy for the 11 datasets as shown in Table 4. The average accuracy of all 11 data was 78.2% (Decision Table), 82.4% (Decision Table-CFS), 80.7% (JRip), 86.0% (Jrip-CFS), 73.1% (OneR), and 75.3% (OneR-CFS). It is clear that the classifier’s accuracy is improved after selection process using CFS. Also, we have clearly noticed that the average accuracy of JRip was better than Decision Table and OneR.
Table 4. Average accuracy for the 11 microarray data
Classifier
Accuracy for the full training and cross validation method
A
ve
ra
ge
Breast
Can-cer CNS Co-lon
Leu-kemia mia_3C Leuke- mia_4C Lung Leuke- phoma MLL Lym- Ovar-ian SRBCT Decision
Table 61.0 63.0 74.4 85.0 81.7 75.3 83.7 83.6 83.9 96.8 72.2 78.2 Decision
Table-CFS 69.7 73.3 82.9 86.8 83.7 80.8 86.5 85.5 86.5 96.9 73.9 82.4 JRip 59.8 60.0 74.4 86.0 87.1 81.0 88.3 86.1 82.2 97.2 85.7 80.7 Jrip-CFS 69.1 71.5 82.4 88.1 90.6 85.3 91.6 93.8 87.1 97.3 89.5 86.0 OneR 53.7 57.8 71.0 85.0 71.7 72.9 75.3 82.6 78.5 96.9 58.3 73.1 OneR-CFS 59.5 66.0 77.1 85.0 74.4 73.1 76.1 84.5 79.0 96.9 56.7 75.3
0 20 40 60 80 100
Full T
rain 2-Fold 3-Fold 4-Fold 5-Fold 6-Fold 7-Fold 8-Fold 9-Fold 10-Fo
ld Avera
ge SRBCT classification
Decision Table Decision Table-CFS JRip
5
Conclusion
Usually, microarray data is characterized by noisiness as well as increased dimensionality. Therefore, selecting relevant genes is an imperative in microarray data analysis. In this paper, CFS is proposed to select the relevant features. Also, Decision Table, JRip, and OneR classifiers are proposed to classify the microarray data. The comparative analysis proved that the accuracy of all classifiers is improved using filtered datasets compared with their accuracy on the original datasets. This indicates that the feature selection by CFS not only improved the efficiency of the classification process but also its accuracy is enhanced. Furthermore, it can be seen that JRip has presented the highest classification accuracy among all the other classi-fiers. Further, this paper can be extended by considering the applicability of another features selection techniques such as Genetic Algorithm, Principle Component Analy-sis, Simulated Annealing, Ant Colony Optimization, and Particle Swarm Optimiza-tion.
6
References
[1] Agrawal S, Agrawal J. Neural network techniques for cancer prediction: A survey. Proce-dia Computer Science. 2015; 60:769–774. https://doi.org/10.1016/j.procs.2015.08.234
[2] Almoeirfi, M, (2015). Classification Approaches for Microarray Gene Expression Data Analysis. Master thesis. Laurentian University, Sudbury, Ontario, Canada.
[3] Alshamlan, H.M., G.H. Badr and Y.A. Alohali, 2015. Genetic Bee Colony (GBC) algo-rithm: A new gene selection method for microarray cancer classification. Computational Biology Chemistry, 56: 49-60. https://doi.org/10.1016/j.compbiolchem.2015.03.001
[4] Angulo, A.P. Gene Selection for Microarray Cancer Data Classification by a Novel Rule-Based Algorithm. Information 2018, 9, 6; https://doi.org/10.3390/info9010006.
[5] Ardjani, F., K. Sadouni and M. Benyettou, 2010. Optimization of SVM multiclass by par-ticle swarm (PSO-SVM). Proceedings of the 2nd International Workshop on Database Technology and Applications, Nov. 27-28, IEEE Xplore press, Wuhan, China.
https://doi.org/10.1109/dbta.2010.5658994
[6] Bolón-Canedo, V., N. Sánchez-Marono, A. Alonso-Betanzos, J.M. Benítez and F. Herrera, 2014. A review of microarray datasets and applied feature selection methods. Information Sci., 282: 111-135. https://doi.org/10.1016/j.ins.2014.05.042
[7] Annavarapu, C.S., S. Dara, H. Banka, 2016. Cancer microarray data feature selection using multi-objective binary particle swarm optimization algorithm. EXCLI J., 1;15:460-473. DOI: 10.17179/excli2016-481
[8] Chen Y, Li Y, Narayan R, Subramanian A, Xie X. Gene expression inference with deep learning. Bioinformatics. 2016; 32(12):1832–1839. PMID: 26873929 https://doi.org/10.10 93/bioinformatics/btw074
[9] Chen, Y., D. Miao and R. Wang, 2010. A rough set approach to feature selection based on ant colony optimization. Pattern Recognition Lett., 31: 226-233. https://doi.org/10.1 016/j.patrec.2009.10.013
[10] Czajkowski M, Grzes M, Kretowski M. Multi-test decision tree and its application to mi-croarray data classification. Artificial Intelligence in Medicine. 2014; 61(1):35–44. doi:
[11] Dash, R., 2018. An adaptive harmony search approach for gene selection and classification of high dimensional medical data. J. King Saud University-Computer and Information Sci-ences. https://doi.org/10.1016/j.jksuci.2018.02.013
[12] Dashtban, M., M. Balafar and P. Suravajhala, 2018. Gene selection for tumor classification using a novel bio-inspired multi-objective approach. Genomics, 110: 10-17.
https://doi.org/10.1016/j.ygeno.2017.07.010
[13] Fakhoury M. Autistic spectrum disorders: A review of clinical features, theories and diag-nosis. International Journal of Developmental Neuroscience. 2015; 43:70–77. PMID: 25862937 https://doi.org/10.1016/j.ijdevneu.2015.04.003
[14] Ferreira, L.G.; dos Santos, R.N.; Oliva, G.; Andricopulo, A.D. Molecular Docking and Structure-Based Drug Design Strategies. Molecules 2015, 20, 13384–13421.
https://doi.org/10.3390/molecules200713384
[15] Ghaddar, B. and J. Naoum-Sawaya, 2018. High dimensional data classification and feature selection using support vector machines. Eur. J. Operational Res., 265: 993-1004.
https://doi.org/10.1016/j.ejor.2017.08.040
[16] Gonzalez-Navarro, F. and L.A. Belanche-Muñoz, 2014. Feature selection for microarray gene expression data using simulated annealing guided by the multivariate joint entropy. Inter. J. Comput. Sci. Applications. https://doi.org/10.13053/cys-18-2-1473
[17] Hall, A.M. Correlation-based feature selection for machine learning, Tech. Rep., Doctoral Dissertation, University Of Waikato, Department of Computer Science, 1999.
[18] Hameed, S.S., F.F. Muhammad, R. Hassan and F. Saeed, 2018. Gene Selection and Classi-fication in Microarray Datasets using a Hybrid Approach of PCC-BPSO/GA with Multi Classifiers. Journal of Computer Science, Volume 14, Issue 6, Pages 868-880.
https://doi.org/10.3844/jcssp.2018.868.880
[19] Hira, Z. M., and Gillies, D. F., A Review of Feature Selection and Feature Extraction Methods Applied on Microarray Data, Adv Bioinformatics. 2015: 198363.
https://doi.org/10.1155/2015/198363.
[20] Holte, R.C. (1993). Very Simple Classification Rules Perform Well on Most Commonly Used Datasets, Mach Learn, 11, 63-91.
[21] Hong, H.J.; Koom, W.S.; Koh, W.-G. Cell Microarray Technologies for High-Throughput Cell-Based Biosensors. Sensors 2017, 17, 1293. https://doi.org/10.3390/s17061293 [22] Huang HH, Liu XY, Liang Y. Feature Selection and Cancer Classification via Sparse
Lo-gistic Regression with the Hybrid L1/2+ 2 Regularization. PloS one. 2016; 11(5):e0149675. https://doi.org/10.1371/ journal.pone.0149675 PMID: 27136190
https://doi.org/10.1371/journal.pone.0149675
[23] Jain, I., V.K. Jain and R. Jain, 2018. Correlation feature selection based improved-Binary Particle Swarm Optimization for gene selection and cancer classification. Applied Soft Computing, 62: 203-215. https://doi.org/10.1016/j.asoc.2017.09.038
[24] Khan J, Wei JS, Ringner M, Saal LH, Ladanyi M, Westermann F, et al. Classification and diagnostic prediction of cancers using gene expression profiling and artificial neural net-works. Nature medicine. 2001; 7(6):673. https://doi.org/10.1038/89044 PMID: 11385503 [25] Kohavi, R. (1995). The power of decision tables, Machine Learning: Ecml95, 912,
174-189.
[26] Kumara M, Rath NK, Swain A, Rath SK. Feature selection and classification of microarray data using MapReduce based ANOVA and KNearest neighbor. Procedia Comput Sci 2015; 54: 301-10. https://doi.org/10.1016/j.procs.2015.06.035
[28] Miyahara, K.; Pazzani, M.J. Collaborative filtering with the simple bayesian classifier. In Proceedings of the Pacific Rim International Conference on Artificial Intelligence, Mel-bourne, Australia, 28August–1 September 2000; pp. 679–689.
https://doi.org/10.1007/3-540-44533-1_68
[29] Pashaei, E. and N. Aydin, 2017. Binary black hole algorithm for feature selection and clas-sification on biological data. Applied Soft Computing, 56: 94-106.
https://doi.org/10.1016/j.asoc.2017.03.002
[30] Ruskin, H.J. Computational Modeling and Analysis of Microarray Data: New Horizons. Microarrays 2016,5,26. https://doi.org/10.3390/microarrays5040026
[31] Shen L, Jiang H, He M, Liu G (2017) Collaborative representation-based classification of microarray gene expression data. PLoS ONE 12 (12): e0189533.
https://doi.org/10.1371/journal.pone.0189533
[32] Torkkola, K. Feature extraction by non-parametric mutual information maximization. J. Mach. Learn. Res. 2003, 3, 1415–1438.
[33] Tran, B., B. Xue and M. Zhang, 2014. Improved PSO for Feature Selection on High-Dimensional Datasets. In: Simulated Evolution and Learning, Dick, G. (Ed.), Lecture Notes in Computer Science, Springer, Cham. https://doi.org/10.1007/978-3-319-13563-2_43
[34] Wang, A.; Gehan, E. Gene selection for microarray data analysis using principle compo-nent analysis. Stat. Med. 2005, 24, 2069–2087. https://doi.org/10.1002/sim.2082
[35] Witten, I.H., and Frank, E. (2005) Data Mining: Practical machine learning tools and tech-niques. 2nd Ed. Morgan Kaufmann.
[36] Wosiak, A. and D. Zakrzewska, Integrating Correlation-Based Feature Selection and Clus-tering for Improved Cardiovascular Disease Diagnosis, Complexity, vol. 2018, Article ID 2520706, 11 pages, 2018. https://doi.org/10.1155/2018/2520706.
[37] Zhu, Z., Y.S. Ong and M. Dash, 2007. Markov blanket embedded genetic algorithm for gene selection. Pattern Recognition, 40: 3236-3248.
https://doi.org/10.1016/j.patcog.2007.02.007
[38] Yildirim, P., 2015. Filter Based Feature Selection Methods for Prediction of Risks in Hepatitis Disease, International Journal of Machine Learning and Computing, Vol. 5, No.
4. https://doi.org/10.7763/ijmlc.2015.v5.517
[39] Hall, A., Mark, and A. Smith, Lloyd., 1997. Feature Subset Selection: A Correlation based Filter Approach. International Conference on Neural Information Processing and Intelli-gent Information Systems.
7
Authors
Mohammad Subhi Al-Batah obtained his PhD in Computer Science/ Artificial In-telligence from University Science Malaysia in 2009. He is currently lecturing at the Faculty of Sciences and Information Technology, Jadara University in Jordan. In addition, in 2018, he is working as the Director of Academic Development and Quali-ty Assurance Center in Jadara UniversiQuali-ty. His research interests include image pro-cessing, Artificial Intelligence, real time classification and software engineering ([email protected])
Univer-sity, Irbid, Jordan. He is Assistance Professor at Jadara UniverUniver-sity, Irbid, Jordan 2013. He is a head of the computer network department at Jadara University, 2014 until 2016. He is the candidate of the Multimedia Computing Research Group, School of Computer Science, USM. He is research assistant with Prof. Dr. Putra, Sumari. He is managing director of ICT Technology and Research and Development Division (R&D) in D&D Professional Consulting Company. He has published over 50 papers in international journals and refereed conferences at the same research area. He is a member and reviewer of several international journals and conferences (IEICE, ACM, KSII, JDCTA, IEEE, IACSIT, etc). His research interest are in area of multimedia networking, video communications system design, multimedia communication specif-ically on Video on Demand system, P2P Media Streaming, MANETs, caching tech-niques and for advanced mobile broadcasting networks as well.
Mowafaq S. Alzboon received the PhD degree in computer science from Universi-ty Utara Malaysia. He is an assistant professor of Science and Information Technolo-gy Faculty at Jadara University, Jordan. His research focuses on Cloud Computing, Autonomic Computing, and Visualization technology, Load balancing, Overlay Net-work, Mobile Application Development and Internet of Things.
Belal Zaqaibeh obtained his Bachelor degree in Computer Science (CS) with First Class Honor from INU in 1998 Jordan. He got his Master and PhD from the Depart-ment of CS at UPM in 2006/ Malaysia. Dr. Zaqaibeh has twelve years experience in research and teaching in Malaysia, Jordan, and Bahrain. Since 1999 until now, Dr. Zaqaibeh held several managerial positions such as the Director of the Computer Center, Dean of the faculty of Science and IT at Jadara University, Jordan, and the Dean of College of Arts and Science at AUS, Bahrain. Dr. Zaqaibeh is a founder member of the ICSRS in 2007, www.i-csrs.org. In addition, he is an active member (editorial board member) in the IJOPCM since 2008, www.ijopcm.org. Furthermore, he is an active member (reviewer) in the IAJIT since 2007, www.iajit.org. In 2015, he has been elected to be the liaison officer of the CCIS to represent all universities in the Kingdom of Bahrain. In early 2018, Dr. Zaqaibeh became the Vice-Chair of IEEE Bahrain Section ExCom, Bahrain. His research interest includes Big Data, Timeta-bling, and Integrity constraints.