R E S E A R C H
Open Access
CHCHD4 confers metabolic vulnerabilities
to tumour cells through its control of the
mitochondrial respiratory chain
Luke W. Thomas
1, Jenna M. Stephen
1, Cinzia Esposito
1,3, Simon Hoer
2, Robin Antrobus
2, Afshan Ahmed
1,4,
Hasan Al-Habib
1and Margaret Ashcroft
1*Abstract
Background:Tumour cells rely on glycolysis and mitochondrial oxidative phosphorylation (OXPHOS) to survive. Thus, mitochondrial OXPHOS has become an increasingly attractive area for therapeutic exploitation in cancer. However, mitochondria are required for intracellular oxygenation and normal physiological processes, and it remains unclear which mitochondrial molecular mechanisms might provide therapeutic benefit. Previously, we discovered that coiled-coil-helix-coiled-coil-helix domain-containing protein 4 (CHCHD4) is critical for regulating intracellular oxygenation and required for the cellular response to hypoxia (low oxygenation) in tumour cells through molecular mechanisms that we do not yet fully understand. Overexpression ofCHCHD4in human cancers correlates with increased tumour progression and poor patient survival.
Results:Here, we show that elevated CHCHD4 expression provides a proliferative and metabolic advantage to tumour cells in normoxia and hypoxia. Using stable isotope labelling with amino acids in cell culture (SILAC) and analysis of the whole mitochondrial proteome, we show that CHCHD4 dynamically affects the expression of a broad range of mitochondrial respiratory chain subunits from complex I–V, including multiple subunits of complex I (CI) required for complex assembly that are essential for cell survival. We found that loss of CHCHD4 protects tumour cells from respiratory chain inhibition at CI, while elevated CHCHD4 expression in tumour cells leads to significantly increased sensitivity to CI inhibition, in part through the production of mitochondrial reactive oxygen species (ROS).
Conclusions:Our study highlights an important role for CHCHD4 in regulating tumour cell metabolism and reveals that CHCHD4 confers metabolic vulnerabilities to tumour cells through its control of the mitochondrial respiratory chain and CI biology.
Keywords:Coiled-coil-helix-coiled-coil-helix domain-containing 4 (CHCHD4), Hypoxia, HIF-1α, Mitochondria, Respiratory chain, Disulfide relay system, Complex I, Tumour growth, Tumour metabolism
Background
Metabolic reprogramming and altered mitochondrial metabolism is a feature of cancer and thus has become an attractive area for therapeutic exploitation [1, 2]. Given the importance of mitochondria in controlling normal physiological processes, understanding how mitochondrial metabolism underlies tumorigenesis is
important for ascertaining its therapeutic potential in cancer.
Previously, we discovered the essential redox-sensitive mitochondrial intermembrane space (IMS) protein CHCHD4 is critical for regulating basal oxygen con-sumption rate (OCR) and metabolic responses to low oxygen (hypoxia) in tumour cells [3, 4]. Overexpression of CHCHD4 in human cancers significantly correlates with the hypoxia gene signature, tumour progression, disease recurrence and poor patient survival [3].
* Correspondence:m.ashcroft@medschl.cam.ac.uk
1Department of Medicine, University of Cambridge, Cambridge Biomedical
Campus, Cambridge CB2 0AH, UK
Full list of author information is available at the end of the article
CHCHD4 provides an import and oxidoreductase-mediated protein folding function along with the sulfhy-dryl oxidase GFER (ALR/Erv1) as a key part of the disul-fide relay system (DRS) within the mitochondrial IMS [5–7]. As such, CHCHD4 controls the import of a num-ber of mitochondrial proteins that contain a twin-CX9C
or twin-CX3C motif [8–10]. Additionally, as a
compo-nent of the DRS, CHCHD4 participates in electron transfer to complex IV (CIV), the molecular oxygen ac-ceptor of the respiratory chain [11]. We and others have found that the functionally conserved cysteines within the redox-sensitive Cys-Pro-Cys (CPC) domain of CHCHD4 regulate its mitochondrial localisation in yeast [12–14] and human cells [3,15]. Recently, we discovered that CHCHD4 regulates intracellular oxygenation in tumour cells, which is dependent on the functionally im-portant cysteines of the CPC motif and CIV activity [4].
In this study, using both loss- and gain-of-function ap-proaches, we have further explored the mitochondrial mechanism(s) by which CHCHD4 regulates respiratory chain function and tumour cell metabolism.
Methods
Cell culture and cell line generation
Human osteosarcoma U2OS control and independent clonal cell lines (WT.cl1 and WT.cl3) expressing CHCHD4.1 cDNA (CHCHD4-WT-expressing cells) or CHCHD4-C66A/C668A cDNA (CHCHD4-(C66A/C68A)-expressing cells) have been described by us recently [4]. Human U2OS-HRE-luc [16] or human HCT116 colon car-cinoma cells [17] were used to stably express two independ-ent shRNA control vectors (empty vector (shRNA control 1) and GFP vector (shRNA control 2)) or two independent shRNAs targeting CHCHD4 (CHCHD4 shRNA1 or CHCHD4 shRNA2) utilising a green fluorescent protein (GFP)-SMARTvector™pre-packaged lentivirus system from ThermoFisher Scientific. Independent cell lines were se-lected, expanded and characterised. All cell lines were maintained in Dulbecco’s modified Eagle medium (DMEM) containing 4.5 g/L glucose (#41966-029, Life Technologies) and supplemented with 10% fetal calf serum (#EU-000-F, SeraLabs), 100 IU/mL penicillin/100μg/mL streptomycin (#15140-122, Life Technologies) and 6 mML-glutamine (#25030-024, Life Technologies). Cell lines used were au-thenticated and routinely confirmed to be negative for any mycoplasma contamination. Hypoxia was achieved by incu-bating cells in 1% O2, 5% CO2 and 94% N2in a Ruskinn
SCI-tive workstation, without agitation.
Antibodies and reagents
For antibodies, the catalogue number and working dilu-tion used are indicated in brackets. The rabbit polyclonal CHCHD4 (HPA34688, 1:1000) antibody was purchased from Cambridge Biosciences. The mouse monoclonal
HIF-1α antibody (#610959, 1:500) was purchased from BD Biosciences. The mouse monoclonalβ-actin (ab6276, 1:10000), mouse monoclonal α-Tubulin (ab7291, 1:1000), rabbit polyclonal NDUFS3 (ab110246, 1:500) and rabbit polyclonal UQCRC2 (ab14745, 1:1000) were purchased from Abcam. The mouse monoclonal anti-myc (9B11 clone, #2276, 1:1000)), rabbit polyclonal PHB1 (#2426, 1:1000), rabbit polyclonal HIF-2α (#7096, 1:1000), rabbit polyclonal AIF (#4642, 1:1000), rabbit polyclonal SDHA (#11998, 1:1000) and rabbit monoclonal COXIV (3E11 clone, #4850, 11000) antibodies were pur-chased from Cell Signaling Technology. The donkey anti-rabbit (NA934, 1:1000) and anti-mouse (NA931, 1:1000) horseradish peroxidase (HRP)-linked secondary antibodies were purchased from VWR. The GFER rabbit polyclonal antibody (#HPA041227, 1:1000), oligomycin (#75351), rotenone (#R8875), FCCP (#C2920), TMRM (#T5428),D-glucose (#G8270), 2-deoxy-D-glucose (#D8375) and sodium azide (NaAzide, #S8032) were purchased from Sigma-Aldrich. MitoSOX Red (#M36008) was purchased from ThermoFisher Scientific. MitoView Green (#70054) was purchased from Biotium. 2-NBDG (#N13195) was chased from Life Technologies. Trolox (#648471) was pur-chased from Merck Millipore. BAY 87-2243 (#HY-15836) was purchased from MedChemTronica AB. NSC-134754, 3-ethyl-9,10-dimethoxy-2-(1,2,3,4-tetrahydro-isoquinoli-n-1-ylmethyl)- 1,6,7,11b-tetrahydro-4H-pyrido[2,1-a]isoqui-noline was obtained from the National Cancer Centre, Drug Therapeutic Program (NCI-DTP), Frederick, MD, and dissolved in dimethyl sulfoxide (DMSO) as we have de-scribed previously [16,18–20].
Gene silencing
Non-silencing siRNA duplexes (MISSION® siRNA Uni-versal Negative Control #1, SIC-001) and custom-designed siRNA duplexes were purchased from Sigma-Aldrich and transfected into subconfluent cells using HiPerfect transfection (QIAGEN) according to the manufacturer’s instructions. The target sequences for
CHCHD4 were 5′-GAGGAAACGTTGTGAATTA-3′
lentiviral particles purchased from Dharmacon (Ther-moFisher Scientific) and target sequences are detailed in Additional file 1. After 72 h of incubation with len-tiviral particles, media were replaced with mainten-ance DMEM (w/o polybrene/lentivirus), and were cells incubated for a further 72 h. Selection of transduced cell pools carried out by the addition of 0.5μg/mL puro-mycin (#P9620, Sigma-Aldrich) to the culture medium, followed by incubation for > 96 h. Knockdown confirmed by both western blotting for CHCHD4 protein expression and Q-PCR forCHCHD4transcript expression.
Gene expression analysis
Total RNA samples were isolated using the GeneElute kit (#RTN350), following the manufacturer’s protocol (Sigma-Aldrich). cDNA synthesis was carried out using the qScript synthesis kit (#95048-100), following the manufacturer’s protocol (Quantabio). mRNA expression was measured by quantitative (Q)-PCR using SYBR Green Mastermix (#RT-SY2X-NRWOU+B, Eurogentec Ltd.) and the DNA Engine Opticon 2 system (BioRad). The Q-PCR primer sequences are included in Additional file2.
Mitochondrial copy number
Measurement of mitochondrial (mt)DNA copy number has been described previously [21]. Total DNA samples were isolated using the QIAamp DNA Blood Mini Kit, following the manufacturer’s protocol (Sigma-Aldrich). Relative copy numbers of the single-copy nuclear-encoded gene beta-2-microglobulin (β2M) and the mitochondrially encoded gene mtND1 were measured by quantitative (Q)-PCR using SYBR Green Mastermix (Eurogentec Ltd.) and the DNA Engine Opticon 2 system (BioRad). The Q-PCR primer sequences are in Additional file2. To de-termine the mtDNA content, relative to nuclear DNA, the following equations were used:
a. ΔCT= (nucDNA CT−mtDNA CT) b. Relative mtDNA content = 2 × 2ΔCT
Respirometry
Oxygen consumption rates (OCR) and extracellular acid-ification rates (ECAR) were determined using a Seahorse XF96 Analyser (Seahorse Bioscience). Respiratory profiles were generated by serial treatment with optimised con-centrations of oligomycin (1μg/mL), p-[trifluoromethox-y]-phenyl-hydrazone (FCCP, 500 nM) and rotenone (500 nM). Glycolytic profiles were generated by serial treat-ment of glucose-restricted cells with optimised concentra-tions of glucose (12.5 mM), oligomycin A (1μM), and 2-DG (50 mM). Cell number normalisation was carried out post-respirometry using sulforhodamine B (SRB) staining of TCA-fixed cells in the assay plate.
Mitochondrial fractionation
Crude mitochondrial fractions were prepared from cul-tured cells as follows. All tubes and reagents were pre-chilled, and all steps carried out at 4 °C or on ice. Cells were collected and washed twice with homogenisa-tion buffer (HB) (250 mM Mannitol, 5 mM HEPES (pH 7.4), 0.5 mM EGTA, in water). Pellets were resuspended in 1 mL of HB and transferred to a chilled glass potter. Cells were lysed with 150 strokes of potter on ice, and 50μL of homogenate removed for whole cell lysate (WCL) sample. The remaining lysate was spun at 1000xg for 5 min at 4 °C. Supernatants were transferred to fresh tubes and spun at 2000xg for 5 min at 4 °C. Su-pernatants were again transferred to fresh tubes and spun at 10,000xg for 10 min at 4 °C. Fifty microlitres of supernatants were retained as the cytoplasm sample. Mitochondrial pellets were washed with 2–3 mL HB and spun at 10,000xg for 10 min at 4 °C. Supernatants were carefully removed, and mitochondrial pellets were resus-pended in 200μL HB for functional assays or 200μL 1× Laemmli sample buffer for immunoblotting. The func-tionality of isolated mitochondria was monitored using TMRM staining, which measures mitochondrial mem-brane potential (Additional file3f ).
SILAC
Cells were incubated in arginine and lysine free DMEM (#A14431, Life Technologies), supplemented with either (light) L-lysine (#L8662) and L-arginine (#A5006), or (heavy)L-lysine-13C6,15N2(Lys-8, #608041)) and L
-argi-nine-13C6,15N4(Arg-10, #608033) stable isotope-labelled
amino acids (Sigma-Aldrich). Media was also supple-mented with 10% dialysed FCS (Sigma), penicillin (100 IU/mL), streptomycin (100μg/mL) and L-glutamine (200 mM), all purchased from Life Technologies. Amino acid incorporation was carried out over > 5 passages. Mitochondrial fractions were isolated as described below. Fifty micrograms of enriched mitochondria were resolved approximately 6 cm into a pre-cast 4–12% Bis-Tris polyacrylamide gel (ThermoFisher Scientific). The lane was excised and cut in 8 approximately equal chunks, and the proteins reduced, alkylated and digested in-gel. The resulting tryptic peptides were analysed by
LC-MSMS using a Q Exactive coupled to an
[23, 24]. Three independent SILAC experiments using control U2OS and CHCHD4 (WT.cl1)-expressing cells involving parallel labelling were performed. Two inde-pendent SILAC experiments using shRNA control and CHCHD4 (shRNA) knockdown cells involving parallel labelling were performed.
Sulforhodamine B (SRB) assay
Cells were plated in appropriate tissue culture vessels and allowed to adhere overnight prior to treatment. Media was removed and cells were fixed with 10% trichloroacetic acid (TCA, #91228, Sigma-Aldrich) for 30 min. TCA was washed with water, wells were allowed to air dry and then an excess of 0.4% (w/v) SRB (#S9012, Sigma-Aldrich) in 1% acetic acid (A/0400/PB15, Ther-moFisher Scientific) was used to stain fixed cells for > 10 min. Excess SRB was washed off with 1% acetic acid solution. Bound SRB was resuspended in a suitable vol-ume of 10 mM Tris, and absorbance of solution mea-sured at 570 nm. For proliferation assays, cells were plated on‘day -1’in triplicate in 12 well plates and cul-tured in maintenance DMEM overnight, after which‘day 0’ plates fixed with TCA. For galactose conditions, glu-cose media were replaced with gluglu-cose-free DMEM, supplemented with 4.5 g/L galactose, 10% FCS, penicil-lin, streptomycin and L-glutamine, and 1 mM pyruvate. Cells were then incubated for desired time points in ei-ther normoxia or hypoxia, followed by SRB assay. For drug sensitivity assays, cells were plated in triplicate col-umns in 96-well plates and cultured in maintenance DMEM overnight. Appropriate wells were dosed with serial dilutions of compounds, including vehicle control wells. Cells were incubated for desired time points in ei-ther normoxia or hypoxia, followed by SRB assay. SRB data were used to calculate relative growth as indicated in the relevant figure legend text and were consistent with independent total cell count (data not shown). To evaluate changes in drug sensitivity between cell lines, we calculated the concentration at which growth was inhibited by 50% (IC50) for each drug per cell line. To
account for any changes in growth rate between cell lines, we also calculated the concentration for growth rate inhibition (GR) at 50% (GR50) of the concentration
at which maximum growth is inhibited (GRmax) in the
presence of drug relative to the untreated control as pre-viously described [25].
CI assay
For evaluating the direct inhibitory effect of compounds on CI activity from whole CI enzyme immunocaptured from purified bovine heart mitochondria, the MitoTox™ Complex I OXPHOS Activity Microplate Assay (Abcam, ab109903) was used according to the manufacturer’s in-structions. The IC50 was determined by calculating the
dose at which CI activity was inhibited by 50%. This was calculated as 5–50 nM for rotenone and 50–500 nM for BAY 87-2243 (see Fig.4a).
ATP assay
Cellular ATP concentrations were determined using CellTiter-Glo Luminescent Cell Viability Assay reagent and protocol, purchased from Promega (G7570). Briefly, cells were incubated in parallel in appropriate culture vessels under the conditions and for the duration of time described in the figure legends. Cells were lysed by the addition of a volume of CellTiter-Glo reagent equal to the volume of the culture media and incubated for 2 min on an orbital shaker at room temperature. One hundred microlitres of each sample was loaded into a 96-well luminometry plate, and the luminescence of each sample was measured using a Tecan Infinite M200 PRO lumi-nescent plate reader. Parallel cell incubations were assayed for total cell content using the SRB assay, and the luminescence measurements were normalised to the respective SRB measurements.
Live cell imaging
Cells were plated in glass-based black-walled multi-welled microscopy plates and allowed to adhere over-night. Following treatments (as described in figure legends), the plates were sealed with air-tight adhesive film and imaged on a heated stage, using a DMI4000 B inverted microscope (Leica).
Flow cytometry
For TMRM staining, mitochondria were harvested ac-cording to protocol detailed here, resuspended in DMEM supplemented with 1 mML-pyruvate and 200 nM TMRM and incubated for 30 min at 37 °C and 5% CO2. After staining, mitochondria were washed twice in
PBS, before resuspension in PBS, followed by flow cyto-metric analysis using a Fortessa flow cytometer (BD Bio-sciences). For MitoView staining, cells were harvested by trypsinisation, and centrifugation, and washed twice in warmed PBS. Cells resuspended in warmed PBS, or warmed PBS containing 200 nM MitoView (green). Fluorescence intensity was measured using a FACSCali-bur flow cytometer (BD Biosciences). For 2-NBDG up-take assay, cells in suspension were incubated in warmed (37 °C) PBS or warmed PBS containing 200μM 2-NBDG for 20 min. Cells were then washed three times in warmed PBS followed by flow cytometric analysis using a Fortessa flow cytometer (BD Biosciences).
Quantification of microscopy images
intensity, standard error and significance were calculated for each condition.
Quantification of western blots (densitometry)
Western blot signal intensity was measured per lane using ImageJ (NIH) analysis software. Sample protein band intensities were normalised to the load control protein α-tubulin (for whole cell lysates) or PHB1 (for mitochondrial fractions). Relative band intensities were calculated relative to internal control sample.
Statistical analysis
All statistical analyses carried out using Microsoft Excel (2016 edition) or GraphPad Prism version 7.02 for Windows. Groups compared using unpaired, two-tailed student’s t test assuming equal variance, with signifi-cance set at p< 0.05. All error bars represent standard deviation from the mean (SD) except where stated. Sample numbers (nvalues) and significance marks indi-cated in figure legends. Area under the curve was cal-culated for each condition or cell line, and significance of difference between groups calculated using student’s ttest.
Results
Impact of CHCHD4 on the mitochondrial proteome CHCHD4 is responsible for the binding and import of mitochondrial proteins containing a twin CX9C or CX3C
motif including subunits of respiratory chain complexes [8, 10]. Previously, we demonstrated that CHCHD4 is required for maintaining basal cellular (OCR) [3] and intracellular oxygenation in tumour cells [4]. Recently, we found that loss of CHCHD4 in renal carcinoma cells leads to decreased expression of a range of respiratory chain subunits including NDUFS3 (CI), SDHA (complex II, CII), UQCRC2 (complex III, CIII) and COXIV (CIV) [26], indicating that CHCHD4 controls the expression of a broader range of respiratory chain subunits than had previously been considered. Thus, we hypothesised that CHCHD4 affects basal cellular OCR and intracellular oxygenation by altering the expression levels of respira-tory chain subunits. To investigate the extent to which CHCHD4 affects respiratory chain subunit expression and other mitochondrial proteins, we performed stable isotope labelling with amino acid in cell culture (SILAC) using L-lysine-13C6, 15N2 (Lys-8) and L-arginine-13C6, 15
N4(Arg-10) parallel double labelling of shRNA control
and CHCHD4 (shRNA) knockdown cells, as well as CHCHD4 (WT)-expressing cells and control cells (Fig. 1a). Mitochondria were isolated and mass spectro-photometry performed. Approximately 1050–1450 pro-teins were analysed from up to three independent parallel double labelling SILAC experiments (Fig. 1b, c). Our analysis of proteins isolated from mitochondria of
respectively labelled cells confirmed a significant de-crease in CHCHD4 protein in CHCHD4 (shRNA) knockdown compared to shRNA control cells (Fig. 1b) and a significant increase in CHCHD4 protein in CHCHD4 (WT)-expressing cells compared to control cells (Fig.1c). We observed respective decreased and in-creased expression of several known CHCHD4 sub-strates containing a twin-CXnC motif including COX17,
COA6, TIMM8, CHCHD2 and TIMM13 [8, 27] as well as other putative CHCHD4 substrates (Fig. 1d and Table 1), while expression of proteins such as the outer mitochondrial membrane protein sorting and assembly machinery component 50 homologue (SAMM50) did not change. Most interestingly, we observed significant and dynamic changes in a broad range of respiratory chain subunits involving CI, CII, CIII and CIV (Fig. 1e–g, Additional file 3 and Table 1). Notably, we observed more significant protein changes in response to loss of CHCHD4 (Fig. 1b, Table 1) compared to CHCHD4 overexpression (Fig. 1c, Table 1), which was likely related to the respective differences in significance for CHCHD4 expression in each of these conditions (Table 1). Importantly, we consistently observed that fold changes of identified proteins in response to loss or gain of CHCHD4 expression were decreased and increased respectively across multiple SILAC experiments (Fig. 1 and Table 1).
a
b
f
g
h
e
i
d
c
j
k
localisation and import function [3, 15] (Fig. 1g). We noted that stable expression of the CHCHD4 (C66A/ C68A) mutant protein compared to CHCHD4 (WT) pro-tein was much reduced in respective independent cell lines (Fig. 1g). Despite this, we found that respiratory chain subunit expression in CHCHD4 (C66A/C68A)-ex-pressing cells were in some instances below basal levels found in control cells (see Fig.1g, WCL for NDUFS3 and SDHA proteins). These data collectively indicate that the mutant form of CHCHD4 (C66A/C68A) may behave as a dominant negative, and as such, high levels of CHCHD4 (C66A/C68A) expression in cells might not be tolerated. Interestingly, we observed no significant change in mito-chondrial mass when CHCHD4 expression was manipu-lated as assessed either by measuring mitochondrial (mt)DNA copy number (Fig.1h, i) or by staining with the fluorescent mitochondrial marker, MitoView (Add-itional file3e). Moreover, mitochondrial membrane poten-tial was similar in mitochondria isolated from CHCHD4 (WT)-expressing cells, CHCHD4 (C66A/C68A)-expres-sing cells and control cells (Additional file3f ). Expression of the inner membrane protein prohibitin 1 (PHB1) served as a control protein for these experiments as it did not change in response to either CHCHD4 (WT or C66A/ C68A) expression or CHCHD4 knockdown (Fig. 1f, g). Previously, we showed that transient siRNA knockdown and overexpression of CHCHD4 decreased and increased basal cellular OCR, respectively [3]. Consistently, we found that stable shRNA knockdown of CHCHD4 led to a significant decrease in cellular OCR (Fig.1j). Furthermore, we found that both basal and maximal cellular OCRs were significantly increased in CHCHD4 (WT)-expressing cells,
but not in mutant CHCHD4 (C66A/C68A)-expressing cells (Fig.1k). Collectively, our data indicate that modula-tion of CHCHD4 expression leads to global and dynamic effects on the expression of mitochondrial respiratory chain subunits and concomitant changes in basal OCR.
CHCHD4 promotes basal and adaptive metabolic responses and provides a proliferative advantage to tumour cells
We have previously reported that overexpression of CHCHD4 in human cancers correlates with a hypoxia gene signature and increased tumour progression and me-tastasis, disease recurrence and poor patient survival [3]. As our SILAC analyses demonstrated significant changes in the expression of respiratory chain subunits, next we assessed the effect of CHCHD4 expression on tumour cell metabolism and growth in normoxia and hypoxia. In nor-moxia, we observed significantly decreasedL-lactate levels (Fig. 2a) and extracellular acidification rate (ECAR) (Fig. 2b) in CHCHD4 (WT)-expressing cells compared with control or CHCHD4 (C66A/C68A)-expressing cells. Moreover, the rate of uptake of the fluorescent glucose analogue 2-NBDG (2-(N -(7-nitrobenz-2-oxa-1,3-diazo-l-4-yl)amino)-2-deoxyglucose) was slower in CHCHD4 (WT)-expressing cells compared with control U2OS cells, while CHCHD4 (C66A/C68A)-expressing cells had higher uptake (Fig. 2c). Together, these data indicate that in-creased respiratory chain subunit expression correlates with decreased glycolysis in response to elevated CHCHD4 expression in normoxia, and decreased fermen-tation of pyruvate to lactate. In contrast to our findings in normoxia, we observed significantly increased L-lactate
(See figure on previous page.)
Fig. 1Impact of CHCHD4 on the mitochondrial proteome.aSchematic of SILAC procedure. HCT116 cells expressing control (non-targeting) shRNA or expressing CHCHD4-targeting shRNA and control U2OS or CHCHD4 (WT)-expressing U2OS cells (WT.cl1) cells were incubated in either
L-lysine andL-arginine (light) orL-lysine-13C6, 15
N2(Lys-8) andL -arginine-13
C6, 15
N4(Arg-10) (heavy)-containing media for at least 5 cell divisions. Mitochondrial fractions were prepared, and sample pairs were combined prior to LC-MS analysis.bVolcano plot showing log2expression ratios of all detected proteins (1050) in enriched mitochondrial fractions from U2OS cells expressing CHCHD4-targeting shRNA compared to control (non-targeting) shRNA expressing cellsn= 2 independent SILAC experiments each involving parallel double labelling of cells.cVolcano plot showing log2expression ratios of all detected proteins (1450) in enriched mitochondrial fractions from CHCHD4 (WT.cl1) expressing U2OS cells compared to control U2OS cells. CHCHD4 highlighted (red dot)n= 3 independent SILAC experiments each involving parallel double labelling of cells.dVolcano plot showing log2expression ratios of known CHCHD4 substrates containing a twin-CxnC motif identified from our SILAC
levels in CHCHD4 (WT)-expressing cells in hypoxia com-pared with control or CHCHD4 (C66A/C68A)-expressing cells (Additional file4a), as we have shown previously [3]. Alongside this, we observed a corresponding change in the expression of the hypoxia inducible factor (HIF) target lactate dehydrogenase A (LDHA) (Additional file 4b), which converts pyruvate to lactate. Furthermore, we found
that elevated CHCHD4 expression led to significantly in-creased tumour cell growth in both normoxia (Fig. 2d) and hypoxia (Additional file 4c), while the growth of CHCHD4 (C66A/C68A)-expressing cells was similar to control cells (Fig. 2d and Additional file 4c), indicating that increased expression of CHCHD4 in tumour cells provides a proliferative advantage in both normoxia and
Table 1Twin-CXnC motif-containing proteins identified in CHCHD4 (shRNA) knockdown cells and CHCHD4 (WT)-expressing cells using SILAC analysis
Protein Accession
(HGNC)
CXC motifs Function Mean fold change
CH shRNA/shRNACtrl WT.cl1/control
Coiled-coil-helix-coiled-coil-helix domain-containing 4; CHCHD4
26467 CX9C, CX9C [3] Mitochondrial import [53] 0.62 (****) 4.48 (*)
Coiled-coil-helix-coiled-coil-helix domain-containing 1; CHCHD1
23518 CX9C, CX9C [38] Mitochondrial ribosome [38] 0.86 (***) 1.03
Coiled-coil-helix-coiled-coil-helix
domain-containing 2; CHCHD2§ 21645 CX9C, CX9C [54] CIV activity/assembly [8, 54] n.d. 0.63
Coiled-coil-helix-coiled-coil-helix domain-containing 4; CHCHD6§
28184 CX9C, CX9C [55] Cristae morphology [56] 0.86 1.06
NADH:ubiquinone oxidoreductase
subunit A8; NDUFA8§ 7692 CX9C, CX9C [40] CI activity/assembly [8] 0.79 (****) 1.17
NADH:ubiquinone oxidoreductase subunit B7; NDUFB7§
7702 CX9C, CX9C [40] CI activity/assembly [8] 0.82 (**) 1.12 (*)
NADH:ubiquinone oxidoreductase
subunit B10; NDUFB10§ 7696 CX6C, CX11C [57] CI activity/assembly [8, 57] 0.86 (**) 1.13
NADH:ubiquinone oxidoreductase subunit S5; NDUFS5§
7712 CX9C, CX9C [40] CI activity/assembly [8] 0.81 (***) 1.11
Ubiquinol-cytochrome c reductase hinge protein; UQCRH
12590 CX10C, CX9C [58] CIII assembly/activity [59] 0.96 1.05
C-X9-C motif-containing 1; CMC1 28783 CX9C, CX9C [60] CIV assembly/activity [61] 0.68 (****) 1.10
Cytochrome c oxidase assembly factor 6; COA6§
18025 CX9C, CX10C [62] CIV assembly/activity [63] 0.70 (****) 2.00 (*)
Cytochrome c oxidase subunit 6B1; COX6B1
2280 CX9C, CX10C [64] CIV assembly/activity [8, 64] 0.81 (**) 1.43 (**)
Cytochrome c oxidase copper chaperone; COX17
2264 CX9C, CX9C [53] CIV assembly/activity [65] n.d. 2.34 (*)
Translocase of inner mitochondrial
membrane 8 homologue A; TIMM8A§ 11817 CX3C, CX3C [66] Matrix protein import [8, 67] 0.71 (*) 1.30 (*)
Translocase of inner mitochondrial membrane 8 homologue B; TIMM8B§
11818 CX3C, CX3C [66] Matrix protein import [67] 0.76 (*) n.d.
Translocase of inner mitochondrial membrane 9; TIMM9
11819 CX3C, CX3C [66] Matrix protein import [67] 0.80 (***) 1.40 (***)
Translocase of inner mitochondrial membrane 10; TIMM10§
11814 CX3C, CX3C [66] Matrix protein import [8, 67] n.d. 1.07
Translocase of inner mitochondrial
membrane 10B; TIMM10B§ 4022 CX3C, CX3C [66] Matrix protein import [67] 0.81 (*) 1.08
Translocase of inner mitochondrial membrane 13; TIMM13§
11816 CX3C, CX3C [66] Matrix protein import [8, 67] 0.77 (*) 1.47 (*)
Table shows selected proteins, their respective twin-CXnC motif and the fold change in their mitochondrial availability in CHCHD4 (shRNA) knockdown cells compared to control shRNA cells and CHCHD4 (WT)-expressing compared to control cells. Known CHCHD4-binding proteins are indicated (§). Representative mean fold changes in proteins observed in response to CHCHD4 knockdown were calculated from two parallel labelling analyses (CHCHD4 shRNA(H) vs shRNA Ctrl(L) and CHCHD4 shRNA(L) vs shRNA Ctrl(H)) from two independent SILAC experiments. Representative mean fold changes in proteins observed in response to elevated CHCHD4 expression were calculated from two parallel labelling analyses (WT(H) vs Ctrl(L) and WT(L) vs Ctrl(H)) from three independent SILAC experiments for all proteins shown, except CHCHD2 and TIMM8A where data was from two independent SILAC experiments.
hypoxia. Taken together, our data suggest that CHCHD4-mediated effects on the respiratory chain regu-late both basal (normoxic) and adaptive (hypoxic) meta-bolic tumour cell responses and growth.
CHCHD4 expression confers increased tumour cell sensitivity to CI inhibitors
Homozygous deletion of chchd4 in mice, which is em-bryonic lethal, results in a decrease in whole CI expres-sion [28], and human CI deficiency which is fatal is associated with a cysteine mutation within the CI accessory subunit NDUFB10, which is a CHCHD4 sub-strate [29]. Our SILAC analyses of CHCHD4 (shRNA) knockdown and shRNA control cells showed a decrease in the expression of a range of CI accessory subunits (Fig. 1e, red dots). Conversely, CHCHD4 (WT)-expres-sing cells compared to control cells showed an increase in the expression of a range of CI subunits including NDUFS3, as well as NDUFA8, NDUFB10 and NDUFB7, which are considered to be CHCHD4 substrates [8, 27] (Fig.1e, blue dots and Additional file5). Given this rela-tionship between CHCHD4 and CI biology, we hypothe-sised that elevated expression of CHCHD4 in tumour cells may render them more sensitive to respiratory chain OXPHOS inhibitors. Indeed, we found that CHCHD4 (WT)-expressing cells were significantly more sensitive to growth inhibition by the CI inhibitor rote-none (IC5020-40 nM, GR5040-60 nM) compared to
con-trol or mutant CHCHD4 (C66A/C68A)-expressing cells (IC50 150-300 nM) in normoxia (Fig. 3a) and hypoxia
(Additional file6a), while there was no significant differ-ence in the effects of sodium azide on growth across cell lines (Fig. 3b and Additional file 6b). As with sodium azide (Additional file 6c), rotenone also blocked HIF-1α protein (Additional file6d). Together, our data show that the increased sensitivity of CHCHD4 (WT)-expressing cells to growth inhibition is specific to CI inhibition (rotenone) as opposed to CIV inhibition (sodium azide) and occurs irrespective of oxygen levels.
a
b
0 20 40 60 80 100 120 140 Control CHCHD4 (WT.cl1) CHCHD4 (WT.cl3) CHCHD4 (C66A/C68A) % L -ai x o mr o N ni et at c al ) U D O( l ort n o C ot e vit al er ** ** n.s. 0 10 20 30 40 50 60 70 80 900 45 90
) ni m/ H p m( R A C E Time (min) Control CHCHD4 (WT.cl1) CHCHD4 (WT.cl3) Glucose Oligo A 2-DG
c
0 1 2 3 4 5 6 7 80 20 40 60 80 100
) h 0 s v( ht w or G e vit al e R Time (h) Control CHCHD4 (WT.cl1) CHCHD4 (WT.cl3)
CHCHD4 (C66A/C68A) **
d
0 500 1000 1500 2000 2500 Control CHCHD4 (WT.cl1) CHCHD4 (WT.cl3) CHCHD4 (C66A/C68A) 2-n ai d e M G D B N yti s n et nI e c n e c s er o ul F Unstained 2-NBDG ** ** **Fig. 2CHCHD4 promotes basal and adaptive metabolic responses, and provides a proliferative advantage to tumour cells.aGraph shows intracellularL-lactate levels from control U2OS cells, CHCHD4 (WT)-expressing cells (WT.cl1, WT.cl3) and CHCHD4 (C66A/C68A)-expressing cells, expressed as the percentage of control cell levels, measured using a cellular lactate assay.n= 3. mean ± SD, n.s. not significant, **p< 0.01.bGraph shows ECAR (mpH/min) in cells described ina, incubated in glucose-free media and measured using a seahorse respirometer. Compounds were added as indicated to following final concentrations: glucose, 12.5 mM; oligomycin A, 1μM; 2-deoxy-D-glucose, 50 mM.n= 3, mean ± SD.cChart shows intracellular fluorescence of cells described inaincubated with PBS (unstained) or 2-NBDG for 20 min.n= 3, mean ± SD, **p< 0.01.d
c
b
0 20 40 60 80 100 120
4 16 64 256 1024
)
M
n
0
%
s
a(
ht
w
or
G
e
vit
al
e
R
Log2[Rotenone] (nM) Control
CHCHD4 (WT.cl1) CHCHD4 (WT.cl3) CHCHD4 (C66A/C68A)
**
Control
CHCHD4 (WT.cl1)
CHCHD4 (WT.cl3)
CHCHD4 (C66A/C68A)
NT
Rot
enone
Control
CHCHD4 (WT.cl1)
CHCHD4 (WT.cl3)
CHCHD4 (C66A/C68A)
NT
NaA
z
id
e
0 20 40 60 80 100 120 140
0.0001 0.001 0.01 0.1 1 10 100
0
%
s
a(
ht
w
or
G
e
vit
al
e
Rµ
M
)
Log10[NaAzide] (µM) Control
CHCHD4 (WT.cl1) CHCHD4 (WT.cl3) CHCHD4 (C66A/C68A)
e
0 100 200 300 400 500 600 700
Control CHCHD4 (WT.cl1)
CHCHD4 (WT.cl3)
CHCHD4 (C66A/C68A)
M
ean Fluores
c
enc
e
In
te
n
sity
(
a
s % N
T
)
NT Rotenone
*
*
**
n.s. *
* n.s.
a
d
Fig. 3CHCHD4 expression confers increased tumour cell sensitivity to CI inhibitors.aGraph shows relative growth of control U2OS (control) cells, two independent CHCHD4 (WT)-expressing cell clones (WT.cl1, WT.cl3) and CHCHD4 (C66A/C68A)-expressing cells incubated for 72 h in the absence or presence of rotenone using a 2-fold dilution series (top concentration, 1μM). Data are presented for each time point for rotenone-treated relative to untreated.n= 3, mean ± SD, *p< 0.05.bAs ina, using a 10-fold dilution series of sodium azide (top concentration, 100μM).n= 3, mean ± SD.c
Images of control U2OS cells, CHCHD4 (WT)-expressing cells (WT.cl1, WT.cl3) and CHCHD4 (C66A/C68A)-expressing cells, either untreated (NT) or treated with rotenone (500 nM) for 3 h. MitoSOX Red ROS indicator (5μM) was added for 30 min prior to live cell imaging by fluorescence microscopy.
CI is a major source of mitochondrial ROS production, which can have profound effects on cellular viability through oxidative damage to lipids, proteins and nucleic acids [30]. Therefore next, we assessed mitochondrial ROS (superoxide) production using the ROS reporter MitoSOX. We found that basal ROS levels were similarly low in control and CHCHD4 (WT)-expressing cells (Fig. 3c–e). However, in response to rotenone, ROS levels were significantly increased in CHCHD4 (WT)-ex-pressing cells compared to control or CHCHD4 (C66A/ C68A)-expressing cells (Fig. 3c, d). Treatment of cells with sodium azide did not lead to a change in mitochon-drial ROS levels (Fig.3e). Thus, the increased sensitivity of CHCHD4 (WT)-expressing cells to CI inhibitors (rotenone) correlates with increased ROS production in these cells, suggesting that CHCHD4 expression levels determines tumour cell sensitivity to oxidative stress.
CHCHD4 promotes mitochondrial ROS production in response to CI inhibitors
To further explore the relationship between CHCHD4 and CI biology, we evaluated the effects of CI inhibition in CHCHD4 (WT)-expressing cells using the small mol-ecule inhibitor BAY 87-2243 [31]. BAY 87-2243 was pre-viously identified from a HIF-reporter screen and was shown to block HIF-1α by targeting CI without inhibit-ing CIII [31]. BAY 87-2243 exhibits potent antitumor ac-tivity in vivo [31–33] and has recently been shown to induce mitochondrial ROS through its CI inhibitory ac-tivity [34]. The IC50dose (~ 500 nM) of BAY 87-2243 for
inhibiting whole CI enzyme activity, which was 10–100 fold less potent than rotenone in this assay (Fig.4a), also blocked basal OCR by ~ 50% (Additional file 7a). Con-sistent with our findings with rotenone (Fig. 3a), we found that CHCHD4 (WT)-expressing cells were signifi-cantly more sensitive to growth inhibition by BAY 87-2243 treatment compared to control or mutant CHCHD4 (C66A/C68A)-expressing cells in normoxia (Fig. 4b) and hypoxia (Additional file 7b). Notably, the increased sensitivity of CHCHD4 (WT)-expressing cells to BAY 87-2243 was observed at very low nM doses (IC501–5 nM, GR501.5–4.5 nM) compared to control or
CHCHD4 (C66A/C68A)-expressing cells (IC50 10–100
nM) (Fig. 4b and Additional file 7b) in normoxia and hypoxia. Interestingly, although we found that BAY 87-2243 blocked whole CI enzyme activity by 10–15% at doses as low as 5 nM in vitro (Fig.4a), there was no sig-nificant change in basal cellular OCR (Additional file7a) or total cellular ATP levels (Additional file7c) at a 5 nM dose of BAY 87-2243 treatment, suggesting that the ef-fect of CI inhibition on growth inhibition is not solely mediated by changes at the level of intracellular oxygen-ation or bioenergetics. Indeed, similar to our findings with rotenone (Fig. 3c, d), ROS levels were significantly
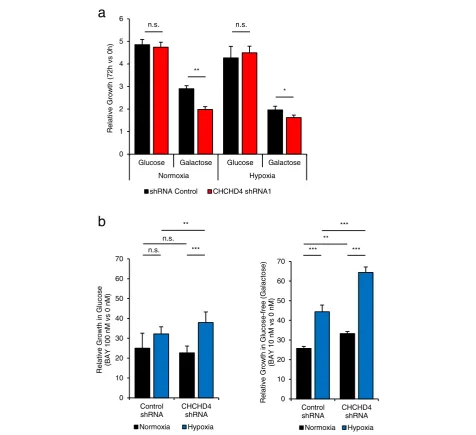
increased in CHCHD4 (WT)-expressing cells compared to control and CHCHD4 (C66A/C68A)-expressing cells in response to BAY 87-2243 treatment, even at a very low dose of 5 nM (Fig.4c, d). Addition of a ROS scaven-ger to rotenone-treated cells has been shown to reduce ROS production and rescue cell death [35]. Here, we found that addition of the ROS scavenger Trolox signifi-cantly reduced ROS levels induced by BAY 87-2243 (Fig. 4c, d) and rotenone (data not shown) and partially rescued the growth inhibitory effect of BAY 87-2243 treatment in CHCHD4 (WT)-expressing cells (Fig. 4e). To examine the growth inhibitory effects of BAY 87-2243 treatment in the context of CHCHD4 loss, we used U2OS cells stably expressing either control shRNA or CHCHD4 shRNA (Fig. 5). We found that CHCHD4 (shRNA) knockdown led to significantly reduced tumour cell growth when cells were cultured in glucose-free (galactose-containing) media (Fig.5a) which forces them to utilise the respiratory chain and produce ATP via OXPHOS [36]. Importantly, we found that CHCHD4 (shRNA) knockdown cells were significantly less sensi-tive to BAY 87-2243 treatment compared to control shRNA cells (Fig. 5b). These data correlate with our findings for CHCHD4 (WT)-expressing cells (Fig. 4e). Collectively, our data indicate that CHCHD4 expression confers increased tumour cell sensitivity to mitochon-drial ROS produced by CI inhibitors.
CHCHD4-mediated HIF-1αinduction is blocked by NSC-134754 without affecting the respiratory chain
Previously, we have shown that CHCHD4 regulates HIF-1αprotein induction and HIF signalling in hypoxia and is required for tumour growth in vivo [3]. Here, we have found that elevated CHCHD4 expression increases tumour cell growth rate (Fig. 2c and Additional file4c) and HIF-1αprotein levels (Additional file 7c, d) in nor-moxia and hypoxia. Thus, next we assessed the contri-bution of HIF signalling to tumour cell growth rate observed in response to elevated CHCHD4 without tar-geting the respiratory chain. To do this, we used a small molecule HIF pathway inhibitor that we previously identi-fied, named NSC-134754 [16]. Additional file 8a shows our revised chemical structure for NSC-134754 [20]. NSC-134754 blocks HIF activity in U2OS cells in nor-moxia and hypoxia within the sub-μM range (IC50
both control and CHCHD4 (WT)-expressing cells in nor-moxia and hypoxia (Fig. 6c–e). Furthermore, we found that elevated HIF-1α and HIF-2α protein induced in CHCHD4 (WT)-expressing in normoxia and hypoxia was blocked by NSC-134754 (Fig. 6f and Additional file 8c). Collectively, our data show that our small molecule HIF signalling inhibitor, NSC-134754, can significantly block CHCHD4-mediated HIF-α protein induction without af-fecting the respiratory chain, highlighting the potential for targeting HIF signalling downstream of CHCHD4 and out-with the mitochondrial respiratory chain (Fig.7).
Discussion
Tumour cells rely on glycolysis and mitochondrial OXPHOS to survive [1]. Thus, mitochondrial metabol-ism has become an increasingly attractive area for inves-tigation and therapeutic exploitation in cancer [2]. OXPHOS inhibitors are coming to the forefront for use in specific cancer types [37]. However, given the import-ance of mitochondrial OXPHOS for controlling intracel-lular oxygenation required for normal physiological processes, delineating whether or how OXPHOS inhibi-tors might provide a therapeutic window in cancer is crucially important.
Here, we provide evidence that CHCHD4 expression in tumour cells is a critical determinant of the mito-chondrial expression of a broad range of respiratory chain subunits including individual subunits of CI, CII, CIII and CIV, some of which are known CHCHD4 substrates (Table 1, Additional file 5 and [8]). These CHCHD4-regulated proteins contain both canonical (twin-CX9C or CX3C) and non-canonical (twin-CXnC)
cysteine motifs, suggesting that CHCHD4 is capable of recognising and introducing disulfide bonds into pro-teins with a more diverse arrangement of cysteines than has previously been described [8]. In addition, we found changes in the mitochondrial expression of proteins pre-viously identified as Mia40 substrates in yeast (e.g. CHCHD1 (Mrp10 in yeast) [38] (Table1)).
Importantly, we found that increased expression of
CHCHD4 or CHCHD4 knockdown increases or
decreases respectively the expression of a number of supernumerary CI subunits involved in CI assembly (Table 1 and Additional file 5, [39]). Our data concur with a previous study showing that targeted deletion of chchd4 in mice results in embryonic lethality by day E8.5, with null embryos displaying severe deficiency in total CI expression, accompanied by less severe defects in total CII-IV expression [28]. Interestingly, we identi-fied at least four accessory CI subunits that are known CHCHD4 substrates (NDUFA8, NDUFB7, NDUFS5 and NDUFB10, Table 1). Three of these accessory CI sub-units NDUFA8, NDUFB7 [40] and NDUFS5 [41] have previously been identified as CHCHD4 substrates with canonical twin CX9C motifs [8], while a fourth subunit
NDUFB10 contains a non-canonical cysteine motif (CX6C-CX11C) (Table1) and has been shown recently to
be mutated in a single case of fatal infantile lactic acid-osis and cardiomyopathy in a way that renders it defect-ive in binding to CHCHD4 [29]. A previous study describing the systematic genetic deletion of each of the 31 CI accessory subunits in cells shows that loss of ei-ther NDUFA8, NDUFB7, NDUFS5 or NDUFB10 has detrimental effects on the expression of other CI sub-units, indicating that each of these CI subunits are strictly required for the assembly of whole CI [39]. Given the role of CHCHD4 import within the IMS, it is par-ticularly interesting that these four accessory subunits of CI all reside within the IMS face of the CI structure [39, 42]. Therefore, it seems likely that CHCHD4 influences whole CI assembly and activity primarily through its ability to import multiple accessory CI subunits that are integrally involved in CI assembly [39]. Indeed, of the 30 nuclear-encoded CI subunits identified in our SILAC analyses (excluding those already confirmed as CHCHD4 substrates), 16 have two or more cysteine resi-dues that could potentially be recognised and oxidised by CHCHD4 (Additional file 5). Intriguingly, we found that mitochondrial expression of the core CI subunit NDUFS3 [39] was also affected by modulation of CHCHD4 expression (Fig. 1 and Additional file 5). NDUFS3 knockdown has been shown to significantly
(See figure on previous page.)
decrease tumour cell proliferation [43], and overexpres-sion of NDUFS3 is associated with breast cancer inva-siveness [44]. NDUFS3 is not a known or putative CHCHD4 substrate (Additional file 5). However, re-duced expression of NDUFS3 [45] and CI subunits as well as other respiratory chain complex defects have
been observed upon loss or knockdown of
apoptosis-inducing factor (AIF) [28, 46]. CHCHD4 has been shown to bind to AIF and is able to restore respira-tory function in AIF-deficient cells [28]. Thus, CHCHD4 may also influence whole CI assembly and activity in tumour cells via other proteins involved in DRS function
independently of its ability to import CI accessory subunits.
Collectively, our data highlight a fundamental relation-ship between CHCHD4 function and CI biology. Target-ing CI as a therapeutic strategy in cancer has recently garnered considerable interest, due in part to the prom-ising anticancer attributes of the antidiabetic drug met-formin and the related biguanidine phenmet-formin [1]. Metformin has been shown to block a variety of cellular and metabolic processes including CI activity [47, 48]. However, targeting respiratory chain components as a therapeutic strategy comes with considerable risk given 0 1 2 3 4 5 6
Glucose Galactose Glucose Galactose
Normoxia Hypoxia ) h 0 s v h 2 7( ht w or G e vit al e R
shRNA Control CHCHD4 shRNA1
n.s. n.s. * ** 0 10 20 30 40 50 60 70 Control shRNA CHCHD4 shRNA Relat ive Grow th in Gluc os e -f ree (Galac to s e ) (B A Y 10 nM vs 0 nM ) Normoxia Hypoxia ** *** *** ***
a
b
0 10 20 30 40 50 60 70 Control shRNA CHCHD4 shRNA e s o c ul G ni ht w or G e vit al e R (BAY 100 nM vs 0 nM ) Normoxia Hypoxia n.s. ** n.s. ***Fig. 5CHCHD4 loss reduces tumour cell sensitivity to CI inhibitors.aGraph shows relative growth of U2OS cells stably expressing shRNA control or CHCHD4 shRNA (CHCHD4 shRNA1) cultured in normoxia or hypoxia in either glucose or glucose-free (galactose) containing media for 72 h.
the importance of the respiratory chain for normal cellular function. Tumour cells with elevated CHCHD4 expression and increased CI subunit ex-pression and activity produced significant levels of mitochondrial ROS (superoxide) upon treatment with CI inhibitors. However, elevated CHCHD4 expression did not render tumour cells more sensitive to growth inhibition by treatment with the CIV inhibitor sodium azide.
CI and CIII are considered the major sites for mito-chondrial ROS (superoxide) production [49]. While we did not measure precisely where mitochondrial ROS (superoxide) was being produced upon CI inhibition in CHCHD4 (WT)-expressing cells, BAY 87-2243 has been shown to block CI without inhibiting CIII [31] and was recently shown to induce mitochondrial ROS through its CI inhibitory activity [34]. Interestingly, a recent study has implicated HIF-1 in the induction of the CI subunit NDUFA4L2 as mechanism to prevent overproduction of ROS during hypoxia [50]. However, we found no change in NDUFA4L2 expression in
response to increased (or decreased) CHCHD4 expres-sion in our SILAC analyses.
Metabolic adaptation to hypoxia in tumours is primar-ily mediated by HIFs and includes the diversion of glucose-derived carbons from the TCA cycle and the conversion of pyruvate to lactate, and by upregulation of the enzymes pyruvate dehydrogenase kinase 1 (PDK1) and LDHA [51,52]. This reduces the reliance of cells on mitochondrial OXPHOS for the production of ATP [52]. Indeed, here and previously, we have shown that ele-vated expression of CHCHD4 in tumour cells increases hypoxic production of cellular lactate [3]. Paradoxically, here we found that elevated CHCHD4 expression in tumour cells leads to significantly reduced levels of cel-lular lactate in normoxia and no significant change in PDK1(data not shown), which is consistent with an in-creased respiratory drive in these cells. It is highly pos-sible that HIF transcriptionally dependent (negative) regulatory effects on mitochondrial function are negated in tumour cells expressing elevated CHCHD4 in normoxia due to CHCHD4's increased drive of
(See figure on previous page.)
Fig. 6CHCHD4-mediated HIF-1αinduction is blocked by NSC-134754 without affecting the respiratory chain.aGraph shows dose-response curve of whole CI activity in the presence of rotenone (black line) and NSC-134754 (green line), using a 10-fold dilution series (top concentration 50μM).bImages of control U2OS cells, CHCHD4 (WT)-expressing cells (WT.cl1), either untreated (NT) or treated with NSC-134754 (1μM) for 3 h. MitoSOX Red ROS indicator (5μM) was added for 30 min prior to live cell imaging by fluorescence microscopy.c,dGraphs show relative growth of control U2OS (control) cells, two independent CHCHD4 (WT)-expressing cell clones (WT.cl1, WT.cl3) and CHCHD4 (C66A/C68A)-expressing cells incubated for 72 h in the absence or presence of NSC-134754 using a 2-fold dilution series (top concentration, 1μM), in either normoxia (c), or hypoxia (1% O2) (d). Data are presented as NSC-134754-treated relative to untreated (0 h).eGraph shows relative growth of control U2OS (control) cells and CHCHD4 (WT)-expressing cell clones (WT.cl1) for 72 h in the absence (−) or presence (+) of NSC-134754 (1μM), in normoxia (black bars) or hypoxia (1% O2, green bars).n= 3, mean ± SD, n.s. not significant, *p< 0.05, **p< 0.01.fWestern blots show HIF-1αand exogenous CHCHD4 (myc) protein from control U2OS and CHCHD4 (WT)-expressing cells (WT.cl1) incubated in normoxia or hypoxia (1% O2) for 8 h in the absence (−) or presence (+) of NSC-134754 (1μM).β-actin was used as load control
mitochondrial function. These observations indicate the possibility that CHCHD4 expression confers a double advantage to proliferating tumour cells by stimulating more efficient glucose utilisation in both the presence and absence of oxygen. Consistent with this idea, we found that tumour cells with elevated CHCHD4 expres-sion exhibit significantly increased proliferative capacity in normoxia and hypoxia, suggesting that CHCHD4 is capable of promoting tumour cell growth and metabolic adaptive responses, potentially through increased re-spiratory drive and HIF-mediated signalling respectively. Indeed, we found that our small molecule inhibitor of HIF signalling NSC-134754 [16, 18–20], which exhibits anti-tumour activity in vivo [18, 53] could significantly block tumour cell growth and HIF-α (HIF-1α and HIF-2α) protein in tumour cells expressing elevated CHCHD4, without mitochondrial respiratory chain involvement.
Conclusions
Mitochondria function as bioenergetic and biosynthetic factories to support cell survival and proliferation and are important regulators of intracellular oxygenation and responses to hypoxia (reviewed [52]). Our present study demonstrates that the mitochondrial protein CHCHD4 controls the mitochondrial expression of a broad range of respiratory chain subunits. This reduces the glycolytic demands of cultured tumour cells and provides a prolif-erative advantage. However, our study also demonstrates that elevated CHCHD4 expression renders tumour cells more sensitive to growth inhibition by CI inhibitors, in part by increasing ROS production. Furthermore, while elevated CHCHD4 increases HIF-α protein induction in hypoxia, this is also sensitive to respiratory chain inhib-ition. Respiratory chain OXPHOS inhibitors may offer a potential therapeutic route for the treatment of tumours with increased proliferative drive, but this comes with a significant risk of toxicity. Our study shows that our HIF pathway inhibitor NSC-134754 potently inhibits the growth of tumour cells with elevated CHCHD4 expres-sion, without influencing mitochondrial function or ROS production. Further exploration of the mechanism of ac-tion of NSC-134754 will be particularly interesting.
Additional files
Additional file 1:CHCHD4 siRNA and CHCHD4 shRNA sequences. (PDF 86 kb)
Additional file 2:Q-PCR primer sequences. (PDF 141 kb)
Additional file 3:Impact of CHCHD4 on the mitochondrial proteome. (PDF 323 kb)
Additional file 4:CHCHD4 promotes basal and adaptive metabolic responses and provides a proliferative advantage to tumour cells. (PDF 17 kb)
Additional file 5:CHCHD4-mediated changes in the expression of nuclear-encoded CI subunits identified using SILAC analysis. (PDF 231 kb)
Additional file 6:CHCHD4 expression confers increased tumour cell sensitivity to CI inhibitors. (PDF 259 kb)
Additional file 7:CHCHD4 promotes mitochondrial ROS production in response to CI inhibition. (PDF 240 kb)
Additional file 8:CHCHD4-mediated HIF-αprotein induction is blocked by NSC-134754 without affecting the respiratory chain. (PDF 219 kb)
Acknowledgements
Thanks to all members of the Ashcroft laboratory, especially Rachel Morgan for technical support. We thank C. Frezza, P. Maxwell and members of the MRC MBU for their interest in this study.
Funding
LWT was funded by Medical Research Council (MRC) grants (MR/K002201/1 and MR/K002201/2) to MA. JS and HAH were funded by MRC Doctoral Training awards (RG70550 and RG86932) to MA. CE and AA were funded by Cancer Research UK (CR-UK) awards (C7358/A8020 and C7358/A19442) to MA.
Availability of data and materials
Requests can be made to the corresponding author relating to materials generated in this study.
Authors’contributions
LWT designed and performed the experiments, analysed the data and contributed to writing the manuscript. JS generated the stable CHCHD4 (shRNA) HCT116 and U2OS knockdown cell lines and designed and performed the SILAC experiments. CE designed and performed the CI inhibitor experiments and whole CI assays and analysed data. SH and RA assisted with the SILAC analysis. AA and HAH contributed to the NSC-134754 inhibitor experiments. MA provided the concept for the study, designed the experiments, analysed the data, wrote the manuscript and acquired the funding. All authors edited and reviewed the manuscript. All authors read and approved the final manuscript.
Authors’information
Not applicable.
Ethics approval and consent to participate
This study did not involve human participation, personal data or use of human tissue.
Consent for publication
Not applicable.
Competing interests
The authors declare that they have no competing interests.
Publisher’s Note
Springer Nature remains neutral with regard to jurisdictional claims in published maps and institutional affiliations.
Author details
1Department of Medicine, University of Cambridge, Cambridge Biomedical
Campus, Cambridge CB2 0AH, UK.2Cambridge Institute for Medical Research,
University of Cambridge, Cambridge Biomedical Campus, Cambridge CB2 0XY, UK.3Present address: Department of Molecular Life Sciences, University
of Zurich, Winterthurerstrasse 190, CH-8057 Zurich, Switzerland.4Present
address: AstraZeneca Ltd., Cambridge, UK.
Received: 2 January 2019 Accepted: 5 February 2019
References
1. Weinberg SE, Chandel NS. Targeting mitochondria metabolism for cancer therapy. Nat Chem Biol. 2015;11(1):9–15.
3. Yang J, et al. Human CHCHD4 mitochondrial proteins regulate cellular oxygen consumption rate and metabolism and provide a critical role in hypoxia signaling and tumor progression. J Clin Invest. 2012;122(2): 600–11.
4. Thomas LW, et al. CHCHD4 regulates intracellular oxygenation and perinuclear distribution of mitochondria. Front Oncol. 2017;7:71. 5. Erdogan AJ, Riemer J. Mitochondrial disulfide relay and its substrates:
mechanisms in health and disease. Cell Tissue Res. 2017;367(1):59–72. 6. Chatzi A, Manganas P, Tokatlidis K. Oxidative folding in the mitochondrial
intermembrane space: a regulated process important for cell physiology and disease. Biochim Biophys Acta. 2016;1863(6 Pt A):1298–306.
7. Backes S, Herrmann JM. Protein translocation into the intermembrane space and matrix of mitochondria: mechanisms and driving forces. Front Mol Biosci. 2017;4:83.
8. Petrungaro C, et al. The Ca(2+)-dependent release of the Mia40-induced MICU1-MICU2 dimer from MCU regulates mitochondrial Ca(2+) uptake. Cell Metab. 2015;22(4):721–33.
9. Longen S, et al. Systematic analysis of the twin cx(9)c protein family. J Mol Biol. 2009;393(2):356–68.
10. Modjtahedi N, et al. Mitochondrial proteins containing coiled-coil-helix-coiled-coil-helix (CHCH) domains in health and disease. Trends Biochem Sci. 2016;41(3):245–60.
11. Bihlmaier K, et al. The disulfide relay system of mitochondria is connected to the respiratory chain. J Cell Biol. 2007;179(3):389–95.
12. Banci L, et al. MIA40 is an oxidoreductase that catalyzes oxidative protein folding in mitochondria. Nat Struct Mol Biol. 2009;16(2):198–206. 13. Chacinska A, et al. Mitochondrial biogenesis, switching the sorting pathway
of the intermembrane space receptor Mia40. J Biol Chem. 2008;283(44): 29723–9.
14. Hofmann S, et al. Functional and mutational characterization of human MIA40 acting during import into the mitochondrial intermembrane space. J Mol Biol. 2005;353(3):517–28.
15. Fischer M, et al. Protein import and oxidative folding in the mitochondrial intermembrane space of intact mammalian cells. Mol Biol Cell. 2013;24(14): 2160–70.
16. Chau NM, et al. Identification of novel small molecule inhibitors of hypoxia-inducible factor-1 that differentially block hypoxia-hypoxia-inducible factor-1 activity and hypoxia-inducible factor-1alpha induction in response to hypoxic stress and growth factors. Cancer Res. 2005;65(11):4918–28.
17. Bunz F, et al. Disruption of p53 in human cancer cells alters the responses to therapeutic agents. J Clin Invest. 1999;104(3):263–9.
18. Baker LC, et al. The HIF-pathway inhibitor NSC-134754 induces metabolic changes and anti-tumour activity while maintaining vascular function. Br J Cancer. 2012;106(10):1638–47.
19. Carroll VA, Ashcroft M. Role of hypoxia-inducible factor (HIF)-1alpha versus HIF-2alpha in the regulation of HIF target genes in response to hypoxia, insulin-like growth factor-I, or loss of von Hippel-Lindau function: implications for targeting the HIF pathway. Cancer Res. 2006;66(12):6264–70. 20. Hickin JA, et al. The synthesis and structure revision of NSC-134754. Chem
Commun (Camb). 2014;50(10):1238–40.
21. Venegas V, Halberg MC. Measurement of mitochondrial DNA copy number. Methods Mol Biol. 2012;837:327–35.
22. Ritchie ME, et al. Limma powers differential expression analyses for RNA-sequencing and microarray studies. Nucleic Acids Res. 2015;43(7):e47. 23. Zhao S, et al. The application of SILAC mouse in human body fluid
proteomics analysis reveals protein patterns associated with IgA nephropathy. Evid Based Complement Alternat Med. 2013;2013:275390. 24. Howden AJ, et al. QuaNCAT: quantitating proteome dynamics in primary
cells. Nat Methods. 2013;10(4):343–6.
25. Hafner M, et al. Growth rate inhibition metrics correct for confounders in measuring sensitivity to cancer drugs. Nat Methods. 2016;13(6):521–7. 26. Briston T, et al. VHL-mediated regulation of CHCHD4 and mitochondrial
function. Front Oncol. 2018;8:388.
27. Modjtahedi N, Kroemer G. CHCHD4 links AIF to the biogenesis of respiratory chain complex I. Mol Cell Oncol. 2016;3(2):e1074332.
28. Hangen E, et al. Interaction between AIF and CHCHD4 regulates respiratory chain biogenesis. Mol Cell. 2015;58(6):1001–14.
29. Friederich MW, et al. Mutations in the accessory subunit NDUFB10 result in isolated complex I deficiency and illustrate the critical role of
intermembrane space import for complex I holoenzyme assembly. Hum Mol Genet. 2017;26(4):702–16.
30. Vinogradov AD, Grivennikova VG. Oxidation of NADH and ROS production by respiratory complex I. Biochim Biophys Acta. 2016;1857(7):863–71. 31. Ellinghaus P, et al. BAY 87-2243, a highly potent and selective inhibitor of
hypoxia-induced gene activation has antitumor activities by inhibition of mitochondrial complex I. Cancer Med. 2013;2(5):611–24.
32. Helbig L, et al. BAY 87-2243, a novel inhibitor of hypoxia-induced gene activation, improves local tumor control after fractionated irradiation in a schedule-dependent manner in head and neck human xenografts. Radiat Oncol. 2014;9:207.
33. Schockel L, et al. Targeting mitochondrial complex I using BAY 87-2243 reduces melanoma tumor growth. Cancer Metab. 2015;3:11. 34. Basit F, et al. Mitochondrial complex I inhibition triggers a
mitophagy-dependent ROS increase leading to necroptosis and ferroptosis in melanoma cells. Cell Death Dis. 2017;8(3):e2716.
35. Li N, et al. Mitochondrial complex I inhibitor rotenone induces apoptosis through enhancing mitochondrial reactive oxygen species production. J Biol Chem. 2003;278(10):8516–25.
36. Crabtree HG. The carbohydrate metabolism of certain pathological overgrowths. Biochem J. 1928;22(5):1289–98.
37. Molina JR, et al. An inhibitor of oxidative phosphorylation exploits cancer vulnerability. Nat Med. 2018;24(7):1036–46.
38. Longen S, et al. The disulfide relay of the intermembrane space oxidizes the ribosomal subunit mrp10 on its transit into the mitochondrial matrix. Dev Cell. 2014;28(1):30–42.
39. Stroud DA, et al. Accessory subunits are integral for assembly and function of human mitochondrial complex I. Nature. 2016;538(7623):123–6. 40. Szklarczyk R, et al. NDUFB7 and NDUFA8 are located at the intermembrane
surface of complex I. FEBS Lett. 2011;585(5):737–43.
41. Angerer H, et al. A scaffold of accessory subunits links the peripheral arm and the distal proton-pumping module of mitochondrial complex I. Biochem J. 2011;437(2):279–88.
42. Zhu J, Vinothkumar KR, Hirst J. Structure of mammalian respiratory complex I. Nature. 2016;536(7616):354–8.
43. He X, et al. Suppression of mitochondrial complex I influences cell metastatic properties. PLoS One. 2013;8(4):e61677.
44. Suhane S, Berel D, Ramanujan VK. Biomarker signatures of mitochondrial NDUFS3 in invasive breast carcinoma. Biochem Biophys Res Commun. 2011; 412(4):590–5.
45. Shen SM, et al. AIF inhibits tumor metastasis by protecting PTEN from oxidation. EMBO Rep. 2015;16(11):1563–80.
46. Meyer K, et al. Loss of apoptosis-inducing factor critically affects MIA40 function. Cell Death Dis. 2015;6:e1814.
47. Liu X, et al. Metformin targets central carbon metabolism and reveals mitochondrial requirements in human cancers. Cell Metab. 2016;24(5): 728–39.
48. Wheaton WW, et al. Metformin inhibits mitochondrial complex I of cancer cells to reduce tumorigenesis. Elife. 2014;3:e02242.
49. Sena LA, Chandel NS. Physiological roles of mitochondrial reactive oxygen species. Mol Cell. 2012;48(2):158–67.
50. Tello D, et al. Induction of the mitochondrial NDUFA4L2 protein by HIF-1alpha decreases oxygen consumption by inhibiting complex I activity. Cell Metab. 2011;14(6):768–79.
51. Nakazawa MS, Keith B, Simon MC. Oxygen availability and metabolic adaptations. Nat Rev Cancer. 2016;16(10):663–73.
52. Thomas LW, Ashcroft M. Exploring the molecular interface between hypoxia-inducible factor signalling and mitochondria. Cell. Mol. Life Sci. 2019.https://doi.org/10.1007/s00018-019-03039-y.