Chemical profiling of ancient hearths reveals recurrent
salmon use in Ice Age Beringia
Kyungcheol Choya,b,1, Ben A. Potterc,1, Holly J. McKinneyc, Joshua D. Reutherc, Shiway W. Wangd, and Matthew J. Woollera,b,1
aWater and Environmental Research Center, Institute of Northern Engineering, University of Alaska Fairbanks, Fairbanks, AK 99775;bAlaska Stable Isotope Facility, School of Fisheries and Ocean Sciences, University of Alaska Fairbanks, Fairbanks, AK 99775;cDepartment of Anthropology, University of Alaska Fairbanks, Fairbanks, AK 99775; anddSedna Ecological, Inc., Anchorage, AK 99524
Edited by Dolores R. Piperno, Smithsonian Institution, Fairfax, VA, and approved July 5, 2016 (received for review April 18, 2016)
Current approaches to reconstruct subsistence and dietary trends in ancient hunter-gatherer societies include stable isotope analyses, but these have focused on human remains, cooking pottery, and food residues, which are relatively rare in the archaeological record. In contrast, short-term hearths are more ubiquitous worldwide, and these features can provide valuable evidence for ancient subsistence practices, particularly when faunal remains are not preserved. To test the suitability of hearths for this purpose, we conducted mul-tiple chemical analyses: stable carbon and nitrogen isotope analyses of total organic matter (expressed asδ13C and δ15N values) and
compound-specific carbon isotope analyses of individual fatty acids (δ13C
16:0 andδ13C18:0) from 17 well-preserved hearths present in
three occupations dating between∼13,200–11,500 calibrated years B.P. at the Upward Sun River (USR) site in central Alaska. We com-binedδ15N andδ13C
FAdata in a Bayesian mixing model (stable
iso-tope analysis in R) with concentration dependency to each hearth. Our model values were tested against faunal indices, indicating a strong positive relationship between marine proportional contribu-tions to each hearth and salmon abundance. Results of the models show substantial anadromous salmon use in multiple USR compo-nents, indicating recurrent use of the site for salmon processing during the terminal Pleistocene. Our results demonstrate that sal-monid and freshwater resources were more important for late Pleis-tocene hunter-gatherers than previously thought and highlight the potential of chemical profiling of hearth organic residues for pro-viding greater geographic and temporal insights into resource use by prepottery societies.
stable isotopes
|
hearths|
organic residue analysis|
GC-combustion-IRMS|
BeringiaI
nferences on ancient hunter-gatherer subsistence economies generally rely on zooarchaeologically derived abundance mea-sures from sites with faunal preservation (1); however, these sites can be rare in late-Pleistocene deposits (2). Chemical profiling using compound-specific stable isotope analyses can provide an-other approach to reconstruct resource use and have been used to study food residues on pottery (3–8). These isotopic studies have provided insights into the proportional contributions of different food resources to human diets, particularly aquatic vs. terrestrial food sources. However, most hunter-gatherer societies did not use pottery, which is limited to<4,500 calibrated (cal) y B.P. in North America (9, 10). Thus, organic residue analysis has had limited application to the research of prepottery hunter-gatherer societies in North America.Analyses of hearth sediments can inform us about mobility, subsistence behaviors, and activity areas of hunter-gatherer so-cieties (11, 12). Recent analyses of burned residues in hearths have demonstrated their value for exploring associated food use; however, these investigations have focused on examining the use of animal bone and marine animal blubber for fuel and lighting at locations proximal to coastal environments (13–15). Most other dietary studies of resource use on hearths have involved zooarch-aeological measures of abundance [i.e., number of identified
specimens (NISP) and minimum number of individuals] (16). These measures likely underestimate certain taxa, particularly fish and small mammals, because of taphonomic issues (e.g., sediment pH, leaching, burning, compaction, and microbial action). For example, fish bones are more likely to be underrepresented com-pared with mammal bones because of differences in bone structure (17–20). Furthermore, many sites have variable faunal preserva-tion, limiting these more traditional zooarchaeological approaches. We addressed these limitations by using a combined approach of stable isotope and zooarchaeological analyses of hearth sediments at the Upward Sun River (USR) site. The USR site is located in loess deposits on a sand dune south of the Tanana River in central Alaska (Fig. 1), and details on its geology and chronology have been described (21–23). The site is well stratified with three major components: Component 1 (13,200 cal y B.P.) contains 2 hearth features and associated well-preserved fauna; component 2 (11,800 cal y B.P.) contains 4 hearths but few preserved fauna; and com-ponent 3 (11,500 cal y B.P.) contains 11 hearths, including 1 hearth within a residential feature associated with the burial of two infants (22) and a child cremation (21) (SI Materials and Methods). Faunal analyses indicated that the remains accumulated during processing/ cooking/disposal events within the hearths (21, 22), and genetic analyses provided evidence for the presence of the salmonids that were marine (anadromous) chum salmon (Oncorhynchus keta) (23). Thus, USR offers important controls to evaluate proportional contributions of terrestrial, freshwater, and marine food resources reconstructed through chemical profiling of hearth sediments.
We present chemical analyses of dietary biomarkers from 17 terminal Pleistocene-Age hearths from component 1 (n = 2), component 2 (n=4), and component 3 (n=11) at USR (Fig. 1 and
Significance
Reconstructing subsistence practices of ancient hunter-gatherers requires quantitative data on food resources, which rarely pre-serve. Here we use chemical profiling of hearth sediments from three Ice Age occupations in Alaska (13,200–11,500 years ago), including compound-specific stable isotope analyses and a Bayesian mixing model, to estimate proportional contributions of marine (salmon), freshwater, and terrestrial resources. The model is verified through zooarchaeological analyses and dem-onstrates the importance of salmonid and freshwater resources to these early Americans. Our study also provides evidence for the earliest use of salmon in the Americas.
Author contributions: K.C., B.A.P., and M.J.W. designed research; K.C., B.A.P., H.J.M., and M.J.W. performed research; K.C., B.A.P., H.J.M., and M.J.W. contributed new reagents/ analytic tools; K.C., B.A.P., H.J.M., J.D.R., S.W.W., and M.J.W. analyzed data; and K.C., B.A.P., H.J.M., J.D.R., S.W.W., and M.J.W. wrote the paper.
The authors declare no conflict of interest.
This article is a PNAS Direct Submission.
1To whom correspondence may be addressed: Email: kchoy@alaska.edu, mjwooller@
alaska.edu, or bapotter@alaska.edu.
This article contains supporting information online atwww.pnas.org/lookup/suppl/doi:10. 1073/pnas.1606219113/-/DCSupplemental.
www.pnas.org/cgi/doi/10.1073/pnas.1606219113 PNAS | August 30, 2016 | vol. 113 | no. 35 | 9757–9762
ANT
Table S1). Our aim was to determine the proportional contri-bution of terrestrial, freshwater, and marine (salmon) resources. Previous zooarchaeological studies have shown that early Eastern Beringians had a broad-spectrum economy, incorporating large and small mammals, birds, and fish (22, 24, 25), but proportional data are lacking. This study provides quantitative estimates of early Beringian resource use at a residential camp. We directly measured the δ13C and δ15N values of total organic matter in hearths to identify marine resource processing (26) and extracted lipids to measure theδ13C values of individual fatty acids (FAs) present, which have been used to discriminate terrestrial vs. ma-rine sources using organic residues from pottery (5, 7). We used an isotope mixing model [stable isotope analysis in R (SIAR); SI Materials and Methods] to estimate the proportional contribu-tion of different food-resource categories to each hearth (27). We generated this model using data from modern animal species from central Alaska and zooarchaeological remains from USR to infer the potential food resources used by the terminal Pleistocene hunter-gatherers that were present at the USR site. We also tested our model using a zooarchaeologically derived salmon index for eight hearths from component 3.
Results
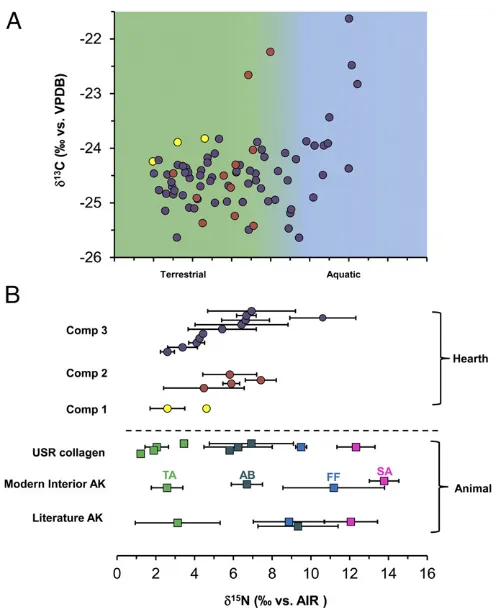
Bulk stable isotope values of modern muscle tissues were sig-nificantly different inδ13C values (Kruskal–Wallis ANOVA,χ2= 17.025, df = 2, P < 0.001) and δ15N values (Kruskal–Wallis ANOVA,χ2=15.096, df=2,P<0.001) among the terrestrial, freshwater, and marine food groups (Fig. 2 andTable S2). Marine (anadromous salmon) samples had higher δ15N values (13.8 ± 0.7‰) compared with freshwater (9.7± 3.1‰) and terrestrial food groups (2.6±0.8‰). The terrestrial food group had lower δ15N values than the freshwater and marine (salmon) food groups
(P<0.001).δ15N values clearly separated marine (salmon) from the terrestrial food groups. However, the range ofδ15N values of the freshwater food group (11.8±3.0‰) overlapped with salmon (13.8 ± 0.7‰). To separate the salmon and freshwater food groups, we compared the δ13C
FA values (δ13C16:0 and δ13C18:0) from all three food groups (Table S2). We found significant dif-ferences inδ13C16:0(Kruskal–Wallis ANOVA,χ2=12.812, df=2, P< 0.001) andδ13C18:0 (Kruskal–Wallis ANOVA,χ2 =13.791, df=2,P<0.001) values among the three food groups. Marine (anadromous salmon) had higherδ13C16:0andδ13C18:0values (δ13C16:0:−27.4±1.1‰,δ13C18:0:−25.8±1.1‰) compared with freshwater (δ13C
16:0: −34.4 ± 3.6‰, δ13C18:0: −33.8 ± 3.2‰) and terrestrial food groups (δ13C16:0:−31.1 ±2.4‰, δ13C18:0: −31.1 ± 2.1‰). The freshwater food group had lowerδ13C16:0 andδ13C18:0 values than the marine (salmon) and terrestrial food groups (multiple comparison post hoc test, P<0.001). The δ13C16:0 and δ13C18:0values clearly separated freshwater resources from the salmon resources (Fig. 3), which were not feasible usingδ15N values alone.δ13C andδ15N values of bone collagen from the faunal samples taken from the cremation hearth F2010-5 are shown in Fig. 2 andTable S3, and these faunal remains included terrestrial animals, aquatic birds, and salmon. Our isotopic data show that there is an isotopic fractionation (∼3.5‰) between modern muscle and ancient bone collagen samples associated with δ13C values, but δ15N values of ancient species are similar to modern anadromous salmon, aquatic bird, and terrestrial food groups (Fig. S1).
The bulkδ13C andδ15N values for USR hearths are shown in Fig. 2 andTable S1. We compared bulk δ13C andδ15N values between USR hearths and the three different food groups and found significant differences inδ13C (Kruskal–Wallis ANOVA, χ2=39.660, df=3,
P<0.001) andδ15N values (Kruskal–Wallis ANOVA, χ2 = 31.231, df = 3, P < 0.001). USR hearths had higherδ13C values (−24.0±0.9‰) than the freshwater (−28.4± 3.6‰) and terrestrial food groups (−23.8±1.3‰), but lower values compared with the marine (anadromous salmon) food group (−20.1±1.4‰). USR hearths had higherδ15N values (6.5± 3.0‰) than the terrestrial food group (2.6±0.8‰), but lower δ15N values than freshwater (9.7±3.1‰) and salmon (13.8± 0.7‰) food groups. We also compared bulk isotope values among 17 USR hearths and found significant differences in δ15N (P<0.001), but not inδ13C (P=0.100), values (Fig. S2). Most hearths had elevated δ15N values relative to nonhearth control samples (meanδ15N value=−0.8‰) in the same strati-graphic layers from three separate blocks (blocks M, Y, and Z). Most hearths had similarδ15N values from the center to the edges of hearth with a mean range of∼2‰(Fig. S3A). There was a clear difference in δ15N values between top and bottom layers. δ15N values in the bottom, oxidized layer of measured hearths were slightly higher (mean 2.3‰) than the top layer of hearths (Table S4).δ15N values of samples extending beyond the hearth F2013-09 had very similar values in the edge of the hearth (Fig. S3B).
The organic residues from hearths at the USR site contained a significant amount of extractable lipids, consisting almost en-tirely of free and esterified FAs identified by their FA methyl ester mass spectra (Fig. S4). The most abundant constituents were even and odd carbon-number long-chain saturated FAs (C14:0 to C26:0) with hexadecanoic acid (C16:0) dominating over octadecanoic (C18:0) acids. Significant amount of unsatu-rated FAs (C16:1, C18:1, and C18:2) were also detected, with octadecenoic (C18:1) acids present in high abundance. Iso-prenoid FAs (4,8,12-TMTD, pristanic acid, and phytanic acid) and other FAs [long-chainω-(o-alkylphenyl) alkanoic acids, and dihydroxy FAs] used as marine biomarkers (3–8, 43) were absent from the USR hearths.
Theδ13C16:0andδ13C18:0values from the USR hearths were measured to discriminate between marine and freshwater food
Fig. 1. Location map of the study site in central Alaska (inset) and the distribution of hearths in component 3 (A) and components 1 and 2 (B) in the USR site.
groups, which could not be achieved usingδ15N values alone. We compared δ13C values of two FAs (δ13C16:0 and δ13C18:0) be-tween the USR hearths and the three different food groups. We found significant differences inδ13C16:0values (Kruskal–Wallis ANOVA,χ2 =21.208, df =3, P <0.001) and δ13C18:0 values (Kruskal–Wallis ANOVA,χ2=27.627, df=3,P<0.001) from the hearths and relative to the three food groups (Fig. 3 and Table S5). USR hearths had higherδ13C16:0andδ13C18:0values (δ13C16:0: −30.9 ± 0.6‰, δ13C18:0: −29.1 ± 0.8‰) than the freshwater (δ13C16:0:−34.4± 3.6‰, δ13C18:0:−33.8± 3.2‰) and terrestrial food groups (δ13C16:0:−31.1 ±2.4‰, δ13C18:0: −31.1± 2.1‰), but lower than anadromous salmon (δ13C16:0: −27.4±1.2‰,δ13C18:0:−25.8±1.1‰). Combinedδ13C16:0and δ13C18:0values from the USR hearths showed that the hearths distributed between salmon and terrestrial food groups (Fig. 3).
We used theδ15N,δ13C
16:0, andδ13C18:0values from hearths and food groups in a SIAR mixing model to estimate the pro-portional contribution of terrestrial, freshwater, and marine food groups (Fig. 4). The model outputs and ranges of contributions of each food group to the USR hearths revealed that hearth residues represented a wide range of contributions from the terrestrial (10–75%) and marine (anadromous salmon) food groups (4–64%) (Fig. 4 and Table S6). Estimates of the pro-portional contributions of anadromous salmon to hearths based on the model were positively correlated with contribution of the freshwater food group (r = 0.665, P < 0.001), but negatively correlated with the contribution of the terrestrial food group (r=
−0.978, P < 0.001). Three hearths (F2014-06, F2013-20, and
F2013-09) in component 3 had the highest contribution of salmon (≥45%), and one hearth (F2010-06) in component 2 had the highest contribution of salmon (31%) compared with other hearths from that component.
We identified 14,481 faunal NISP and 759 human NISP within the hearths, the latter from the cremation hearth (F2010-05), and all were generally small, highly fragmented calcined bone fragments (Table S7). Most of these fragments could not be recovered by using 1/8” (3.2-mm) mesh typically used in ar-chaeological excavations. No fish were recovered from compo-nents 1 and 2, yielding Salmonidae indices of 0. Component 3 hearths contained variable presence of Salmonidae, yielding Sal-monidae indices between 0 and 19.5 (Table S7). There was a strong positive correlation between Salmonidae abundance derived from the faunal remains and the marine proportional abundance derived from the SIAR mixing model (r=0.880,P<0.001) (Fig. 5). This relationship demonstrates the utility of the hearth sediments for chemical profiling to track salmon abundance.
Discussion
Our stable isotope data (δ15N, δ13C16:0, andδ13C18:0 values) in-dicate that aquatic animals (salmon and freshwater) were impor-tant food resources at the USR site at the Pleistocene/Holocene transition (Fig. 4). These results are significant in terms of
Fig. 2. Bulkδ13C andδ15N values from hearths in component 1 (yellow circle), component 2 (orange circle), and component 3 (dark circle) from USR site. (A) Distribution ofδ15N values of components 1, 2, and and 3 in USR hearths and reference samples. (B) Animal muscles from Alaska in literature (28–36), from modern interior Alaska (in this study), and bone collagen from USR fauna (in this study), and other ancient salmon in Alaska (23, 37–39). AB, aquatic bird (red square); FF, freshwater fish (blue square); SA, salmon (pink square); TA, terrestrial animals (green square).
Fig. 3. δ13C
16:0andδ13C18:0values of lipids from USR hearth residues and modern reference animals (A) andδ15N vs.δ13C
18:0values from USR hearths and modern animals in Alaska (B). AB, aquatic bird; FF, freshwater fish; SA, salmon; TA, terrestrial animals. To allow comparisons between modern and archaeological data,δ13C values of all modern samples were adjusted for the addition of the effects of postindustrial carbon (Table S2and refs. 40–42).
Choy et al. PNAS | August 30, 2016 | vol. 113 | no. 35 | 9759
ANT
understanding the nature of salmon exploitation at USR com-ponent 3, as well as broader subsistence and seasonal patterns of early Beringians. Within component 3, six of the nine analyzed hearths (67%) contained Salmonidae at varying proportions. The hearths with the highest relative number of salmonids have the highest marine contribution estimated by using the stable isotope mixing model, further indicating that these were anad-romous salmon (Figs. 4 and 5). This finding suggests more ex-tensive use of salmon at multiple hearths in component 3. The variation in salmon processing based on chemical profiling and zooarchaeological analyses across the occupation suggests three distinct activity areas: (i) salmon processing/disposal in hearths surrounding the central residential feature (24–68% marine); (ii) terrestrial mammal processing/disposal in the hearth cluster to the west (5–10% marine); and (iii) both mammal and salmon processing within the central hearth (F2010-05) of the residential feature (9% marine) (Fig. 4). This central hearth yielded rela-tively low δ15N values compared with neighboring hearths, de-spite salmon remains (22); however, this result is likely due to the larger relative contribution of terrestrial animals, including the human cremation (Figs. 4 and 5). Our chemical evidence for salmon/freshwater resource exploitation at the USR site is sup-ported by the zooarchaeological data (this study) and genetic data from the fish bones, indicating large salmonids such as
anadromous chum salmon (Oncorhynchus keta) (23). Because we observed multiple cranial and vertebrate parts within USR hearths, we suggest that the salmon were captured in low quantities and were consumed on site rather than dried/cached for later consumption. Thus, detritus from cooking and con-sumption activities adjacent to the hearths were incorporated into hearth sediments.
The results from the SIAR mixing model for component 2 hearths (Figs. 4 and 5) suggest that anadromous salmon were present at similarly high marine proportional values for all four hearths (19–31%) as Component 3 hearths containing salmo-nids. The faunal record of component 2 is markedly different from Component 3; there are few identifiable fauna present in the hearths (95 total NISP within two hearths, whereas the other hearths yielded no identifiable fauna) (Table S7). The similari-ties in high marine chemical signatures between components 2 and 3 are supported in part by similar hearth morphologies and content. In the Component 2 hearths, fauna is limited to burned remains disposed directly within hearths, which contrast with more typical hunting camp hearths in the region that did not contain bone-rich mealy concentrations within hearth matrices but did contain numerous low-yield large mammal elements scattered within and between hearths (24). Component 1 fauna are well-preserved, but no fish have been identified. The fauna are dominated by waterfowl and mammals (44). The very low SIAR mixing model estimates of the proportional contribution of salmon to these hearths (4–11%, with 95% CI overlapping with 0%) are consistent with the faunal data suggesting little or no salmon presence in this earliest occupation.
Intrahearth horizontal distributions ofδ15N values were con-sistent across each hearth (±1.8‰) (Fig. S3A). This pattern suggests that most USR hearths were used for specific activities. However, one hearth (F2013-20) had a wide range ofδ15N values (4.8–10.7‰), indicating that it was associated with a wide range of different food resources. Intrahearth vertical variation in δ15N values may reflect some thermal variation of organic residues within each hearth. Bottom oxidized sediments had higherδ15N values (mean 2.3‰) than the upper bone-rich layers. This finding may be associated with the concentration of organic molecules in bottom-oxidized layers by leaching or taphonomic process after cooking events. In addition,δ15N values of extended occupation surfaces beyond hearths F2013-09 are similar to the hearth values (Fig. S3), indicating similar food-processing activities.
Interpreting chemical analysis of organic residues in hearths can be problematic because of the potential influences of diagenic
Fig. 4. The proportional contribution of three different food groups (ter-restrial, freshwater, and salmon) to hearths in component 3 (A) and com-ponents 1 and 2 (B) in USR site. The pie chart represents mean values of the proportional contribution in case of multiple measured hearths and the contri-bution of hearth F2010-09 is estimated mean value based on only bulkδ15N values. Three hearths (F2014-06, F2013-20, and F2013-09) in component 3 (≥45%) and one hearth (F2010-06) in component 2 (31%) have the highest contribution of salmon. There are three distinct activity areas in component 3: (i) salmon processing/disposal in hearths, (ii), terrestrial mammal processing/disposal, and (iii) both mammal and salmon processing at the indoor hearth F2010-05.
Fig. 5. Relationship between Salmonidae index values and the marine percent contribution (mean and 1 SD) in the SIAR model for each component 3 hearth.
agents, including thermal and microbial degradation (45). Food resources in hearths can also be difficult to discriminate because of the potential for admixture of fuel charcoal. Most previous studies have focused on the FA profiles, lipid biomarkers (13, 14), and δ13C values of FAs from hearth residues (15, 46). Our bulkδ13C values from all USR hearths were similar among all USR hearths (Fig. S1), and this result likely reflects the mixture of other carbon inputs into hearths, including fuel wood and the proportion of bone. However, ourδ15N data can separate animal-derived resources from the influence of wood charcoals and plant seeds. Fuel charcoals in hearths are unlikely to be a substantial contribution to the total nitrogen in the hearths because wood contains a negligible amount of nitrogen relative to animal resources. Our findings are consistent with analyses of modern archaeological sediments from a site on an Alaska island, where relatively highδ15N values discriminated fish-processing areas from other activity areas at the site (26). Our re-search shows that by couplingδ15N data withδ13C values of two individual FAs (δ13C16:0 and δ13C18:0) from hearths, we could provide estimates of the proportional contribution of marine (anadromous salmonid), freshwater, and terrestrial resources to these hearths at an inland site (>1,000 km from coastal envi-ronments), where fish remains are not well preserved.
The inference of anadromous salmon use at component 2 rep-resents the earliest evidence of salmon exploitation in the Amer-icas, at∼11,800 cal y B.P., during the Younger Dryas. Collectively, components 2 and 3 data indicate patterned, recurrent use of the area for seasonal anadromous salmon fishing and processing and that aquatic resources were more important than previously thought during the Late Pleistocene-Early Holocene transition. Our findings reveal that analysis of organic residues from hearth sediments can have great utility for reconstructing dietary trends and subsistence practices among mobile hunter-gatherers, particularly in contexts where faunal remains are poorly preserved.
Materials and Methods
We collected hearth samples (∼1g) from 17 archaeological hearths from three components at the USR site (Table S1). We also sampled from hori-zontal locations in a subset of hearths and in adjacent activity areas to in-vestigate horizontal variation, and we sampled stratigraphic layers to investigate vertical variation within hearths (top, bone-rich, 10YR 3/6, layer; middle, charcoal-rich, 10YR 3/1, layer; bottom, oxidized, 5YR 2.5/2 layer) (Fig. S3B). For control samples, we included nonhearth sediments from the same stratigraphic layers as the hearths, but distant from any cultural material
(Table S1andFig. S2). Comparative data for potential food resources were derived from: (i) 23 muscle samples from 16 modern species of fauna from central Alaska (Table S2), and (ii) 21 bone collagen samples representing 10 faunal species from USR components 1 and 3 (Table S3).
Bulkδ13C andδ15N values from analyses of hearth sediment, bone colla-gen, and muscle tissue samples were measured at the Alaska Stable Isotope Facility (ASIF), University of Alaska Fairbanks, following established proto-cols (ref. 37 andSI Materials and Methods). Lipids in hearth and muscle samples were extracted by using standard protocols (refs. 43, 47, and 48 and
SI Materials and Methods). The lipid profile of each FAME product was
identified by gas chromatography-mass spectrometry (GC-MS), andδ13C val-ues of two individual FAs (C16:0 and C18:0) from hearth and muscle samples were analyzed by GC-combustion-isotope ratio spectrometer (GC-C-IRMS) at ASIF (SI Materials and Methods).
We categorized food resources into three food groups: marine (anadro-mous salmon), freshwater (i.e., freshwater fish and aquatic birds, e.g., mal-lard, teal, wigeon, and goose), and terrestrial (i.e., terrestrial mammals and terrestrial birds, e.g., spruce grouse and ruffed grouse). A nonparametric Kruskal–Wallis ANOVA followed by Bonferroni adjustment for multiple comparisons was used to test for differences between each food group and between hearths. Spearman’s correlation was used to examine the re-lationship between each food group and between hearths. We incorporated theδ15N,δ13C
16:0, andδ13C18:0values of the hearths and food groups as well as burning enrichment factors (δ13C±0.1‰andδ15N±0.3‰) (49) and con-centration dependencies (50) in a SIAR mixing model to estimate the pro-portional contribution of the three food groups (marine, freshwater, and terrestrial) to each hearth (SI Materials and Methods).
All hearth matrices were collected by strata and 50×50-cm2horizontal quadrants and screened in the laboratory through an ASTM no. 16 sieve (1.18-mm mesh). The resulting faunal assemblage comprised small, calcined, and highly fragmented specimens. Fish remains were differentiated from birds and mammals based on skeletal morphology and vertebral fenestra-tion patterns, which could be identified to the level of Salmonidae. The teeth and better-preserved vertebrae fragments of the large salmonids were consistent in size and morphology with theOncorhynchussp. described in the cremation feature (F2010-05) (21, 22). The NISP was calculated by using the method in Lyman (51) and is based on identifiability at the class level. Terrestrial fauna and Salmonidae NISP were used to generate a Salmonidae index for each hearth (Salmonidae NISP/non-Salmonidae NISP).
ACKNOWLEDGMENTS. We thank T. Howe and N. Haubenstock for in-strumental assistance with GC-C-IRMS analysis; S. Billings for assistance with GC-MS; A. Schimmelman for providing fatty acid isotope standards; T. Howe and S. Billings for providing hunted modern animal samples in Interior Alaska; and Caitlin Holloway for providing laboratory assistance. This project was funded in part by National Science Foundation Grants OPP-0732846, OPP-1137078, OPP-1138811, and OPP-1223119.
1. Butler VL, Campbell SK (2004) Resource intensification and resource depression in the Pacific Northwest of North America: A zooarchaeological review.J World Prehist
18(4):327–405.
2. Lyman RL (1987) Zooarchaeology and taphonomy: A general consideration.J Ethnobiol
7(11):93–117.
3. Craig OE, et al. (2007) Molecular and isotopic demonstration of the processing of aquatic products in northern European prehistoric pottery.Archaeometry49(1):135–152. 4. Craig OE, et al. (2011) Ancient lipids reveal continuity in culinary practices across the
transition to agriculture in Northern Europe.Proc Natl Acad Sci USA108(44):17910–17915. 5. Craig OE, et al. (2013) Earliest evidence for the use of pottery.Nature496(7445):
351–354.
6. Evershed RP, et al. (2008) Earliest date for milk use in the Near East and southeastern Europe linked to cattle herding.Nature455(7212):528–531.
7. Farrell TFG, et al. (2014) Specialized processing of aquatic resources in prehistoric Alaskan pottery? A lipid-residue analysis of ceramic sherds from the Thule-period site of Nunalleq, Alaska.Arctic Anthropol51(1):86–100.
8. Tache K, Craig OE (2014) Cooperative harvesting of aquatic resources triggered the be-ginning of pottery production in north-eastern North America.Antiquity89(343):1–14. 9. Sassaman KE (1993)Early Pottery in the Southeast: Tradition and Innovation in
Cooking Technology(Univ of Alabama Press, Tuscaloosa, AL).
10. Tache K, Hart JP (2013) Chronometric hygiene of radiocarbon databases for early durable cooking vessel technologies in northeastern North America.Am Antiq78(2): 359–372.
11. Black SL, Thoms AV (2014) Hunter-gatherer earth oven in the archaeological record: fundamental concepts.Am Antiq79(2):203–226.
12. Mentzer SM (2014) Microarchaeological approaches to the identification and in-terpretation of combustion features in prehistoric archaeological sites.J Archaeol Method TH21(3):616–618.
13. Kedrowski BL, et al. (2009) GC/MS analysis of fatty acids from ancient hearth residues at the Swan Point archaeological site.Archaeometry51(1):110–122.
14. Heron C, Nilsen G, Stern B, Craig O, Nordby C (2010) Application of lipid biomarker analysis to evaluate the function of‘slab-lined pits’in Arctic Norway.J Archaeol Sci
37(9):2188–2197.
15. Grønnow B, Applet M, Odgaard U (2014) In the light of blubber: The earliest stone lamps in Greenland and beyond.Northern Worlds–Landscapes, Interactions and Dynamics: Research at the National Museum of Denmark, ed Gullove HC (Publications from the National Museum Copenhagen, Copenhagen), pp 403–422.
16. Reitz EJ, Wing ES (2008)Zooarchaeology(Cambridge Univ Press, Cambridge, UK), 2nd Ed. 17. Moss ML (1961) Osteogenesis of acellular teleost fish bone.Am J Anat108(1):99–109. 18. Butler VL, Chatters JC (1994) The role of bone density in structuring prehistoric
salmon bone assemblages.J Archaeol Sci21(3):413–424.
19. Steffen M, Mackie Q (2005) An experimental approach to understanding burnt fish bone assemblages within archaeological hearth contexts.Can Zooarchaeol23:11–38. 20. Witten PE, Huysseune A (2009) A comparative view on mechanisms and functions of skeletal remodelling in teleost fish, with special emphasis on osteoclasts and their function.Biol Rev Camb Philos Soc84(2):315–346.
21. Potter BA, Irish JD, Reuther JD, Gelvin-Reymiller C, Holliday VT (2011) A terminal Pleistocene child cremation and residential structure from eastern Beringia.Science
331(6020):1058–1062.
22. Potter BA, Irish JD, Reuther JD, McKinney HJ (2014) New insights into Eastern Be-ringian mortuary behavior: A terminal Pleistocene double infant burial at Upward Sun River.Proc Natl Acad Sci USA111(48):17060–17065.
23. Halffman CM, et al. (2015) Early human use of anadromous salmon in North America at 11,500 y ago.Proc Natl Acad Sci USA112(40):12344–12348.
24. Potter BA (2007) Models of faunal processing and economy in Early Holocene interior.
Environ Archaeol12(1):3–23.
25. Yesner DR (1996) Human adaptation at the Pleistocene-Holocene boundary (circa 13,000 to 8,000 BP) in eastern Beringia.Humans at the End of the Ice Age: The Archaeology of the Pleistocene-Holocene Transition, eds Straus LG, Eriksen BV, Erlandson JM, Yesner DR (Plenum, New York), pp 255–276.
Choy et al. PNAS | August 30, 2016 | vol. 113 | no. 35 | 9761
ANT
26. Knudson KJ, Frink L (2011) Nitrogen isotope analysis in the Arctic: Identifying fish processing and marine resource use through enthnoarchaeological soil analysis on Nelson Island, Alaska.Alaska J Anthropol9(2):17–54.
27. Parnell AC, Inger R, Bearhop S, Jackson AL (2010) Source partitioning using stable isotopes: Coping with too much variation.PLoS One5(3):e9672.
28. Johnson SP, Schindler DE (2009) Trophic ecology of Pacific salmon (Onchrhynchus
spp.) in the ocean: A synthesis of stable isotope research.Ecol Res24(4):855–863. 29. Milakovic B, Parker KL (2013) Quantifying carnivory by grizzly bears in a multi-ungulate
system.J Wildl Manage77(1):39–47.
30. Blundell GM, Ben-David M, Bowyer RT (2014) Sociality in river otters: Cooperative foraging or reproductive strategies?Behav Ecol13(1):134–141.
31. Sierzen ME, McDonald ME, Jensen DA (2003) Benthos as the basis for arctic lake food webs.Aquat Ecol37(4):437–455.
32. Ben-David N, McColl CJ, Boonstra R, Karels TJ (1999) 15N signatures do not reflect body condition in Arctic ground squirrels.Can J Zool77(9):1373–1378.
33. Dark P (2003) Dogs, a crane (not duck) and diet at Star Carr: A response to Schulting and Richards.J Archaeol Sci30(10):1353–1356.
34. Hebert CE, Wassenaar LI (2005) Feather stable isotopes in western North American Waterfowl: Spatial patterns, underlying factors, and management applications.Wildl Soc Bull33(1):92–102.
35. Nash SH, et al. (2012) Stable nitrogen and carbon isotope ratios indicate traditional and market food intake in an indigenous circumpolar population.J Nutr142(1): 84–90.
36. Wilkinson MJ, Yai Y, O’Brien DM (2007) Age-related variation in red blood cell stable isotope ratios (δ13C andδ15N) from two Yupik villages in southwest Alaska: A pilot
study.Int J Circumpolar Health66(1):31–41.
37. Misarti N, Finney B, Maschner H, Wooller MJ (2009) Changes in northeast pacific marine ecosystems over the last 4500 years: Evidence from stable isotope analysis of bone collagen from archaeological middens.Holocene19:1139–1151.
38. Byers DA, Yesner DR, Broughton JM, Coltrain JB (2011) Stable isotope chemistry, population histories and Late Prehistoric subsistence change in the Aleutian Islands.
J Archaeol Sci38(1):183–196.
39. Britton K, et al. (2013) Maritime adaptations and dietary variation in prehistoric Western Alaska: Stable isotope analysis of permafrost-preserved human hair.Am J Phys Anthropol151(3):448–461.
40. Friedli H, Lötscher H, Oeschger H, Siegenthaler U, Stauffer B (1986) Ice core record of the13C/12C ratio of atmospheric CO
2in the past two centuries.Nature324(6094):
237–238.
41. Leuenberger M, Siegenthaler U, Langway C (1992) Carbon isotope composition of atmospheric CO2during the last ice age from an Antarctic ice core.Nature357:
488–490.
42. Oak Ridge National Laboratory, U.S. Department of Energy. Modern records of car-bon and oxygen isotopes in atmospheric carcar-bon dioxide and carcar-bon-13 in methane, Carbon Dioxide Information Analysis Center, Oak Ridge National Laboratory, U.S. Department of Energy. Available at cdiac.ornl.gov/trends/co2/modern_isotopes.html. Accessed April 18, 2016.
43. Hansel FA, Copley MS, Madureira LAS, Evershed RP (2004) Thermally produced
ω-(o-alkylphenyl) alkanoic acids provide evidence for the processing of marine products in archaeological pottery vessels.Tetrahedron Lett45(14):2999–3002.
44. Potter BA (2008) Exploratory models of intersite variability in Mid to Late Holocene Central Alaska.Arctic61(4):407–425.
45. Evershed RP (2008) Organic residue analysis in archaeology: The archaeological bio-marker revolution.Archaeometry50(6):895–924.
46. Buonasera TY, Tremayne AH, Darwent CM, Eerkens JW, Mason OK (2015) Lipid bio-markers and compound specificδ13C analysis indicate early development of a
dual-economic system for the Arctic Small Tool tradition in northern Alaska.J Archaeol Sci
61:129–138.
47. Folch J, Lees M, Sloane Stanley GH (1957) A simple method for the isolation and purification of total lipides from animal tissues.J Biol Chem226(1):497–509. 48. Parrish CC (1999) Determination of total lipid, lipid classes and fatty acids in aquatic
samples.Lipids in Freshwater Ecosystems, ed Wainman BC (Springer, New York), pp 4–12. 49. Nitsch EK, Charles M, Bogaard A (2015) Calculating a statistically robustδ13C andδ15N
offset for charred cereal and pulse seeds.Sci Technol Archaeol Res1:1–14. 50. Wang SW, et al. (2015) Importance of sympagic production to Bering Sea
zoo-plankton as revealed from fatty acid-carbon stable isotope analyses.Mar Ecol Prog Ser518:31–50.
51. Lyman RL (1994)Vertebrate Taphonomy(Cambridge Univ Press, Cambridge, UK). 52. Reuther JD (2013) Late Glacial and early Holocene geoarchaeology and terrestrial
paleoecology in the lowlands of the middle Tanana Valley, subarctic Alaska. PhD thesis (Univ of Arizona, Tucson, AZ).
53. Dixon EJ (1985) Cultural chronology of central interior Alaska.Arctic Anthropol22(1): 47–66.
54. Potter BA, Holmes CE, Yesner DR (2013) Technology and economy among the earliest prehistoric foragers in Interior Eastern Beringia.Paleoamerican Odyssey Proceedings
(Texas A&M Press, College Station, TX), pp 463–485.
55. Child AM (1995) Microbial taphonomy of archaeological bone.Stud Conserv40(1): 19–30.
56. Linse AR (1992) Is bone safe in a shell midden?Deciphering a Shell Midden, ed Stein JK (Academic, San Diego), pp 327–345.
57. Martill DM (1991) Bones as stones: the contribution of vertebrate remains to the lithological record.The Process of Fossilization, ed Donovan SK (Columbia Univ Press, New York), pp 270–292.
58. Richter J (1986) Experimental study of heat induced morphological changes in fish bone collagen.J Archaeol Sci13(9):471–481.
59. Smith RE (2008) Structural bone density of Pacific cod (Gadus microcephalus) and halibut (Hippoglossus stenolepis): Taphonomic and archaeological implications. PhD thesis (Portland State Univ, Portland, OR).
60. McKinney HJ (2013) Taphonomic analysis of fish remains from the Mink Island site (XMK-030): Implications for zooarchaeological and stable isotopic research. PhD thesis (Univ of Alaska Fairbanks, Fairbanks, AK).
61. Nicholson RA (1996) Bone degradation, burial medium and species representation: Debunking myths, an experimental based approach.J Archaeol Sci23(4):513–533. 62. Seitz AC, Moerlein K, Evans MD, Rosenberger AE (2011) Ecology of fishes in a
high-latitude, turbid river with implications for the impacts of hydrokinetic devices.Rev Fish Biol Fish21(3):481–496.
63. Brown RJ, Bickford N, Severin K (2007) Otolith trace element chemistry as an indicator of anadromy in Yukon River drainage coregonine fishes.T Am Fisher Soc136(3): 678–690.
Supporting Information
Choy et al. 10.1073/pnas.1606219113
SI Materials and Methods
Archaeological Context. USR excavations, context, and cultural materials have been described in detail (21–23, 44). Four com-ponents are securely dated through a series of 27 feature and stratigraphic dates and are situated in well-stratified loess con-texts, vertically separated from each other: Component 1 (∼13,200 cal B.P.) is located 230 cm below surface (BS); component 2 (∼11,800 cal B.P.) is located at 135 cm BS; component 3 (∼11,500 cal B.P.) is located between 80 and 100 cm BS, but is expressed as a thin (<1 cm thick) layer of artifacts, features, and fauna; and component 4 (∼10,000 cal B.P.) is situated 20 cm above compo-nent 3. Compocompo-nent 1 (13,200 cal y B.P.) contains two hearth features and associated lithic faunal remains in a single large ac-tivity area. Component 2 (11,800 cal y B.P.) contains four hearths and associated lithic materials, but few preserved fauna. Compo-nent 3 (11,500 cal y B.P.) is characterized as a residential base camp, with one interior hearth (within a residential feature) and 10 other hearths and associated cultural materials (e.g., lithic tools, antler foreshafts, and projectile points). Component 3 fauna are found only within the hearth features, except for a small scatter near hearth F2013-11. The residential feature contained a complex central hearth (F2010-5) where multiple burials took place: (i) two infants were placed within a∼90-cm-deep pit ex-cavated through a previous hearth; (ii) the hearth was reused; and (iii) a 3-y-old child was cremated within the hearth (21, 22). Component 3 fauna are well-preserved and include salmon ( On-corhynchussp.), ground squirrel (Urocitellus parryii), hare (Lepus americanus), terrestrial birds (Tetraoninae), small salmonid fish (Coregoninae), and unidentified very large mammals (cf Bisonsp. orAlces alces) (22).
Postdepositional disturbance is minimal and component integrity is high, allowing for the high-resolution spatial analyses presented here. The relatively rapid accumulation of calcareous wind-blown silts (loess) fostered a depositional environment conducive to bone preservation (52). Several archaeological features also display a rapid burial of faunal remains by site occupants placing fill over bones and acted in a similar fashion in their preservation as the rapid deposition of loess (21). Organic preservation is excellent below the upper buried Bwb horizons (above component 3), and pH values are relatively alkaline (avg. 8.78). Component 1 fauna are gener-ally unburned and are well-preserved, except burned, fragmented specimens recovered within the hearths. However, fauna within components 2 and 3 are limited to largely burned and calcined fragments deposited within hearths, except for a small scatter of burned bones in the west, associated with hearths F2010-03, F2013-10, and F2013-11. For this reason, this concentration of fauna and hearths F2013-10 and F2013-11 is combined for the zooarchaeo-logical analyses.
Based on bifacial morphology, components 2 and 3 are assigned to the Denali complex, a widespread cultural manifes-tation dating from 12,500 to 6,000 cal y B.P. (44, 53). Component 1 has yielded no diagnostic lithic artifacts and is tentatively assigned to the East Beringian tradition, Chindadn phase on the basis of location and dating, because component 1 is coterminous with other regional sites of this tradition (e.g., Healy Lake, Broken Mammoth, and Mead) (54).
Stable Isotope Methods.Bulk stable carbon and nitrogen isotope analysis (where isotopic compositions are expressed asδ13C and δ15N values) of hearth, bone collagen, and muscle samples were conducted at the Alaska Stable Isotope Facility, University of Alaska Fairbanks. Hearth and muscle samples were freeze-dried
for 48 h. Subsamples (10 mg) of freeze-dried hearth samples and 0.5 mg of dried muscle tissues from modern faunal samples were weighed into tin capsules, andδ13C andδ15N values were mea-sured by using an elemental analyzer coupled to a continuous flow isotope ratio spectrometer (EA-IRMS). Collagen from the USR faunal bone samples was prepared following protocols described by Misarti et al. (37). Approximately 500 mg of bone powder from each bone sample was demineralized in 6 M HCI and then gelatinized at 65 °C in pH 3 solutions. The remaining solutions were filtered by using Millex-HV 0.45-μm filters and were freeze-dried for 48 h. After freeze-drying, 0.5 mg of bone collagen was weighed into tin capsules, andδ13C andδ15N values were measured by using an EA-IRMS. Analytical precisions were±0.1‰and±0.2‰forδ13C andδ15N values, respectively. The carbon and nitrogen isotope ratios of samples are expressed relative to the Vienna Pee Belemnite (V-PDB) and atmospheric nitrogen (AIR) using delta (δ) notation as follows:δ13C orδ15N values (‰) = (Rsample/Rstandard − 1) × 1,000, where R is the ratios of the13C/12C or15N/14N, respectively.
Lipids in hearth and muscle samples were extracted by using standard protocols (47, 48). Freeze-dried samples (hearth∼10 mg and muscle∼1 mg) were ground to a fine powder, and lipids were extracted with a mixture of chloroform/methanol (2:1 (wt/vol), 3× 10 mL, 24 h). The preparation of FA methyl esters (FAMEs) followed standard methods (3–5, 43). The extracted lipids were saponified with NaOH in methanol [5% (wt/vol), 2 h, 70 °C] and were acidified with HCl. Neutral lipids were removed, and then the acidified suspension was extracted withn-hexane (3×2 mL) and methylated to produce FAMEs using a BF3-methanol complex [14% (wt/vol), 200μL, 1 h, 70 °C]. The concentration of each FA in the FAME products was quantified by GC-MS. FAMEs were identified by comparison of retention times with known standards (Nu Check Prep; Elysian) and using the NIST Standard Reference Database.δ13C values of individual FAs (C16:0 and C18:0) from hearths and muscle tissues were analyzed by GC-C-IRMS. Each FAME product was separated by using the same GC column and methods used for GC-MS analyses. Modern faunal samples were measured by using exactly the same procedures. For GC-C-IRMS, instrument sample precision from repeated measurements of samples (n =4) was less than ±0.3‰, and FAMEδ13C values were calibrated by using a FAME isotope standard (Indiana Uni-versity Stable Isotope Reference Materials) (50). To allow com-parisons between modern and archaeological data,δ13C values of all modern samples were adjusted to account for the influence of postindustrial carbon in the δ13C values of atmospheric carbon dioxide (40). Theδ13C value for global atmospheric CO2from the Late Pleistocene (∼12 ka B.P.) was−6.8‰(41), and a modernδ13C value for global atmospheric CO2is−8.3‰(42). This results in a 1.5‰difference between our Late Pleistocene and modern sam-ples. We applied a+1.5‰adjustment to the modern samples.
SIAR.We used the package SIAR (Version 4.2) to estimate the proportional contribution of three food groups to each hearth. The SIAR mixing model performs well under multiple source mixing system (e.g., terrestrial, freshwater, and salmon), and SIAR is suitable for estimating mixtures where there are more food sources than measured isotopes (27). Furthermore, the SIAR model can incorporate uncertainty in the isotope values of food groups and hearths as well as concentration dependencies and burning enrichment factors. Uncertainty is also incorporated in estimating food sources, which are provided as a posterior probability distribution function of the proportional contribution
of each group. Potential food sources can be grouped according to ecological and isotopic relevance. The SIAR model works best when each group includes multiple observations and the model can provide more accurate estimates of group variance.
We categorized food resources into three food groups: marine (anadromous salmon), freshwater (freshwater fish+aquatic birds), and terrestrial resources. Aquatic birds (e.g., mallards, teal, wigeon, and Canada geese) were grouped as freshwater resources. Our approach has worked to group sources under three broader categories that serve three primary research goals by being: (i) ecologically sensible, (ii) isotopically discernable, and (iii) archeologically informative. Each of these categories represents a broader suite of grouped sources. “Freshwater” includes freshwater ducks as well as freshwater fish.“Terrestrial” includes terrestrial animals as well as terrestrial plants. By measuring the carbon isotope of FAs, our approach provided some limitations and avoided some of the complexities associ-ated with admixture of two organic matters (terrestrial animals and plants). This is backed up by the N isotope data that have clear difference between terrestrial animals and plants. A non-parametric Kruskal–Wallis ANOVA followed by Bonferroni adjustment for multiple comparisons was used to test for dif-ferences between each food group and between hearths. Spear-man’s correlation was used to examine the relationship between each food group and between hearths. The level of significance was set atP≤ 0.05. All values presented are means± SD‰. Statistical analyses were performed by using SPSS (Version 17). We incorporated theδ15N,δ13C16:0, andδ13C18:0 values of the hearths and food groups as well as burning enrichment factors (δ13C ± 0.1‰ andδ15N ±0.3‰) (49) and concentration de-pendencies (50) in Bayesian SIAR to estimate the proportional contribution of the three food groups (marine, freshwater, and terrestrial) to each hearth. Theδ13C values of FAs (C16:0 and C18:0) andδ15N values for terrestrial, freshwater, and anadro-mous salmon resources were used as the end member resources in our mixing models. The SIAR model allows for incorporation of uncertainty and variation of isotope data to give a 95% credibility interval that includes the probability distribution of the estimates (27).
Zooarchaeological Methods.The most direct proxy for faunal use in prehistoric contexts is taxonomically identifiable faunal remains. USR fauna served us as an independent direct test of our stable isotope mixing model, particularly anadromous salmon, which have distinct isotopic values with respect to freshwater fish, waterfowl, and terrestrial animals. Our sample included all fauna screened (1.18-mm mesh) from all hearth matrix samples as well as all three-pointed faunal samples from within the hearths, except F2013-10 and F2013-11 in component 3, where the faunal concentrations were centered on these hearths but extended to ∼1 m beyond the hearth matrices. Because of this extension, data were pooled for F2013-10 and F2013-11. Component 1 fauna contained faunal distributed beyond 1 m. We limited component 1 faunal data to only those within the features, but no salmon have been identified in component 1 to date.
USR components have varying degrees of faunal preservation, likely relating to diagenic factors (e.g., soil pH, leaching,
compac-tion, and microbes) as well as biostratinomic factors (e.g., cooking/ burning) (55–58). Preservation varies across component 3 hearths, and given similar depths below buried soil horizons and similar pH values, we argue that some of these differences relate to bio-stratinomic factors (i.e., cultural behaviors). The best-preserved fauna were recovered in F2010-05, a hearth used last for a child cremation and F2011-13, a pit feature excavated through F2010-05 for the interment of two infants. A number of unburned bones were found in the latter, and complete elements of fish and small mammals were recovered from each. Both of these features were backfilled, buffering the fauna from diagenic destruction. In con-trast, the other hearth features contained no complete elements, and were almost entirely burned, and most were calcined. We infer considerable density-mediated attrition for these hearth assem-blages because of the overrepresentation of the densest portions of the most robust elements. For the fish remains, only teeth, verte-brae, and fin fragments were identified in these hearths. Fish teeth and vertebrae are among the densest skeletal features (18, 59), allowing for better preservation. Although fin fragments may not be as dense as other elements (18), they tend to retain their identifiability, despite being highly fragmented (60).
For this study, we identified every specimen directly within USR hearth features to the highest taxonomic precision, listed as NISP in Table S7. Component 3 identified taxa include fish, mammals, and birds. The fish were highly fragmented relative to the mammals and birds. We differentiated fish from mammals and birds based on skeletal morphology, vertebral fenestration patterns, and cor-tical bone thickness (61). Although we could not identify all specimens to the level of species, we can limit the identification to the level of Salmonidae (6,914 NISP), which includes: chum salmon (Oncorhynchus keta), chinook salmon (Oncorhynchus tshawyscha), coho salmon (Oncorhynchus kisutch), Arctic grayling (Thymallus arcticus), and subfamily Coregoninae, including in-connu (Stenodus leuchichthys), round whitefish (Prosopium cylin-draceum), humpback whitefish (Coregonus pidschian), broad whitefish (Coregonus nasus), and least cisco (Coregonus sardinella) (62, 63). Based on tooth morphology and vertebra fenestration patterns, we can exclude pike (Esox lucius) and burbot (Lota lota). Arctic grayling (Thymallus arcticus), lake chub (Cousius plumbeus), longnose sucker (Bastostomus catostomus), and slimy sculpin (Cottus cognatus) are abundant in the Tanana River, but can be ruled out based on size (62).
Using comparative collections for modern fish in the region, we can exclude pike (E. lucius) and burbot (L. lota) (based on tooth morphology and vertebra fenestration patterns), and possibly grayling (based on size). Although the vertebrae were identifi-able to the level of Salmonidae, all teeth could be identified as Oncorhynchussp. The teeth and better-preserved vertebrae frag-ments are consistent in size and morphology with the Onco-rhynchus sp. described in the cremation feature (F2010-05) (21, 22). Genetic analyses of component 3 fish specimens indicate that theOncorhynchussp. is anadromous chum salmon (Oncorhynchus keta) (23). Other component 3 taxa include mammals (1,736 NISP) and terrestrial birds (likely grouse) (24 NISP). Human remains (759 NISP) are included for F2010-05. These data are used to generate a Salmonidae index for each hearth, and it is likely that all or most of these specimens are chum salmon.
Fig. S1. Bulkδ13C andδ15N values from USR hearths plotted along with values from modern muscle tissues (A) and ancient bone collagen (B) from terrestrial, freshwater and salmon. There is an isotopic shift inδ13C values between modern muscle and ancient bone collagen samples, but not inδ15N values.
Fig. S2. Bulkδ15N values (mean and SD) from hearths in component 3 (A) and components 1 and 2 (B) at USR.
Fig. S3. Examples of the horizontal distribution ofδ15N values on hearths F2014-06, F2013-09, F2010-01, and F2013-20 (A), and vertical distribution and extended occupation surface ofδ15N values in hearth F2013-09 (B). Numbers on the figures indicates the nitrogen isotope values.
Fig. S4. An example GC-MS chromatogram of the fatty acid methyl esters extracted from hearth residues from USR hearth F2013-09. IS, internal standard (tetratriacontane).
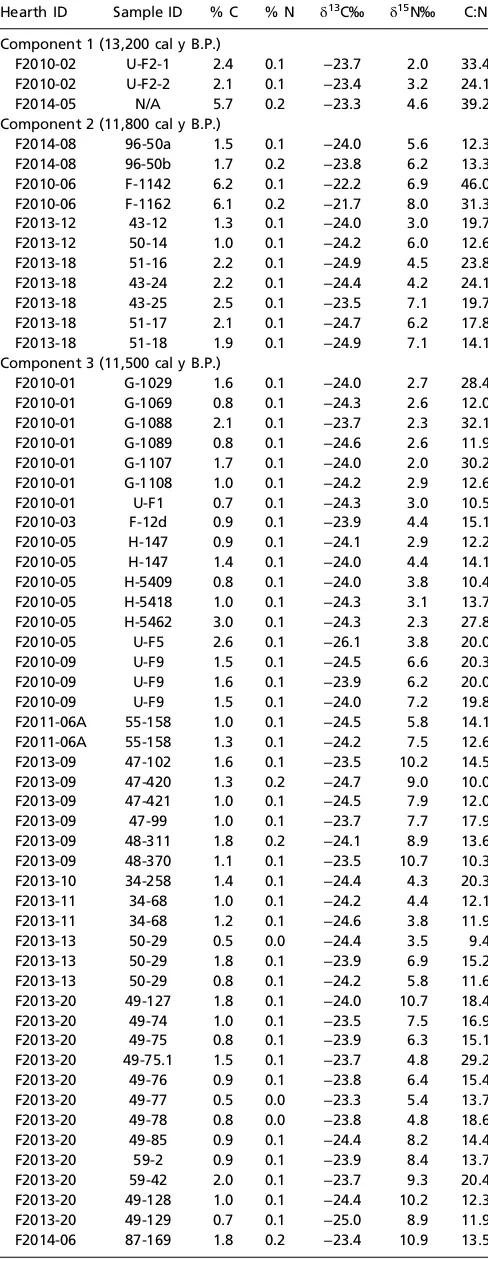
Table S1. Bulk stable carbon and nitrogen isotopic
measurements of archaeological hearths from components 1, 2, and 3 at USR
Hearth ID Sample ID % C % N δ13C‰ δ15N‰ C:N
Component 1 (13,200 cal y B.P.)
F2010-02 U-F2-1 2.4 0.1 −23.7 2.0 33.4 F2010-02 U-F2-2 2.1 0.1 −23.4 3.2 24.1
F2014-05 N/A 5.7 0.2 −23.3 4.6 39.2
Component 2 (11,800 cal y B.P.)
F2014-08 96-50a 1.5 0.1 −24.0 5.6 12.3 F2014-08 96-50b 1.7 0.2 −23.8 6.2 13.3 F2010-06 F-1142 6.2 0.1 −22.2 6.9 46.0 F2010-06 F-1162 6.1 0.2 −21.7 8.0 31.3
F2013-12 43-12 1.3 0.1 −24.0 3.0 19.7
F2013-12 50-14 1.0 0.1 −24.2 6.0 12.6
F2013-18 51-16 2.2 0.1 −24.9 4.5 23.8
F2013-18 43-24 2.2 0.1 −24.4 4.2 24.1
F2013-18 43-25 2.5 0.1 −23.5 7.1 19.7
F2013-18 51-17 2.1 0.1 −24.7 6.2 17.8
F2013-18 51-18 1.9 0.1 −24.9 7.1 14.1
Component 3 (11,500 cal y B.P.)
F2010-01 G-1029 1.6 0.1 −24.0 2.7 28.4 F2010-01 G-1069 0.8 0.1 −24.3 2.6 12.0 F2010-01 G-1088 2.1 0.1 −23.7 2.3 32.1 F2010-01 G-1089 0.8 0.1 −24.6 2.6 11.9 F2010-01 G-1107 1.7 0.1 −24.0 2.0 30.2 F2010-01 G-1108 1.0 0.1 −24.2 2.9 12.6
F2010-01 U-F1 0.7 0.1 −24.3 3.0 10.5
F2010-03 F-12d 0.9 0.1 −23.9 4.4 15.1
F2010-05 H-147 0.9 0.1 −24.1 2.9 12.2
F2010-05 H-147 1.4 0.1 −24.0 4.4 14.1
F2010-05 H-5409 0.8 0.1 −24.0 3.8 10.4 F2010-05 H-5418 1.0 0.1 −24.3 3.1 13.7 F2010-05 H-5462 3.0 0.1 −24.3 2.3 27.8
F2010-05 U-F5 2.6 0.1 −26.1 3.8 20.0
F2010-09 U-F9 1.5 0.1 −24.5 6.6 20.3
F2010-09 U-F9 1.6 0.1 −23.9 6.2 20.0
F2010-09 U-F9 1.5 0.1 −24.0 7.2 19.8
F2011-06A 55-158 1.0 0.1 −24.5 5.8 14.1 F2011-06A 55-158 1.3 0.1 −24.2 7.5 12.6 F2013-09 47-102 1.6 0.1 −23.5 10.2 14.5 F2013-09 47-420 1.3 0.2 −24.7 9.0 10.0 F2013-09 47-421 1.0 0.1 −24.5 7.9 12.0
F2013-09 47-99 1.0 0.1 −23.7 7.7 17.9
F2013-09 48-311 1.8 0.2 −24.1 8.9 13.6 F2013-09 48-370 1.1 0.1 −23.5 10.7 10.3 F2013-10 34-258 1.4 0.1 −24.4 4.3 20.3
F2013-11 34-68 1.0 0.1 −24.2 4.4 12.1
F2013-11 34-68 1.2 0.1 −24.6 3.8 11.9
F2013-13 50-29 0.5 0.0 −24.4 3.5 9.4
F2013-13 50-29 1.8 0.1 −23.9 6.9 15.2
F2013-13 50-29 0.8 0.1 −24.2 5.8 11.6
F2013-20 49-127 1.8 0.1 −24.0 10.7 18.4
F2013-20 49-74 1.0 0.1 −23.5 7.5 16.9
F2013-20 49-75 0.8 0.1 −23.9 6.3 15.1
F2013-20 49-75.1 1.5 0.1 −23.7 4.8 29.2
F2013-20 49-76 0.9 0.1 −23.8 6.4 15.4
F2013-20 49-77 0.5 0.0 −23.3 5.4 13.7
F2013-20 49-78 0.8 0.0 −23.8 4.8 18.6
F2013-20 49-85 0.9 0.1 −24.4 8.2 14.4
F2013-20 59-2 0.9 0.1 −23.9 8.4 13.7
F2013-20 59-42 2.0 0.1 −23.7 9.3 20.4
F2013-20 49-128 1.0 0.1 −24.4 10.2 12.3 F2013-20 49-129 0.7 0.1 −25.0 8.9 11.9 F2014-06 87-169 1.8 0.2 −23.4 10.9 13.5
Table S1. Cont.
Hearth ID Sample ID % C % N δ13C‰ δ15N‰ C:N
F2014-06 87-170 3.9 0.3 −22.0 12.2 14.3
F2014-06 87-445 0.8 0.1 −25.1 9.5 8.5
F2014-06 87-446 4.3 0.3 −26.9 11.3 16.9 F2014-06 88-517 2.0 0.2 −23.9 12.0 10.9 F2014-06 88-518 1.5 0.1 −23.4 9.8 13.0 F2014-06 88-519 4.0 0.3 −21.1 12.0 14.9 F2014-06 88-520 3.1 0.3 −22.3 12.4 11.6 F2014-06 88-570 2.8 0.2 −22.9 11.0 17.8 Controls (11,500 cal y B.P.)
Control U71 0.4 0.02 −25.0 −0.7 24.5
Control U72 0.3 0.02 −25.0 −1.3 17.5
Control U73 0.4 0.02 −25.4 −0.3 22.8
N/A, not applicable.
Table S2. Bulk stable carbon and nitrogen isotope and stable carbon isotope data from analyses of two fatty acids (C16:0 and C18:0) from modern fauna muscle tissue from interior Alaska collected during subsistence hunting as a comparative dataset
Common name Species name % C % N
Adjusted
δ13C‰ δ15N‰ C:N
Adjusted mean
δ13C‰16:0 SD
Adjusted mean
δ13C‰18:0 SD
Terrestrial mammals
Moose Alces alces 49.2 14.2 −24.7 1.4 4.0 −31.4 0.2 −32.5 0.3
Snowshoe hare Lepus americanus 46.8 15.0 −23.5 2.8 3.6 −30 0.1 −29.6 0.3
Red squirrel Sciurus vulgaris 53.0 5.7 −21.8 3.4 10.8 −26.8 0.5 −27.6 0.2
Ruffed grouse Bonasa umbellus 50.3 13.6 −25.0 3.2 4.3 −32.2 0.2 −32.4 0.2
Spruce grouse Falcipennis canadensis 48.3 15.0 −24.0 2.1 3.8 −32.8 0.5 −32.7 0.7 Aquatic Birds
Canada goose Branta canadensis 51.0 14.9 −24.5 7.4 4.0 −33.1 0.4 −31.9 0.5
Duck mallard Anas platyrhynchos 47.4 15.3 −27.5 5.8 3.6 −35.8 0.5 −35.4 0.6
Duck teal Anas discors 49.5 14.5 −27.9 6.3 4.0 −34.7 0.3 −34.3 0.5
Duck wigeon Anas americana 48.3 14.6 −25.0 7.4 3.9 −32.5 0.2 −31.6 0.3
Freshwater Fish
Arctic grayling Thymallus arcticus 58.4 8.4 −36.9 9.9 8.1 −41.5 0.5 −39.6 0.2
Burbot Lota lota 47.5 15.0 −33 7.0 3.7 −27.5 0.2 −28.8 0.2
Burbot Lota lota 46.5 15.5 −25 13.8 3.5 −30.4 0.2 −29.4 0.9
Northern pike Esox lucius 43.6 13.9 −26 13.1 3.7 −33.5 0.2 −31.3 0.2
Northern pike Esox lucius 47.7 15.1 −30.3 9.4 3.7 −36.4 0.4 −36.2 0.6
Northern pike Esox lucius 46.5 15.6 −27.5 14.6 3.5 −36.6 0.1 −35.6 0.5
Sheefish Stenodus nelma 50.5 13.1 −29 12.1 4.5 −34.6 0.3 −35 0.2
Bering cisco Coregonus laurettae 50.8 14.9 −28.7 9.4 4.0 −35.2 0.3 −34.9 0.9
Anadromous Salmon
Coho salmon Oncorhynchus kisutch 50.2 13.7 −19.3 14.5 4.3 −28.8 0.2 −27.2 0.5
Coho salmon Oncorhynchus kisutch 54.7 12.2 −20.8 12.6 5.2 −28.4 0.4 −26.6 0.4
Coho salmon Oncorhynchus kisutch 55.9 12.3 −20 13.5 5.3 −27.8 0.4 −25.6 0.4
Chum salmon Oncorhynchus keta 59.7 5.1 −22.6 13.5 13.6 −26.8 0.3 −26 0.5
Chum salmon Oncorhynchus keta 49.1 14.2 −18.7 14.6 4.0 −26.8 0.5 −25.4 0.6
Chum salmon Oncorhynchus keta 55.5 12.2 −19.2 14.0 5.3 −25.7 0.4 −24.1 0.9
To compare with modern and archaeological data,δ13C values of all modern samples were adjusted for the addition (1.5‰) of the effects of postindustrial carbon (SI Materials and Methodsand refs. 40–42).
Table S3. Bulk stable carbon and nitrogen isotopic measurements of bone collagen from archaeological fauna at Hearth F2010-05
Common name Species name Collagen weight (mg) Collagen yield (%) %C %N δ13C‰ δ15N‰ C:N
Artiodactyl Artiodactyla 0.2 0.02 5.9 1.2 −25.9 N/A N/A
Artiodactyl Artiodactyla 1.9 0.6 0.7 0.1 −25.8 N/A N/A
Crane Grus canadensis 13.0 0.9 37.4 13.0 −20.3 5.6 3.3
Crane Grus canadensis 0.5 0.1 50.4 17.2 −19.9 5.8 3.4
Crane Grus canadensis 63.4 3.9 36.7 12.6 −18.3 9.4 3.4
Goose Branta canadensis 43.1 6.2 38.9 13.7 −19.2 5.0 3.3
Goose Branta canadensis 19.5 2.5 38.3 13.4 −22.0 7.5 3.3
Ground squirrel Urocitellus parryii 8.2 12.5 42.7 15.2 −20.3 1.8 3.3
Ground squirrel Urocitellus parryii 4.5 4.9 38.2 13.5 −20.7 1.8 3.3
Ground squirrel Urocitellus parryii 4.3 1.7 38.9 13.5 −20.9 2.0 3.4
Ground squirrel Urocitellus parryii 0.2 0.3 18.8 5.4 −23.7 1.7 4.1
Ground squirrel Urocitellus parryii 0.4 0.4 18.0 5.7 −23.3 3.3 3.7
Ground squirrel Urocitellus parryii 5.6 4.4 42.6 15.1 −20.0 1.8 3.3
Snowshoe hare Lepus americanus 0.2 0.7 15.9 4.4 −23.5 1.9 4.2
Microtines Avricolinae 0.4 1.7 1.7 0.4 −28.4 N/A N/A
Microtines Avricolinae 0.3 7.6 30.2 9.3 −22.7 3.5 3.8
Chum salmon Oncorhynchus keta 0.2 0.2 4.9 1.1 −26.6 N/A N/A
Chum salmon Oncorhynchus keta 0.1 0.1 6.1 1.7 −26.9 N/A N/A
Small salmonid Coregoninae 0.2 0.2 6.4 1.1 −27.2 N/A N/A
Ptarmigan/grouse Tetraoninae 4.1 2.7 32.3 11.4 −19.9 1.2 3.3
Duck Anatidae 11.6 3.0 37.7 13.3 −24.7 5.8 3.3
Table S4. Bulk stable carbon and nitrogen isotopic measurements of three vertical layers in component 3 hearth sediments
Hearth ID Component Sample ID Group %C %N δ13C‰ δ15N‰ C:N
F2010-01 C3 U-F1 A 0.7 0.1 −24.3 3.0 10.5
F2010-01 C3 G-1029 B 1.6 0.1 −24.0 2.7 28.4
F2010-01 C3 G-1088 B 2.1 0.1 −23.7 2.3 32.1
F2010-01 C3 G-1107 B 1.7 0.1 −24.0 2.0 30.2
F2010-01 C3 G-1069 C 0.8 0.1 −24.3 2.6 12.0
F2010-01 C3 G-1089 C 0.8 0.1 −24.6 2.6 11.9
F2010-01 C3 G-1108 C 1.0 0.1 −24.2 2.9 12.6
F2011-06A C3 55–158 A 1.0 0.1 −24.5 5.8 14.1
F2011-06A C3 55–158 C 1.3 0.1 −24.2 7.5 12.6
F2013-11 C3 34–68 A 1.0 0.1 −24.2 4.4 12.1
F2013-11 C3 34–68 C 1.2 0.1 −24.6 3.8 11.9
F2013-13 C3 50–29 A 0.5 0.0 −24.4 3.5 9.4
F2013-13 C3 50–29 B 0.8 0.1 −24.2 5.8 11.6
F2013-13 C3 50–29 C 1.8 0.1 −23.9 6.9 15.2
F2013-20 C3 59–2 A 1.3 0.1 −25.1 3.2 18.8
F2013-20 C3 59–2 B 1.7 0.1 −23.6 5.1 19.3
F2013-20 C3 59–2 C 1.0 0.1 −24.0 5.0 12.8
F2013-09 C3 48–312 A 0.8 0.1 −24.5 5.1 12.3
F2013-09 C3 48–312 B 19.2 0.8 N/A 5.9 23.3
F2013-09 C3 48–312 B 0.6 0.1 −24.6 4.1 10.3
F2013-09 C3 48–312 C 2.1 0.1 −24.1 7.2 14.4
F2013-09 C3 48-F9-1 D 0.4 0.0 −23.8 3.2 11.8
F2013-09 C3 48-F9-2 D 0.6 0.1 −23.4 7.3 14.1
F2013-09 C3 48-F9-3 D 0.4 0.0 −23.9 3.7 11.5
F2013-09 C3 48-F9-4 D 0.4 0.0 −23.9 3.8 12.4
F2013-09 C3 48-F9-5 D 0.4 0.0 −23.9 3.6 11.4
F2013-09 C3 48-F9-6 D 0.4 0.0 −23.8 3.5 11.4
F2014-06 C3 88–519 A 1.4 0.1 −23.6 8.7 11.9
F2014-06 C3 88–519 C 0.9 0.1 −25.0 6.9 9.3
Groups: A: bone-rich layer (top), B: charcoal-rich layer (middle), C: oxidized layer, D: extended occupation area out of hearths.
Table S5. Stable carbon isotopic measurements of hexadecanoic (C16:0) and octadecanoic (C18:0) acids of USR hearth residues selected for lipid analysis by GC-C-IRMS
Hearth ID Component Sample ID (group) Lipid conc,μg/mL C% N% δ13C‰ δ15N‰ Mean 16:0 SD Mean 18:0 SD
F2010-02 C1 U-F2-1 0.3 2.4 0.1 −23.7 2.0 −32.0 0.5 −30.1 0.9
F2014-05 C1 N/A 0.3 5.7 0.2 −23.3 4.6 −31.8 2.1 −29.2 1.5
F2013-18 C2 51-18 0.4 1.9 0.1 −24.9 7.1 −31.1 1.5 −30.4 0.5
F2010-06 C2 F-1162 (C) 0.4 6.1 0.2 −21.7 8.0 −32.2 1.5 −27.5 0.1
F2013-12 C2 50-14 0.2 1.0 0.1 −24.2 6.0 −30.7 1.0 −28.9 0.8
F2014-08 C2 96-50b (C) 0.3 1.7 0.2 −23.8 6.2 −31.8 2.0 −29.5 0.3
F2010-01 C3 G-1108 (C) 0.1 1.0 0.1 −24.2 2.9 −31.3 1.3 −29.6 0.9
F2010-05 C3 H-HR147 0.4 2.6 0.1 −24.0 4.4 −31.5 1.2 −28.4 0.7
F2010-05 C3 U-F5 1.6 1.4 0.1 −26.1 3.8 −30.5 0.6 −29.0 0.1
F2011-06A C3 55-158 (C) 0.3 1.3 0.1 −24.2 7.5 −31.0 0.8 −29.9 0.7
F2013-09 C3 48-312 (C) 0.3 1.9 0.1 −24.6 9.0 −31.8 1.0 −29.8 0.5
F2013-09 C3 48-312-1 (A) 0.2 0.8 0.1 −24.1 6.9 −31.4 0.6 −29.8 0.6
F2013-09 C3 48-312-3 (B) 0.7 10.0 0.7 N/A 5.7 −30.6 0.3 −29.8 0.6
F2013-09 C3 48-370 0.5 1.1 0.1 −23.5 10.7 −31.3 0.2 −29.9 1.7
F2013-09 C3 48-312-2 (B) 0.3 0.5 0.1 −24.1 4.9 −30.1 1.0 −29.0 0.7
F2013-10 C3 34-258 0.4 1.4 0.1 −24.4 4.3 −30.0 0.9 −28.3 1.1
F2013-11 C3 34-68 0.2 1.0 0.1 −24.2 4.4 −31.2 1.1 −27.9 0.9
F2013-13 C3 50-S29 (C) 0.6 1.8 0.1 −23.9 6.9 −31.9 2.1 −29.1 0.2
F2013-20 C3 49-127 0.2 1.8 0.1 −24.0 10.7 −31.4 1.7 −28.8 0.5
F2013-20 C3 49-78 0.2 0.8 0.05 −23.8 4.8 −31.4 0.8 −29.0 0.6
F2013-20 C3 59-2 0.3 0.9 0.2 −23.9 8.4 −31.5 0.7 −28.6 0.7
F2013-20 C3 59-42 0.5 2.0 0.1 −23.7 9.3 −31.0 0.8 −28.0 0.3
F2014-06 C3 87-170 0.3 3.9 0.3 −22.0 12.2 −32.4 0.3 −30.2 0.5
F2014-06 C3 88-520 0.5 3.1 0.3 −22.3 12.4 −30.4 1.3 −28.7 1.7
Control N/A U71 0.2 0.4 0.02 −25.0 −0.7 −31.7 1.9 −27.3 0.4
Control N/A U73 0.1 0.3 0.02 −25.4 −0.3 −31.0 1.0 −26.5 0.2
Control N/A U72 0.2 0.4 0.02 −25.0 −1.3 −31.2 1.2 −26.0 1.0
Table S6. SIAR Bayesian model estimates for USR hearth residues in proportional contribution of three food sources with 95% lower and upper credibility interval
Component Hearth ID
Terrestrial Freshwater Marine
Mean % Low 95% CI High 95% CI Mean % Low 95% CI High 95% CI Mean % Low 95% CI High 95% CI
C1 F2010-02 70 23 103 26 0 70 4 0 12
C1 F2014-05 65 34 92 24 0 53 11 0 23
C2 F2013-18 45 21 67 29 0 54 26 3 45
C2 F2010-06 41 16 62 28 0 53 31 7 51
C2 F2013-12 56 30 79 25 0 51 19 1 35
C2 F2014-08 52 25 77 29 0 54 19 0 36
C3 F2010-01 75 36 100 20 0 57 5 0 14
C3 F2010-05 70 39 94 20 0 49 10 0 22
C3 F2010-05 73 40 97 19 0 50 8 0 18
C3 F2011-6A 43 20 64 27 0 52 29 6 49
C3 F2013-09 33 11 52 31 3 57 36 11 58
C3 F2013-09 47 23 70 29 1 54 24 2 42
C3 F2013-09 57 29 81 26 0 52 17 1 33
C3 F2013-09 21 2 38 33 8 59 45 18 70
C3 F2013-09 66 36 90 21 0 49 13 0 26
C3 F2013-10 73 44 95 17 0 45 10 0 21
C3 F2013-11 72 42 95 18 0 46 10 0 22
C3 F2013-13 47 23 69 29 1 54 24 2 42
C3 F2013-20 22 2 38 32 4 58 47 20 72
C3 F2013-20 65 34 91 23 0 51 11 0 25
C3 F2013-20 38 16 58 27 0 52 34 10 55
C3 F2013-20 33 10 51 25 0 50 42 17 64
C3 F2014-06 13 0 29 42 19 68 45 15 72
C3 F2014-06 10 0 23 26 2 54 64 33 87
Theδ13C
16:0,δ13C18:0, andδ15N values were used as the end member resources in our mixing models and this output includes concentration dependencies and burning fractionation factors.
Table S7. Comparison of zooarchaeological and SIAR proxies for resource proportions in component 3 hearths
Hearth Salmonidae NISP Non-Salmonidae NISP Salmonidae index
SIAR model marine% mean (95% CI)
Component 1 (∼13,200 cal y B.P.)
F2010-02 0 37 0.0 4 (12–0)
F2014-05 0 5,783 0.0 11 (23–0)
Component 1 total 0 5,820 0.0
Component 2 (∼11,800 cal y B.P.)
F2010-06 0 32 0.0 31 (51–7)
F2013-12 0 0 N/A 19 (35–1)
F2013-18 0 0 N/A 26 (45–3)
F2014-08 0 63 0.0 19 (36–0)
Component 2 total 0 95 0.0
Component 3 (∼11,500 cal y B.P.)
F2010-05 326 1,260 0.3 9 (20–0)
F2010-01 0 54 0.0 5 (14–0)
F2011-6A 20 47 0.4 29 (49–6)
F2013-10&11 0 723 0.0 10 (22–0)
F2013-13 1 12 0.1 24 (42–2)
F2013-20 168 18 9.3 34 (54–12)
F2013-09 61 9 6.8 27 (46–6)
F2014-06 6,302 324 19.5 55 (80–24)
Component 3 total 6,914 2,514 3.9
Salmonidae taxa were identified only in component 3.