International Doctoral School in Biomolecular Sciences XXV Cycle
“Surface functionalizations towards Nucleic
Acid Purification: a nanoscale study”
Tutor:
Cecilia Pederzolli
Bruno Kessler Foundation
Advisor: Lorenzo Lunelli
Bruno Kessler Foundation, CNR-Institute of Biophysics
Ph.D. thesis of: Lorenza Marocchi University of Trento Bruno Kessler Foundation
Declaration
I hereby confirm that this is my own work and the use of all material from external sources has been properly and fully acknowledged.
The research work for this Ph.D. thesis was carried out at and founded with a scholarship by the BioSint Unit - Centre for Materials and Microsystems, at Bruno Kessler Foundation, in Trento.
Abstract
Protein byosynthesis is performed by ribosomes, that translate the genetic infor-mation contained in a strand of mRNA and assemble the peptide chain. Dur-ing translation, several ribosomes associate to a sDur-ingle strand of mRNA, formDur-ing supramolecular complexes known as polyribosomes (polysomes).
This project is aimed at developing and studying a miniaturized purification system able to isolate and extract polysome-associated mRNA, namely mRNA under active translation.
The resulting microdevice will constitute a faster, simpler and low-cost alterna-tive to the time-consuming traditional laboratory procedures for polysome purifi-cation and mRNA extraction (sucrose gradient centrifugation and phenol/ethanol RNA extraction).
Polysome purification on microdevice will be based on the immobilization of polysomes to the device surfaces, opportunely treated to enhance polysome ad-hesion. Surface funtionalization will be achieved by formation of Self-Assembled Monolayers (SAM) of organic molecules. In particular, since both ribosomes and nucleic acids expose an high quantity of electrical charged moieties towards the environment [Anger et al., 2013], organic molecules containing charged functional groups will be used as SAM constituents.
In this thesis a characterization of gold and silicon oxide plane samples func-tionalized with different alkanethiols and alkylsilanes SAMs will be presented as well as a quantitative and qualitative evaluation of polysome adhesion performed mainly by Atomic Force Microscopy (AFM). A proof of principle of the purification and extraction of RNA from polysomes using a silicon/Pyrex microdevice will be also reported.
Contents
1 Introduction 1
1.1 Actively translated mRNAs . . . 1
1.2 Polysome purification . . . 3
1.3 Lab-on-a-chip approach . . . 4
1.4 Surface functionalization: the Self-Assembled Monolayers . . . 5
2 Purpose of the thesis 14 3 Materials and Methods 15 3.1 Materials . . . 15
3.2 Methods . . . 16
3.2.1 Analytical methods . . . 16
3.2.1.1 Spectrophotometry . . . 16
3.2.1.2 Spectrofluorimetry . . . 16
3.2.1.3 Bioanalyzer analysis . . . 16
3.2.1.4 Fluorescence microscopy . . . 17
3.2.2 Surface preparation and functionalization . . . 17
3.2.2.1 Gold samples preparation . . . 17
3.2.2.2 Gold functionalization with thiols . . . 17
3.2.2.3 Silicon oxide silanization . . . 18
3.2.2.4 Mica silanization . . . 19
3.2.3 Ribosome/polyribosomes deposition on plane samples . . . . 19
3.2.3.1 Ribosome and Polysome purification . . . 19
3.2.3.2 Ribosome deposition . . . 21
3.2.3.3 Polysome deposition . . . 21
3.2.4 Nucleic Acids deposition on plane samples . . . 21
3.2.5 Surface characterization . . . 22
3.2.5.1 Morphological characterization by AFM . . . 22
3.2.5.2 Chemical characterization by XPS . . . 24
3.2.5.3 Chemical characterization by Tof-SIMS . . . 25
3.2.5.4 AFM: Force-distance measurements . . . 25
3.2.6 Microdevice . . . 27
3.2.6.1 Silicon/Pyrex microdevices fabrication and func-tionalization . . . 27
3.2.6.2 Extraction of RNA from polysome by Silicon/Pyrex
microdevice . . . 29
4 Results and Discussion 31 4.1 Introduction . . . 31
4.2 Ribosomes and Polysomes adhesion on Self Assembled Monolayers. Gold substrates . . . 31
4.2.1 Characterization of gold substrates . . . 32
4.2.2 Functionalized gold surface characterization . . . 34
4.2.2.1 Morphology of functionalized gold: AFM charac-terization . . . 34
4.2.2.2 Surface chemistry of functionalized gold: XPS char-acterization . . . 41
4.2.2.3 Surface chemistry of functionalized gold: Tof-SIMS analysis . . . 42
4.2.3 Ribosome adhesion to gold and functionalized gold surfaces . 47 4.2.4 Polysome adhesion to gold and functionalized gold surfaces . 54 4.3 DNA adhesion to functionalized gold . . . 57
4.4 Gold substrates: conclusions . . . 59
4.5 Silicon oxide substrates . . . 61
4.5.1 Functionalized silicon oxide . . . 61
4.5.1.1 Surface characterization . . . 61
4.5.1.2 Polysome deposition . . . 62
4.5.2 DNA and RNA interaction with functionalized surfaces: force distance measurement . . . 67
4.6 Silicon/Pyrex microdevice . . . 69
4.6.1 RNA Extraction verification . . . 69
4.7 Silicon substrate: conclusions . . . 75
5 Conclusions 77
Chapter 1
Introduction
This work is aimed at developing and studying a purification system for mRNA un-dergoing translation, namely the mRNA associated with polysomes. The long term outcome of this work is the design and realization of a microsystem based on the results of this thesis, that will constitute a faster, simpler and low-cost alternative to the traditional procedures for polysome isolation and mRNA extraction.
Polysome purification on microdevice will be based on the interaction between the polysomes and the device surfaces that will be opportunely treated to enhance polysome adhesion.
The surfaces of the microdevice will be chemically functionalized using Self-Assembled Monolayers of organic molecules, a well known and reliable method to tailor the chemical properties of several solid substrates, among which are some of the materials most commonly used in microsystem manifacturing: silicon, glass and polymers (i.e. PDMS). In particular, since both ribosomes and nucleic acids expose an high quantity of electrical charged moieties towards the environment [Anger et al., 2013], the microdevice surfaces will be treated with SAM capable to endow them with a positive or negative charge distribution. In this way it will be possible to exploit electrostatic interaction of attraction and repulsion to direct the binding of polysomes and nucleic acid on the walls of the microdevice, without resorting to specific, often expensive, binding molecules (for example, antibodies).
1.1
Actively translated mRNAs
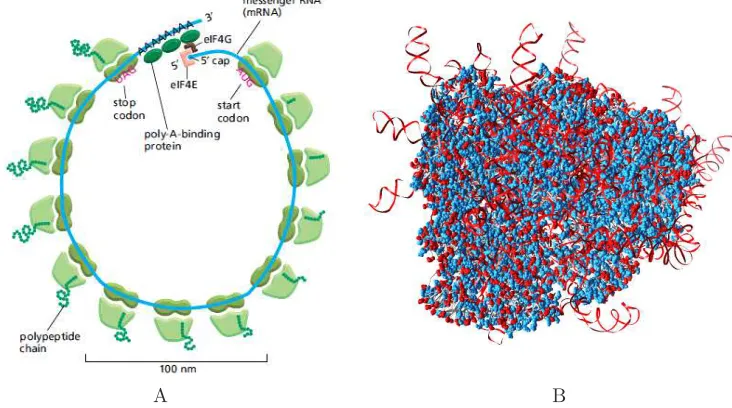
Of the total mRNA present in a cell at any given time, only a fraction mRNA is effectively translated into protein. After transcription, in fact, there are many regulatory mechanisms that determine if the mRNA will be immediately translated, or stored or degraded. Actively translated mRNA is associated with ribosomes, the cellular machinery that reads the genetic information contained in the mRNAs and assembles the proteins. During translation multiple ribosomes are loaded on a same strand of mRNA, forming large complexes known as polyribosomes (polysomes) (in
A B
Figure 1.1: Panel A: a model of polysome. Multiple ribosomes are translating the same strand of mRNA into proteins. The polysome has a circular structure, in which the mRNA ends are linked by several proteins involved in the translation process (eucaryotic initiation factor eIF4 complex and poly-A binding proteins) (adapted from Alberts et al. 5thEdition [Alberts et al., 2008]). Panel B:Human ri-bosome. Blue: the positively charged amino acids. Red: negatively charged amino acids. Red ribbons: rRNA phosphate groups (adapted from [Anger et al., 2013]).
Figure 1.1 a cartoon showing a model of polysome is shown).
CHAPTER 1. INTRODUCTION 3
1.2
Polysome purification
The extraction of the polysome-bound mRNA fraction has been routinely achieved by fractionation of polysomes of different size by differential centrifugation through density sucrose gradients. This technique is able to separate polysomal fraction of different weight: after lysis of the cellular membrane (that can be achieved through different methods: detergents, osmotic shock, ultrasonic vibration) the cell extract is loaded on a gradient of sucrose (usually linear) and then centrifuged with an ultracentrifuge able to reach at least 150,000 g. The polysomes migrate through the mixture and separate in bands depending on their buoyant density that can be collected separately, usually by means of a dedicated fraction collector. The RNA is then extracted from the collected fraction. A common extraction procedure is the precipitation in a phenol-chlorophorm/aqueous solution in high salt condition, 1.5 -2 M NaCl.
The sucrose gradient fractionation, although widely used, presents some distinct disadvantages: it requires special equipment (i.e. an ultra-centrifuge, a sucrose gra-dient fractionator/collector system) that may not be available in every laboratory, it is a time-consuming procedure, lasting at least several hours, and not allowing multiple sample in parallel, it requires a skillful operator to be successfully com-pleted and high amounts of starting samples (up to 109 cells [Kudo et al., 2010])
that may not be conveniently available in some critical application, such as, for example, when working with clinical samples obtained from tissue biopsies. Al-thoug, this thechnique achieve a very precise separation, the resulting polysomes-they are diluted in a high concentration of sucrose and heparin, often used as a non-specific RNase inhibitor, that can hinder subsequent steps of polysome and extracted mRNA analysis, or complicate the RNA extraction procedure.
In the last decade alternative polysome purifications strategies have been ex-plored.
In the years between 1970 and1980 some chromatographic technique has been employed on bacterial ribosomes: adsorption chromatography on hydroxyapatite [Hoffman and Ilan, 1974], size exclusion chromatography (SEC) [Jelenc, 1980], and hydrophobic interaction chromatography (HIC) [Kirillov et al., 1978]. Chromato-graphic purifications of ribosomes have been occasionally readopted by some labo-ratories [Maguire et al., 2008] but never achieved widespread use, and furthermore they do not offer particular advantages in terms of rapidity or simplicity in sample-handling.
bio-genesis, a difficult operation due to the ribosome complexity and high degree of structural conservation. This, not only requires a careful choice of the ribosomal component to be tagged, for it to be functionally incorporated, but introduces a transgenic modification in the cell aimed to express the mutant protein or rRNA, hence preventing an analysis of cells in natural/unadulterated conditions. Further-more, tagging each of the (usually) multiple copies of rRNA or RP genes is often not practicable: therefore the tagged ribosomes constitute a sub-population of the total pool of ribosomes produced by the cell.
Immuno-precipitation has even been applied to proteins closely associated with the polysome complex, for example chaperon proteins involved in the folding of the nascent peptide [Kudo et al., 2010], an approach that, although avoids modi-fication on the ribosomes, target only the fraction of polysomes associated with a determined chaperon protein.
1.3
Lab-on-a-chip approach
The purification of polysome bound mRNA is achieved at the moment only utiliz-ing traditional, but cumbersome method based on sucrose gradient centrifugation, despite its aforementioned disadvantages: it is time-consuming, laborious, requires special equipment and large quantities of starting sample, finally the resulting polysomes are diluted in a solution with considerable amounts of sucrose.
However, a new approach, based on the use ofminiaturized devices, or Lab-On-a-Chip (LOC) platforms, has become recently feasible thanks to the development of functionalized microfluidic systems. This kind of strategy has gained popular-ity in the early 1990s, when technologies for silicon microfabrication, have started to be employed in the realization of several miniaturized actuators and analy-sis microsystems: micropumps and microvalves for liquid samples hydrodynamics, micro-heater units, micro-electrodes, micro-detectors and micro-sensors for analy-ses [Chen et al., 2007].
These elements have been then integrated on miniaturized devices or chips, capable to perform a wide range of analyses, replacing many, if not all steps of a chemical or biological analysis, going from the sample preparation to detection, with semi-automaded procedures on a single platform [Crevillén et al., 2007].
This approach offer many advantages that could play a critical role for polysome purification purposes.
First of all LOCs are particularly suited to replace a time-consuming, or highly dependent on operator skills, traditional laboratory procedure with semi-automated and faster procedures. This would bring a significant saving of operator time and labor; moreover, the mycrosystem utilization is often of much more simple handling than traditional techniques steps.
CHAPTER 1. INTRODUCTION 5
microdevices generally require amounts of sample ranging from a few picol-iters few to microlpicol-iters, in any case several order of magnitude smaller than the traditional approach, thus saving reagents in the analytical chemistry field, but also offering the possibility of working on low quantities of samples, with great efficiency of purification and sensitivity, in cases were this was not possible or con-venient (as, for example, the traditional polysome purification). Moreover, the high efficiency of these microsystem offer the possibility of high-throughput anal-yses from small quantities of sample. These qualities, coupled with the simplicity of a semi-automated process may open the way for several applications for which obtaining large amounts of starting sample it is not possible or convenient, as, for example, in the clinical field or the pharmaceutical industry, where the necessity of microscale sample analysis, on multiple sample in parallel, for substance (drugs, pathogens or toxins) detection and analysis is a critical advantage.
In the last two decades LOCs have been employed in numerous application in the analytical chemistry, life science and biomedical fields. A great number of works have been published in particular, regarding LOCs dedicated to genetic analyses of DNA extracted from blood, either for analysis or diagnostic purposes [Kricka, 1998, Cho et al., 2007, Price et al., 2009].
RNA extraction and analyses on microdevices has also been reported in liter-ature: virus detection based on RNA extracted from blood [Hui et al., 2007] or mammalian cells [Hong et al., 2004, Bhattacharyya and Klapperich, 2008] for di-agnostic purposes or genetic analyses purposes [Lien et al., 2007]. These microde-vices, however, are all based on the same principles of DNA extraction (and so have been used [Hong et al., 2004, Hui et al., 2007]) and their target is constituted by total RNA. Works on microdevice for polysome-bound mRNA are not yet reported in the literature.
1.4
Surface functionalization: the Self-Assembled
Monolayers
When working with miniaturized technologies, often interfaces and surface prop-erties are more important than the bulk propprop-erties of the materials: the fact that volume decreases more rapidly than surface area becomes critical at micro and nanoscale level. Controlling surface properties as wettability, conductance, affinity for other organic molecules is therefore one of the fundamental steps to work in the nanotechnology field.
One of the simplest and historically more studied methods to tailor such surface properties are the Self-Assembled monolayers.
hardly reproducible or controllable.
This is not true for a particular case: the Self-Assembled Monolayers (SAMs). These areassemblies of organic molecules that adsorb on a solid metal or metal ox-ide surface and spontaneously arrange themselves in ordered (crystalline or semicrys-talline) structures. The assembly of SAMs is guided by a functional group ( head-group) of the organic molecules that has a particular affinity for a specific type of substrate. There are, thus, molecules that form SAM on specific materials. The most known and studied are SAMs formed by molecules containing a thiolic group (-SH) or a disulfide (-S-S-), on transitional metals such as gold, silver, palladium, copper, platinum and mercury [Love et al., 2005]. Silanes, molecule containing a silanol (-S-O-) are preferred to form SAM on hydroxylated surfaces such as silicon oxide, aluminum oxide, titanium oxide, glass and mica[Vericat et al., 2010].
SAMs have several properties that make them interesting for nantechnology purposes. They constitute a smart method to modify surface properties such as wettability, conductance and charge distribution, chemistry and affinity for organic molecules without altering significantly the morphology of the surfaces. SAM are usually easy to prepare: they do not require specialized equipment nor high amount of reagents. In principle they assemble on objects of any size and a variety of shapes in a few hours.
The applications are countless and involve different fields of technology. In the nanotechnology field alone they are widely employed in the stabilization and functionalization of nanoparticles, nano-rods and nano-wires. They are used as inks or resist in lithography, photolitography and microfabrication. Their ability to connect inorganic and organic environments make them fundamental for the functioning of sensors and biosensors but also as surface agents for control cell adhesion and growth, bio-molecular carriers, coatings for implants. In the field of material protection and device fabrications they are often used as ultra-thin layers for corrosion prevention and friction reduction. They are often employed as components in electronic devices as transistor [Vericat et al., 2010]
SAM structure
Each molecule that constitute the building block of a SAM can be divided in three parts: head-group, carbon chain and terminal group as shown in Figure 1.2. The head-group is a functional group that has a specific affinity for a material. It guides the formation of the SAM forming a strongbond, often a covalent bond, with an atom of the substrate surface.
More often than not, the molecules forming SAMs are constituted by long alka-nes. The long hydrocarbon chains are able to arrange themselves in a ordered and strictly packed structure, sustained by Van Der Waals and hydrophobic interac-tions. Although Van Der Waals interactions are often orders of magnitude weaker than the bond between headgroup and substrate, their strength increases with the length of the carbon chain, stabilizing structures formed by long chain molecules (!18 carbons). When these ordered structures are complete the molecules assume a tilted conformation: the chains are tilted by an angle αdefined from the axis
CHAPTER 1. INTRODUCTION 7
A B
Figure 1.2: Panel A. The structure of a SAM formed by alkanethiols on a metal sur-face [Love et al., 2005]. Panel B. Scheme of a thiol (dodecanethiol) in standing-up configuration [Vericat et al., 2010]. αindicates the tilt between the molecule and the direction orthogonal to the surface. Angleβ conventionally indicates the rota-tion of the molecule with respect to the first neighbors, and angleχthe orientation respect an arbitrary direction parallel to the gold surface.
material on which the SAM is formed. The angle β defines the molecule proper
rotation (the rotation around the natural axis of the molecule) that minimizes the energy between adjacent carbon chains. In Figure 1.2 a schematics of a complete SAM and the angle convention are shown.
Finally the terminal group, often is a functional group and is the main contrib-utor to the new chemical properties the surface acquires thanks to the formation of the SAM: among the most used –CH3 and –CF3 groups turn the SAM surface
hydrophobic and highly anti-adherent„ –COOH, –NH2or –OH groups produce
hy-drophilic surfaces with good protein binding properties, -SH (dithiols) are often used to bind metallic ions and nanoparticles to the SAMs.
The self-assembly process
In the first phase, the molecules from the liquid or gas-phase environment ini-tially adsorb on the surface thanks parini-tially to the affinity of the headgroup for the substrate, but also by interaction of the carbon chains (physisorption) with the substrate. This step brings the head-group and the substrate material in close contact, thus leading to the chemisorption of the molecules, namely the formation of the proper (often covalent) bond between the head-groups and the atoms of the surface.
The most common model used to describe this phase kinetics is the first order Langmuir adsorption model.
The reaction that take place can be thought as a reversible adsorption reaction: S+Aad"S·Aad (1.1) This model assumes that the adsorption process occur on a perfectly plane surface endowed with a number of equivalent adsorption sites S, capable to hold a single adsorbate molecule.
The rate of adsorptionRad depends on the concentration (or partial pressure in case of a gas-phase deposition) of the molecules in proximity to the surface, the presence of avaible sites, and the probability of bond formation between the molecule and the adsorption site. that may depend upon various factors: amongst these the presence of any activation barrier to the adsorption.
While the inverse process, the desorption depends on the number of sites already occupied on the surface and the probability of desorption, which depends mainly on the temperature of the systems and the energy necessary to break the adsorbate-surface bond.
The adsorption and desorption rates may be written as:
Rad=c·(1−θ)·kad (1.2)
Rdes=θ·kdes (1.3)
Where θ represents the fraction of adsorption sites occupied by an adsorbate
molecule, thus the coverage of the surface. In this model it is implied that adsorp-tion and desorpadsorp-tion are simple process with a first order dependency onθ.
At equilibrium, the adsorption and desorption rates equal each other. Rad
Rdes
=c(1−θ)
θ
kad
kdes
(1.4) Rearranging this equation we obtain the Langmuir isotherm, that represent the relation between coverage and concentration of molecules in solution.
θ= kAc
1−kAc
CHAPTER 1. INTRODUCTION 9
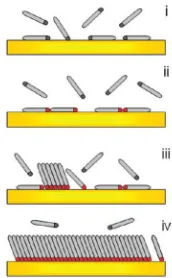
Figure 1.3: Steps of the self-assembling process: i. physisorption of molecules on the substrate, ii. binding of the head-groups with the substrate in the striped phase, iii. and iv. nucleation, growth and completion of the standing-up phase [Vericat et al., 2010].
parameters vary from site to site, such as the activation energy of adsorption. Ad-sorbate/adsorbate interactions may affect the adsorption process by favouring or hindering the adsorpion near an already immobilized molecule. Several modifi-cation of the Langmuir equation have been proposed to take into account these phenomenons (for example the Freundlich equation for inhomogeneous surfaces, or the Temkin isotherm for adsorbate/adsorbate interaction.
This first steps is are usually very fast, taking up to some minutes. This situa-tion, a surface covered in lying-down molecules, is known asstriped phase, due to the presence of different domains deriving from distinct growing islands.
The following, much slower, steps consist in the rising of molecules from a lying-down configuration to a standing-up one, once again starting from nucleation sites and growing to the final coverage of the surface with a densely packed crystalline layer, in which the carbon chains optimize their interaction with the next neighbors. This process is much slower and can take from hours to a few days.
SAM formed by organosulfur on gold
Gold surfaces, especially in the crystallographic orientation (111), coupled with thiolated molecules, in particular alkanethiols, are the most historically studied system of SAM, for a number of reasons. Gold is a relatively inert material, it does not react with atmospheric oxygen nor with most chemicals, making it possible to handle samples in air, or wet environments, therefore it can be conveniently used in biology.
important reasons, however is that gold surfaces are easy to manifacture. It can be obtained as thin films, as colloid phase or as nanoparticles, by vapor deposi-tion, sputtering or electrodeposition [Love et al., 2005]. In the course of this work, gold samples obtained through vapor deposition on mica substrates will be used. Both X-ray diffraction [Hooper et al., 1999] and STM [Hegner et al., 1993a] has been used to show that evaporated gold deposited on this kind of substrate as-sumes Au(111) as its predominant crystallographic orientation characterized by a hexagonal geometrical disposition of the exposed gold atoms with a lattice constant 0.288 Å (see Figure 1.4).
SAMs of thiols on gold can be reliably prepared both in liquid and by vapor deposition, the former method being very convenient in terms of simplicity and quantity of reagents. Liquid phase self-assembly can be carried out in numerous solvent, depending on the nature of the thiol. By far the most commonly used one is ethanol: it can solvate a range of different thiols in terms of polarity and chain lenght, can be conveniently purchased at high purity, and has low toxic-ity. Other solvent may reveal themselves as more efficient for the formation of SAM of n-alkanethiols on gold: for example non polar solvents may speed up the chemisorption of the sulfur atom but impede the following phase of carbon chain re-arrangements, thus yielding to less organized monolayers; on the other hand, polar solvents, less capable of solvating long alkanethiols, may segregate them for hy-drophobic interaction and enable them to form highly organized SAM, containing far less defects.
The most common procedure is to immerse a freshly prepared or clean gold substrate in a solution of the desired thiol in ethanol (∼1-10 mM) for 12-18 hours [Love et al., 2005, Ulman, 1996].
In these conditions, chemisorption of the sulfur atoms on the gold surfaces hap-pen within minutes from the starting of the incubation. The reaction of formation of a covalent bond between the thiolate group and a gold atom can be formally described as an oxidative addition of the S-H bond to the gold surface immediately followed by reduction and elimination of the hydrogen [Ulman, 1996].
R—S—H+Au0
n→R—S
−
Au+
·Au0
n+ 1
2H2 (1.6)
The kinetic of this reaction has been found to be strongly dependent on the concentration of thiol: at 1 mM it can be completed within 1 minute, while at 1 µM it can last up to 100 minutes [Ulman, 1996].
Density of chemisorbed molecules increases rapidly in this phase, rapidly skip-ping the striped down phase and reaching the standing up conformation with tilt angleα∼30° and coverage close to the final one (∼4.5·1014molec/cm2) [Love et al., 2005].
CHAPTER 1. INTRODUCTION 11
Figure 1.4: Schematic illustrations of the structure of SAMs formed from alkanethi-ols on single crystals of gold. Open circles represent gold atoms: (a), the lattice constant of Au(111) is equal to 2.88 Å Dark gray circles represent sulfur atoms, that assume an orientation rotated by 30° with respect to the underlying gold plane, with a lattice constant equal to√3a=4.98 Å(indicated as (√3×√3)R30° in the text). Light gray circles with dashed lines represent the projected area of the carbon chain,∼21.4 Å2[Ulman, 1996]. Black wedges represents the projections of the CCC plane of the carbon chains. The larger rhombus shows a c(4×2) superlat-tice with respect to the(√3×√3)R30° structure defined by the relative orientation of the carbon chains[Love et al., 2005].
To minimize the free energy of the layer the hydrocarbon chains adopt a con-formation that favors Van Der Waals interactions between the carbon chains: they arrange themselves in a strictly packed and tilted configuration with tilt angle
α∼30° and proper rotation angleβ ∼55° [Vericat et al., 2010].The disposition of the carbon chains define a further superlattice structure (showed in Figure 1.4) indicated as c(4×2) unit cell.
The energy of the S-Au bond has been estimated from desorption experi-ment performed in solvent and in void, and reported in numerous works as∼50 kcal/mol, comparable with the bonding energy of a disulphide bond (62 kcal/mol) [Love et al., 2005] while Van Der Waals interactions energy has been estimated to 1-2 kcal/mol per methylene [Vericat et al., 2010, Love et al., 2005], yielding to particularly stable to mechanical and chemical stimulation SAM formed by alkane longer than 10 carbon atoms [Love et al., 2005].
Figure 1.5: Schematic illustration of some of the intrinsic and extrinsic defects found in SAMs formed on polycrystalline substrates. The dark line is a visual guide that indicating the gold-sulfur interface [Love et al., 2005].
Some defects are caused by irregularities of the gold substrates, caused either by edges at the crystalline plane in a polycrystalline substrare or caused by the presence of monoatomic holes and vacancies islands, impurities on the gold surface, defects or boundaries between different grains of the gold substrate.
Other defects are generated during the SAM formation: as already mentioned the standing up phase is formed starting from nucleation sites, that grow into domains of tightly packed and ordered chains, that can however be characterize by different orientation (different anglesχ). Defects at the domain edges has been observed at the STM.
A third kind of defect originates from the dynamic behavior of the SAM, and may be caused by adjacent areas with different phase (from striped down to stand-ing up). So disordered, liquid-like domains can be found beside regions with well-packed molecules, or regions in which the molecules sport not fully extended hy-drocarbon chains, or a differnet angleα.
Several strategies can be employed to improve the quality of thiol and dithiol monolayers on Au(111). A careful choice of the solvent and of the self-assembly conditions can yield SAMs with lower defect density and better chain ordering.
CHAPTER 1. INTRODUCTION 13
Figure 1.6: A schematic description of a polysiloxane at the monolayer-substrate interface. The arrow points to an equatorial Si-O bond that can be connected either to another polysiloxane chain or to the surface [Ulman, 1996]. The dotted line on the left is a bond in a possible precursor trimer.
SAM formed by organosilanes on hydroxylated surfaces
The main alternative to SAMs formed by thiol on gold (and more generically transition metals) are SAMs formed by alkylsilanes on hydroxylated surfaces, such as silicon oxide, glass, aluminum oxide, titanium oxide, quartz and mica. The driving force for this self-assembly is the formation of a polysiloxane connected to surface silanol groups (-SiOH ) via Si-O-Si bonds, after a first, rapid step of hydrolysis of eventual residues of the Si-O- moieties belonging to the molecule.
The same bond forms between molecules once the molecule are adsorbed and/or chemisorbed on the surface, in proximity with each other, as illustrated in the model in Figure 1.6; this cross-linking greatly contributes to the the stability of the SAM on the substrate.
This reaction is in competition with the same reaction between the hydrolyzed silyl groups of the molecules occurring in solution, that generates a polymer. Among the factors that shifts the balance between the two reactions are water content and temperature: as temperature decreases the surface reaction is favored [Ulman, 1996]. This tendency depends strictly on hydrocarbon chain length: the longer the chain, the higher the temperature below which an ordered SAM can be achieved [Ulman, 1996].
Purpose of the thesis
The aim of this thesis is the study and the development of functional surfaces for the isolation and separation of a selected class of nucleic acids, namely the messenger RNA under translation. Such molecules are associated with polysomes, supramolecular complexes where ribosomes scan the mRNA strand while synthe-sizing the encoded protein.
The final purpose of the project in which this thesis work is included, is the design and realization of a microdevice able to offer a fast, efficient and semi-automated alternative to the traditional method of purification of polyribosomes via centrifugation in sucrose gradient and extraction of the associated mRNA. Both purification and extraction traditional techniques have some operative drawback, the major being the long duration and necessity of large amounts of initial sample. The final microdevice will reunite the two processes of the purification of polysomes and the mRNA extraction from the purified polysomes on a single platform, thus reducing eventual sample loss and contamination. The scale of the sample involved will vary from a few tens of microliters to hundreds of microliters, depending on the final application. In principle, this device will be also useable in application fields, such as diagnostics, where only small amount of sample is available.
The working strategy will exploit the results obtained in this work on the im-mobilization of polyribosomes to the functionalized surfaces of the microdevice itself.
The functionalization has been carried out taking advantage of the formation of Self-Assembled Monolayers of organic molecules exposing an opportune functional group to tailor wettability and surface charge distribution of the materials com-posing the microdevice and generate an attractive interaction able to immobilize polysomes, without resorting to prior ribosome modifications.
Here, a characterization of the adhesion of polysomes on gold and silicon ox-ide plane samples functionalized with different alkanethiols and alkylsilanes is pre-sented, mainly by Atomic Force Microscopy. A proof of principle of the purification and extraction of RNA from polysomes using a silicon/Pyrex microdevice is also shown.
Chapter 3
Materials and Methods
3.1
Materials
Solid substrates: Gold substrates were produced in house at the FBK-microfabrication facility using gold with a purity of99.99% (Leybold Optics Italia S.r.l) and Highest Grade V1 mica disk, with a diameter of 0.9 cm (TedPella Inc., Redding, CA). Thermally grown silicon oxide (TG-SO) surfaces (thickness 205.3
±2.8 nm, area 1 cm2) were also produced in house at the FBK-microfabrication
facility. Silicon oxide/Pyrex microdevices (substrate area 3×3 cm2) were produced by Olivetti I-Jet (Italy).
Reagents for surface functionalization: Alkanethiols (see Table 3.1): 11-Mercaptoundecanoic acid (MCOOH), 11-Mercapto-1-undecanol (MOH), 11-Amino-1-undecanethiol hydrochloride (MNH2), 1-Undecanethiol (M-11CH3), ethanol, toluene
and anhydrous toluene (99.8%), tetrahydrofuran (99%) powders for buffer solu-tions, were purchased from Sigma-Aldrich (USA).
Silanes: (3-aminopropyl)triethoxysilane (APTES) and (3-aminopropyl)trimethoxy-silane
(APTMS) were purchased from Sigma-Aldrich (USA), N-(trimethoxysilylpropyl)-ethylene-diamine triacetic acid, trisodium salt (triCAS) 45% in water and carboxyethyl-silanetriol, disodium salt (CST) 25% in water were purchased from Gelest (USA).
Adhesion and quantification of biological materials: Pyrogen-free DEPC
water and RNase-free water were purchased from Life technologies Corporations (USA).
Quant-iT™ PicoGreen®dsDNA Assay kit (PG) and Quant-iT™ RiboGreen®RNA
Assay kit (RG) Invitrogen Ltd. (UK) were used for DNA and RNA quantification.
λDNA standard standard kit component was used for deposition on functionalized gold samples. Synthetic RNA miR21-TIO (5’-DTPA-UAGCUUAUCAGACUG-AUGUUGA-3’), DNA-TIO (5’-DTPA-TAAGTTTGAATGTCATTTCTT-3’), mod-ified at the 5’ end with dithiol phosphoramidite and their unmodmod-ified DNA com-plementary strands for AFM tips functionalizationwere purchased from Integrated
DNA Technologies inc. (USA).
Ribosome and polyribosomes were obtained from MCF-7 cell cultures and pu-rified by sucrose gradient centrifugation at FBK-LaBSSAH laboratory. See Section 3.2.3.1 for details.
Buffers: Buffer A, 30 mM Tris-HCl pH 7.5, 0.1 M NaCl, 10 mM MgCl. Buffer B, 10 mM Hepes adjusted to pH 7.4, 10 mM NaCl, 10 mM MgCl2, 20 µm/ml
cycloheximide and 3% (w/v) sucrose.
3.2
Methods
3.2.1
Analytical methods
3.2.1.1 Spectrophotometry
A V-550 UV/VIS spectrophotometer (Jasco Corporation, Japan) was employed to quantify nucleic acids concentration. For ribosomes in undiluted ribosomal and polysomal fractions absorption spectra have been recorded from 200 nm to 600 nm, with a band width of 1 nm. Quantification of ribosomes has been performed using a molar extinction coefficient of 5·107M-1cm-1 at 260 nm, after background subtraction [Algire et al., 2002].
For DNA quantification absorption spectra have been recorded from 200 nm to 350 nm, with a band width of 1 nm, using an extinction coefficient of 0.020 (μg/ml)-1cm-1.
3.2.1.2 Spectrofluorimetry
Fluorescence of DNA samples stained with PG was measured with a SPEX Fluor-Max spectrofluorimeter (Horiba Jobin Yvon, USA), using an excitation wavelength of 480 nm and recording the emission spectrum from 496 to 700 nm. The area be-tween 520 and 540 nm was integrated and the value obtained compared with a calibration curves previously worked out
RNA extracted from chips was stained with RG and measured with a SPEX FluorMax spectrofluorimeter (Horiba Jobin Yvon, USA), using an excitation wave-length of 480 nm and recording the emission spectrum from 515 to 700 nm. The area between 520 and 540 nm was integrated and the value obtained compared with a calibration curves previously worked out.
3.2.1.3 Bioanalyzer analysis
CHAPTER 3. MATERIALS AND METHODS 17
3.2.1.4 Fluorescence microscopy
Fluorescence images of DNA and RNA adsorbed on various surfaces and stained with PG and RG respectively were taken with a Leica DMLA microscope (Leica Microsystems, Germany) with a mercury lamp and a fluorescence filter cube L5 (Leica Microsystems, Germany). Samples were observed with 20x and 40x mag-nifications objectives and measured with a cooled CCD camera (DFC 420C, Leica Microsystems, Germany).
3.2.2
Surface preparation and functionalization
3.2.2.1 Gold samples preparation
Ultraflat gold surfaces were obtained by the method developed in 1993 byHegner and coworkers [Hegner et al., 1993b]. A gold layer was evaporated onto freshly cleaved mica muscovite disks, of the diameter of 0.9 cm, until a thickness of 150 nm is reached. The evaporation is performed by an electron beam evaporator (Ulvac EBX-16C with Ferrotec EV S-6 e-gun) with an evaporation rate of 0.2-0.3 Å/s at room temperature in ultra-high vacuum (base pressure of2×10−7Torr). The gold surface thus obtained was then glued to a glass support using epoxy glue (Bostik, Perfecta Chemie B.V., Goues, Nederland) and stored at room temperature.
Immediately before use, the mica was stripped offthe gold surface with a pair of tweezers, after soaking in tetrahydrofuran (THF) at room temperature for a few minutes to facilitate the mica detachment from gold.
3.2.2.2 Gold functionalization with thiols
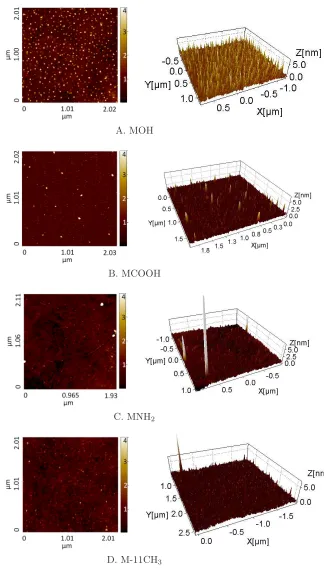
In table 3.1 the four thiols used in this work are listed, along with their con-densed formulas and molecular weight. The four terminal groups: carboxyl, amine, hydroxyl and methyl groups have been chosen to tailor mainly the charge distri-bution of the surface, as well as its hydrophobic/hydrophilic behavior.
Thiol Molecular weight Linear Formula 11-Mercaptoundecanoic acid (MCOOH) 218.36 HS(CH2)10COOH
11-Mercapto-1-undecanol (MOH) 204.37 HS(CH2)11OH
11-Amino-1-undecanethiol hydrochloride (MNH2) 239.85 HS(CH2)11NH2·HCl
1-Undecanethiol (M-11CH3) 188.37 HS(CH2)10CH3
A B
C D
Figure 3.1: MCOOH (A), MOH (B), MNH2 (C) and M-11CH3(D) thiols used to
functionalize gold substrates.
3.2.2.3 Silicon oxide silanization
A) Plasma treatment. Silicon oxide films, thermally grown on 1 cm2 silicon
substrates (TG-SO) were treated in a PDC-32Gplasma cleaner (Harrick Scientific Corporation, New York USA) with 6.8 Watt of power applied to the RF coil at a pressure of 2 mbar of argon for 2 minutes, to eliminate contaminants and activate surface silanol groups [Suni et al., 2002].
B) Wet treatment. An alternative procedure has been used to enrich the sil-icon oxide surface with silanol groups, developed by Hau et al. [Hau et al., 2003]: the TG-SO samples were first cleaned in “piranha solution” (H2SO4:H2O2= 10:1)
at 120 °C for 10 minutes to remove organic impurities, then, after rinsing exten-sively in deionized water, immersed in an aqueous solution of 1% w/v NaOH at 90°C for 30 minutes, washed in deionized water, immersed in a 3% v/v HCl aque-ous solution for 10 minutes at room temperature, and finally rinsed with copiaque-ous amounts of deionized water. During the first immersion in NaOH solution, the silicon oxide bonding are hydrolyzed to form a silanol group and silanol sodium salt; the latter is then converted in a silanol group during the immersion in HCl solution [Hau et al., 2003]:
≡Si-O-Si≡+Na+
+OH−
"≡Si-OH+≡Si-ONa (3.1) ≡Si-ONa+H++C
l−"≡So-OH+Na++C
l− (3.2)
Silanization was performed using two different silane molecules containing carboxy groups (triCAS and CST), shown in Figure 3.2 employing the following four dif-ferent protocols:
CHAPTER 3. MATERIALS AND METHODS 19
Silanization 3P: CST was dissolved at 12.7 mM in a ethanol:water (5:100) so-lution, adjusting the pH to 5 with acetic acid, and incubated 5 minutes at room temperature; the plasma treated samples were then immersed in this solution and gently stirred with an orbital shaker at 100 rpm for 30 minutes at room temperature, then rinsed with the ethanol/water solution and finally cured at 110°C for 30 minutes;
Silanization 4W: CST was dissolved at 12.7 mM in a ethanol/water (5:100) solution, adjusting the pH to 5 with acetic acid, and incubated 5 minutes at room temperature; wet treated samples were immersed in this solution and gently stirred with an orbital shaker at 100 rpm for 30 minutes at room temperature, then rinsed with the ethanol/water solution and finally cured at 110°C for 30 minutes.
Si
O CH3 O
O CH3
H3C
N N O
OH
O OH
O
OH
Si OH HO
OH OH O
triCAS CST
Figure 3.2: Carboxysilanes used to functionalize silicon oxide surfaces: N-(trimethoxysilylpropyl)ethylenediamine triacetic acid (triCAS) containing three carboxy groups, Carboxyethylsilanetriol (CST) terminating with one carboxy group.
3.2.2.4 Mica silanization
Freshly cleaved mica sheets were incubated in a aqueous solution of the silane of interest (APTMS or APTES) 0.1% v/v at room temperature for 10 minutes, then rinsed extensively in ultrapure water and dried in nitrogen stream.
3.2.3
Ribosome/polyribosomes deposition on plane samples
Already purified ribosomes and polysomes were deposited on plane surfaces using the following protocol.
3.2.3.1 Ribosome and Polysome purification
2
Fr. 1 3 4 5 6 7 8 9 10 11 12 13 14
Figure 3.3: Typical polysome sedimentation profile of a MCF-7 cell lysate after sucrose gradient centrifugation andfractionation. The sample has been divided in fractions of 1 ml, marked in this profile by the spikes in the sedimentation profile. The subpolysomal fractions 5, 6, and 7 correspond to 40S, 60S and 80S parti-cles. Several polysomal peaks, corresponding to fractions with increasing weight (fractions 10, 11, 12 and 13) are clearly visible.
days in DMEM growth medium (supplemented with 10% FBS, 2 mM glutamine, 100 units/ml penicillin, and 100 mg/ml streptomycin) at 37 °C, 5% CO2. Once
the 80% confluence was reached cells were incubated for 3-4 minutes with cyclo-heximide 10 µg/ml at 37°C to interfere with the translocation step during protein synthesis and block translational elongation trapping the ribosomes on the mRNA. Cells were washed with phosphate buffered saline (PBS + cycloheximide 10 µg/ml) and scraped directly on the plate with 300 µl lysis buffer (10 mM NaCl, 10 mM MgCl2, 10 mM Tris–HCl, pH 7.5, 1% Triton X-100, 1% sodium deoxycholate, 0.2
U/µl RNase inhibitor (Fermentas), cycloheximide 10 µg/ml, dithiothreitol 1 mM) and transferred to an Eppendorf tube. After a few minutes of incubation on ice with occasional vortexing, nuclei and cellular debris were removed by centrifuga-tion for 5 min at 12000 g at 4°C. The supernatant was directly transferred onto a 15–50% linear sucrose gradient containing 30 mM Tris–HCl, pH 7.5, 100 mM NaCl, 10 mM MgCl2, and centrifuged in a Sorvall ultra-centrifuge on a swinging
rotor for 100 minutes at 180000 g at 4°C.
In Figure 3.3 the absorbance spectrum at 254 nm of one of the utilized lysate after the centrifugation and fractionation procedure is shown. The peaks relative to the ribosome and four polysomal fractions used in the course of this work are highlighted.
The fractions have been extracted, aliquoted and flash frozen in liquid N2
CHAPTER 3. MATERIALS AND METHODS 21
3.2.3.2 Ribosome deposition
Ribosomes and polysomes from MCF7 cells, pre-purified by sucrose gradient cen-trifugation were deposited on functionalized gold surfaces as follows:
Immediately after functionalization (or stripping off the mica, in case of the bare gold) the substrates were rinsed in DEPC water1.
An aliquot of 20µl of ribosomal fraction, diluted typically ten times inbuffer A , plus sucrose in the same concentration as the ribosomal fraction’s was deposited on the substrates (micagold and functionalized gold samples) for 3 minutes. Then 150µl ofdeposition buffer (Hepes 10 mM pH 7.4, 10 mM NaCl, 10 mM MgCl2, 20
µm/ml cycloheximide and 3% (w/v) sucrose) was added and left∼1 hour at 4°C. Eventually, the sample was rinsed gently but extensively in DEPC water (treated with 10µg/ml cycloheximide, an antibiotic that inhibits ribosome detachment from the mRNA).
3.2.3.3 Polysome deposition
An aliquot of 40µl of the medium-heavy polysomal fraction (e.g. fraction 12 in the Figure 3.3), diluted four times inbuffer Aplus sucrose at the same concentration that is present in the polisomal fraction was deposited on the gold samples, imme-diately after functionalization and let to incubate for 3 minutes. Then the samples were covered with buffer B and left ∼1 hour at 4°C. The sample then was rinsed very gently with the same hepes buffer, followed by DEPC water with 10µg/ml cycloheximide, and let dry to be observed at the AFM.
3.2.4
Nucleic Acids deposition on plane samples
A) Bacteriophage λ DNA. After functionalization (described in section 3.2.2.2) the substrate have been rinsed in DEPC water, then 100µl of λDNA 1 ng/µl in Hepes buffer (10 mM pH 7.4, 10 mM NaCl, 10 mM MgCl2) were deposited
on the functionalized surfaces and left 1 hour at 4°C. The sample then was rinsed gently in the same Hepes buffer and DEPC water. Samples have been then imaged by AFM after drying.
B) Human genomic DNA. DNA was purified from whole blood of healthy donors using the Puregene Gentra System purification kit (Minnesota, USA). The quantity of recovered DNA was assessed by spectrophotometry. Genomic DNA was deposited on functionalized gold samples and observed by fluorescence mi-croscope. After functionalization (described in section 3.2.2.2) 100µl of genomic DNA 1 ng/µl in TE buffer (Tris 10 mM, EDTA 1 mM, pH 7.5) were deposited on the functionalized surfaces and left 20 minutes at room temperature, gently
1Water intended to be used with RNA, ribosomes and polysomes was treated to inhibit RNase
activity: diethylpyrocarbonate (DEPC) was diluted1 mM in sterile water and gently stirred
overnight. The water was then autoclaved at 120 °C for 20 minutes to break down the DEPC.
All solution and buffers involved in ribosome and polysome deposition experiments have been
orbitating at 40 rpm. The sample then was rinsed with 300 µl in ultra-pure wa-ter. Samples have been then covered for at least 5 minutes with the fluorescent dye Quant-iT ™ PicoGreen® (PG), which has a fluorescence quantum yield in its DNA bound form more than a thousandfold greater than the quantum yield in its free form [Singer et al., 1997], and observed with a fluorescence Leica DMLA mi-croscope (Leica Microsystems, Germany) with a mercury lamp and a fluorescence filter cube L5 (Leica Microsystems, Germany). Samples were observed with a 40x magnifications objectives and measured with a cooled CCD camera (DFC 420C, Leica Microsystems, Germany).
3.2.5
Surface characterization
3.2.5.1 Morphological characterization by AFM
Surface topography was characterized by Atomic Force Microscopy. Measurements were performed with two instruments: a Cypher AFM (AsylumResearch, Santa Barbara, CA) with a flexure scanner system in closed-loop configuration, with a full range of 40×40×5 µm3 and a NT-MDT Solver-Pro (Russia) with a scanner
system ranged 50×50×3µm3.
Samples were imaged either in air or liquid environment.
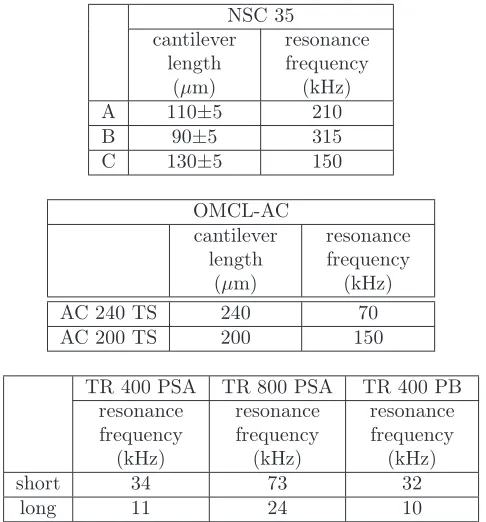
Samples in air environment were analyzed in AC mode with silicon MikroMasch NSC35 cantilevers or silicon Olympus Corporation AC 240 TS and OMCL-AC 200 TS. Samples in liquid environment, (buffer or water) were imaged with Olympus Corporation cantilevers: triangular shaped silicon nitride (TR 400 PSA and TR 800 PSA) and gold coated silicon nitride (TR 400 PB). The cantilever characteristics and nominal resonance frequencies are showed in Figure 3.4 and Table 3.2.
In all cases the tips mounted on the cantilevers are pyramidal tips with an estimated radius on the apex of 8 nm (Mikromasch NSC 35), 7 nm (Olympus AC series), 15 nm (Olympus TR PSA series) and 30 nm (Olympus TR PB series).
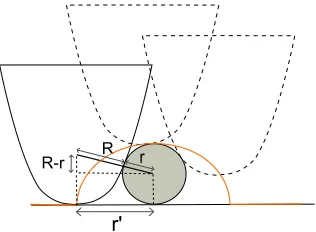
The lateral size of objects imaged with a non-zero tip radius are subjected to the phenomenon known astip-broadening: they are the result of the convolution of the actual lateral dimension of the objects and the tip shape. This phenomenon is often modeled as in Figure 3.5 where the imaged object is a sphere with radius r, while the tip is a cone with an apex curvature of radius R.
When imaging objects whose size is of the same order of magnitude of the tip radius, as in the case of ribosomes, the measured radius r’ of an object can be related to the actual radius r using the following equation:
r′
=√4rR (3.3)
where R is the tip radius.
Images of functionalized surfaces and of polysomes deposited on various sub-strates (mica, gold) were acquired in areas from 200 nm to 5µm wide, and processed (line by line levelling, and rendering) with SPIP™ V3.3.4.0 (Image Metrology, Den-mark,www.imagemet.com) and Gwyddion (gwyddion.net) software packages.
CHAPTER 3. MATERIALS AND METHODS 23
A B C
Figure 3.4: Cantilever schemes. Panel A: Mikromasch NSC 35 used for air envi-ronment AC mode analyses. The three 12-18µm high pyramidal tips are mounted on silicon nitride cantilevers (35±3)µm wide, (2.0±0.5)µm thick and (110±5)µm (A), (90±5) µm (B) and (130±5)µm (C) long. Panel B: Olympus Corporation OMCL-AC series used for air environment AC mode. A 15 µm pyramidal tip is mounted on a 240µm long, 30 µm wide and 2.7 µm thick silicon cantilever for the AC 240 TS series and on a 200µm long, 40µm wide and 3.5µm thick silicon cantilever for the AC 200 TS series. Panel C: Olympus Corporation OMCL-TR series used for liquid environment analyses in contact and taping mode. The can-tilevers thickness is 400 nm for the TR 400 series and 800 nm for the TR 800 series. The 2.9µm pyramidal tips are mounted in proximity of the apex of the triangle. (Schematics as provided in the Mikromasch and Olympus catalogues.)
NSC 35 cantilever
length (µm)
resonance frequency
(kHz)
A 110±5 210
B 90±5 315
C 130±5 150
OMCL-AC cantilever
length (µm)
resonance frequency
(kHz)
AC 240 TS 240 70
AC 200 TS 200 150
TR 400 PSA TR 800 PSA TR 400 PB resonance
frequency (kHz)
resonance frequency
(kHz)
resonance frequency
(kHz)
short 34 73 32
long 11 24 10
R r R-r
r'
Figure 3.5: Tip-broadening effect: an object represented by a sphere with radius r measured with a tip with radius R is imaged as a emispherical shape whose radius r’. When the tip and the object radii are comparable the relation between r and r’ can be obtained by simple geometrical considerations asr′
=!(R+r)2
−(R−r)2=
√
4rR.
the mean deviation of the height of each point belonging on the surface from the height meanµand is calculated as follows:
Sa= 1
M N
M
"
i=1
N
"
j=1
|z(xi, yj)−µ| (3.4) withµas:
µ= 1
M N
M
"
i=1
N
"
j=1
z(xi, yj) (3.5)
Grain analyses on ribosomes and polysomes deposited on surfaces were per-formed with Gwyddion and used to extract distributions of ribosome and polysome size values: height (the maximum value occurring inside the grain), projected area (the projected flat area of the grain), minimum and maximum diameter (the width and length of a rectangle circumscribing the grain), projected boundary length (the length of the grain boundary projected to the horizontal plane).
3.2.5.2 Chemical characterization by XPS
X-Ray Photoemission spectroscopy analyses were performed on gold samples with aSCIENTA ESCA 200 instrument while silicon oxide samples were analyzed with a KRATOS AXIS UltraDLD, both equipped with a hemispherical analyzer and a monochromatic Al Kα X-ray source (1486.6 eV) in transmission mode. Samples
were inserted in the analysis chamber (at pressure of∼5×10⁻⁹mbar) and analyzed with take-offangles relative to the sample surface of 90°, 30° and 15° corresponding to decreasing depths of analysis, with the maximum depth of about 10-12 nm at a take-offangle of 90° for both gold and silicon substrates.
CHAPTER 3. MATERIALS AND METHODS 25
background subtraction. Gaussian peaks were integrated to obtain the relative elemental composition of the sample surface.
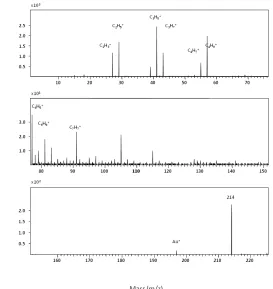
3.2.5.3 Chemical characterization by Tof-SIMS
ToF-SIMS spectra were acquired using a CAMECA TOF IV reflectron instrument using Ga+15KeV in the bunched mode (800 ps pulse width) of operation. All the spectra were acquired for 200 s and a 0.04 mm2analysis area was sampled.
Oper-ating conditions were maintained within the static regime. Charge neutralization was achieved with a pulsed low-energy (0–20 eV) electron flooding.
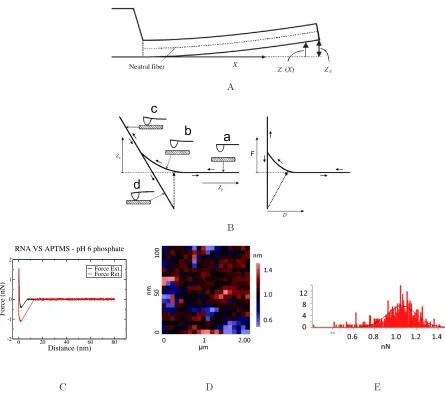
3.2.5.4 AFM: Force-distance measurements
Force-distance measurements have been performed with the Cypher AFM system. Force measurements have been taken between aminosilane (APTMS) treated mica substrates (obtained as explained in section 3.2.2.4) and silicon nitride gold coated cantilevers from Olympus Corporation (TR 400 PB) with a nominal spring constant of 90 pN/nm. Forces have been recorded either using cantilevers functionalized with a 21 base long double strand DNA (“DNA-tip”) to measure DNA-APTMS interactions, with a 24 base long single strand RNA (“RNA tip”) to measure the RNA-APTMS interactions or just after a plasma cleaning step, as a control (“Gold-tip”). The double strand DNA is formed allowing the hybridization of a 21 base long sequence (5’-TAAGTTTGAATGTCATTTCTT-3’) modified at the 5’ end with a cyclic dithiol group (DTPA) attached via a hydrocarbon chain linker and its complementary unmodified strand. The ssRNA is modified with the same molecule at the 5’ end.
Before use, cantilevers were cleaned from contaminants by Argon plasma treat-ment, using a PDC-32G plasma cleaner (Harrick Scientific Corporation, New York USA) with applied power of 6.8 Watt at a pressure of 2 mbar, for 1 minute, then immersed in a 1μM dsDNAs or ssRNAs solution in potassium phosphate buffer (1
M, pH = 6.9) for 10 minutes and then extensively rinsed with potassium phosphate buffer. In the case of the DNA, the double strand was formed in solution before the tip functionalization.
Force curves were acquired in liquid environment using a droplet cantilever holder; the pH of the solution in which the measurements were performed was varied from 4.5 to 10.5 using 20 mM ionic strength buffers, reported in Table 3.3. Data acquisition and analysis have been performed with Igor 6.2 (Wavemetrics, Oregon, USA) Asylum Research routines.
Deflection curves were registered letting the cantilever approach the sample with a speed of 80 nm/sec, starting at 150 nm (for DNA experiments) and 100 nm (for RNA experiments) from the contact point with the sample surface, and then retreating it. Force measurement data are plotted as deflection versus position of the scanner/sample holder Zpand then converted into force versus distance curves.
The deflection Zc is multiplied by the spring constant of the cantilever kc to obtain
DNA tip
pH buffer
4.5 acetate 5.6 acetate 6.5 phosphate 7 phosphate 9.2 Tris-HCl 10.5 carbonate/bicarbonate RNA tip
pH buffer
5 acetate 5.5 acetate 6 phosphate 7 phosphate 8 tris-HCl 9 carbonate/bicarbonate 10.5 carbonate/bicarbonate
Table 3.3: Buffers used in force distance AFM experiments with DNA and RNA functionalized tips.
D=Zc+Zp. In Figure 3.6 a schematics of the deflection and force versus distance curve is illustrated in panel B.
The spring constant of the cantilever can be obtained with the thermal noise
fluctuation method originally proposed by Hutter and Bechhofer [Hutter and Bechhoefer, 1993]. The AFM cantilever is considered as an harmonic oscillator in equilibrium with its
surroundings, which fluctuates in response to the thermal noise.
The term of this system Hamiltonian, relative to the oscillation is given by:
1 2mωr
#
q2$
= 1 2kc
#
Z2
c $
(3.6)
wherem is the oscillator mass,q its position andωrits resonance frequency, and
#
Z2
c
$
the mean squared deflection.
According to the equipartition theorem, each term of the Hamiltonian is equal to1/2K
BT, whereKBis the Boltzmann constant andT the temperature in Kelvin. In this way the spring constant kc can be obtained by measuring solely the mean
squared deflection.
1 2kc
#
Z2
c
$ =1
2KBT =⇒kc=
KBT
⟨Z2
c⟩
(3.7) In reality however the cantilever is not an ideal oscillator, but has a solid shape: as a consequence several vibration modes are possible, and the term 1
2kc
#
Z2
c
$
is the sum of the energy of all vibration modes. The spring constant can be obtained from the first vibration mode alone applying a correction factor equal to 0.965 in case of a triangular cantilever [Butt et al., 2005], so:
kc=
KBT
⟨Z2
1(L)⟩
(3.8) where #
Z2 1(L)
$
is the mean squared deflection relative to the first vibrational mode, dependent on the length of the cantileverL.
CHAPTER 3. MATERIALS AND METHODS 27
vibration mode relative to thermal noise oscillations can be fitted with a Lorentzian curve centered around the resonance frequencyωr [Hutter and Bechhoefer, 1993],
whose integral has been used to estimate the spring constant.
Force-distance curves were recorded both during the approach and the retrac-tion of the cantilever from the sample surface (see Figure 3.6, panel C for an example) over hundreds of points, and collected as “Force maps”. At every pH at least two maps in different sample place, each containing 400 force curves, were ac-quired, each typically over areas of 500×500 nm2for DNA experiments and50×50
nm2for RNA experiments. An example of one of such maps is shown in Figure 3.6:
the false-color scale indicates the intensity of the adhesion between tip and surface, calculated as the difference between the minumum value recorded in the retraction curve and the mean value of the non-contact region (zone a in the schematics in Figure 3.6, panel B).
Finally force histograms have been computed from every map, using a bin width of 3 pN and fitted with Gaussian curves.
3.2.6
Microdevice
3.2.6.1 Silicon/Pyrex microdevices fabrication and functionalization
Microdevices were produced by Olivetti I-Jet, starting from a 6” silicon wafer. In Figure 3.7 schematics and a 3D rendering of the microdevice are shown. Microchan-nels were patterned in the silicon oxide via Reactive Ion Etching (RIE) technology; the microchannels walls were then passivated by a 100-160 nm thick silicon ox-ide coating, grown by Low Pressure Chemical Vapour Deposition (LPCVD). The channels are coiled shaped, 100µm deep, 500µm wide and 50 cm long, containing a volume of 25µl, with a total channel surface of 11 cm2. The microdevices were
sealed by anodic bonding between the silicon substrate and a Pyrex cover, carryng two holes produced by sand blasting for fluids inlet and outlet. Finally each wafer was diced in 12 microdevices of 3×3 cm2 area.
The microdevices were then extensively washed with RNase-free water and au-toclaved for 20 minutes at 120°C before functionalization with carboxyl containing silanes (triCAS and CST). The silanization was performed following protocols simi-lar to those used for silanization of plane silicon oxide samples (explained in section 3.2.2.3):
Silanization M1: a solution of triCAS 973 mM in RNase-free water was injected in the microdevice for 2 hours, at room temperature. The solution was then removed and replaced with RNase-free waterfor three times, the microchan-nels were dried with a nitrogen streamand the microdevice incubated at 80°C for 30 minutes.
A
a
b
c
d
F
B
0 20 40 60 80
Distance (nm)
-2 -1 0 1 2
Force (nN)
Force Ext. Force Ret.
RNA VS APTMS - pH 6 phosphate
C D E
Figure 3.6: Panel A: schematic side view of a cantilever with a force applied at its end (from [Butt et al., 2005]). X is the horizontal coordinate originating at the basis of the cantilever, Z(X) is the cantilever deflection at a the position X, Zc is the cantilever deflection at its end. Panel B: on the left, schematics of a typical deflection versus Z piezo position curve (Zc versus Zp). Four schemes are shown depicting the cantilever behavior in four regimes: a. the cantilever is in non-contact regime, where the deflection Zc is zero, b. the cantilever is in a repulsive regime but not yet in contact with the sample, c. the cantilever is in contact but repulsive regime with the sample and d. the cantilever is in contact and attractive regime with the sample. On the right the corresponding Force versus Distance plot (F versus D), where the deflection Zc has been converted into Force after determining the spring constant of the cantilever and D = Zc+Zp (Adapted from [Butt et al., 2005]). Panel C: a typical Force versus Distance curve obtained in this work. In black the curve recorded during the approach of the cantilever and in red the retraction curve. Panel D: a typical force map , taken on an area of 100×100
nm2, samplingt 400 points, with a RNA tip in phosphate buffer at pH 6. The false
CHAPTER 3. MATERIALS AND METHODS 29
A B
Figure 3.7: The silicon/Pyrex microdevice used in the course of this work: schemat-ics (Panel A) and 3D rendering (Panel B). The microdevice surface is 3×3 cm. Dimensions of the microchannel are: 100µm depth, 500µm width and 50 cm long. Volume contained: 25µl.
Silanization M3: CST was dissolved at 12.7 mM in ethanol/RNase-free water (5:100) pH 5 with acetic acid, and incubated 5 minutes at room temperature; the solution was injected in the microdevice for 30 minutes at room temper-ature, then the microdevice was washed with the ethanol/RNase-free water solution three times, the microchannels were dried with a nitrogen stream
and the microdevice incubated at 110°C for 30 minutes.
Silanization M4: “piranha solution” (H2SO4:H2O2 = 10:1) was injected in the
microdevice at 120 °C for 10 minutes to remove organic impurities, then, after washing 3 times with deionized water, immersed in a solution of 1% w/v NaOH in RNase-free at 90°C for 30 minutes, washed in RNase-free water, immersed in a 3% v/v HCl in RNase-free water for 10 minutes at room temperature, and finally rinsed with copious amounts of RNase-free water. CST was dissolved at 12.7 mM in ethanol/RNase-free water (5:100) pH 5 with acetic acid, and incubated 5 minutes at room temperature, then injected in the microdevice stirred with an orbital shaker at 100 rpm for 30 minutes at room temperature; three washing steps with ethanol/RNase-free water solution were performed,the microchannels were dried with a nitrogen stream
and the microdevice incubated at 110°C for 30 minutes.
3.2.6.2 Extraction of RNA from polysome by Silicon/Pyrex microde-vice
The Silicon/Pyrex microdevice has been used to extract RNA from MCF-7 polyso-mal fractions previously purified with sucrose gradient centrifugation (see section 3.2.3.2 for details). The freshly silanized microdevices were washed with RNase free water before incubation of polysomes.
Chapter 4
Results and Discussion
4.1
Introduction
This work is aimed at developing and studying a microsystem for the purification of polysomes and extraction of the associated mRNA. Polysome isolation from cell lysate will be obtained within a microdevice, whose surfaces will be opportunely treated to enhance polysome adhesion.
The strategy chosen to allow and enhance selective polysome adhesion to the microdevice surfaces takes advantages on the fact that ribosomes, as well as nucleic acids expose many electrical charges towards the environment, due mainly to the negatively charged phosphate groups in the DNA and RNA backbone carbon chain and to many charged proteins forming the ribosome.Therefore, in the course of this work, surface modifications aimed mainly to endow the microdevice surfaces with a suitable charge distribution are investigated. The goals are: a) to investigate functional surfaces respect to their ability toward polysome adhesion and b) to characterize surfaces able to adhere or repel nucleic acids (namely mRNA) to be able to direct their adhesion to a specific region of the microdevice.
4.2
Ribosomes and Polysomes adhesion on Self
As-sembled Monolayers.
Gold substrates
Self-Assembled Monolayers (SAMs) of organic molecules constitute a convenient method to modify solid substrates superficial properties, in particular the surface chemistry, without drastically alter the substrate surface morphology. Choosing opportunely the nature of the molecule forming the SAM, and most of all its terminal group, it is possible to obtain surfaces exposing a wide range of functional groups. One of the most widely studied and well-known SAM systems is the one formed by thiols on gold (111). This system has been chosen as a model to study the adhesion of ribosomes and polysomes on gold surfaces with different kinds of
chemical functionalizations.
Four alkanethiols have been chosen to tailor mainly the charge distribution of the gold substrate in a range going from negative to neutral to positive charges, and the hydrophobicity property of the surfaces: 11-Mercaptoundecanoic acid (MCOOH), 11-Mercapto-1-undecanol (MOH), 11-Amino-1-undecanethiol (MNH2)
and 1-Undecanethiol (M-11CH3). All these thiols have the same length (11 carbon
atoms) and differ only for the terminal group, that will be exposed on the newly formed SAM surfaces: respectively a carboxyl acid, an hydroxyl, an amino and a methyl group. In environment with a pH higher than∼5 the gold surfaces modi-fied with a SAM formed by MCOOH expose the carboxyl groups mostly in their deprotonated form -COO- conversely gold modified with a MNH
2 SAM expose
protonated amino groups -NH3+ at pH lower than ∼ 9, thus endowing this two
surfaces with a neat negative and positive charge distribution at physiological pH. MOH and M-11CH3 have been adopted as neutral surfaces at physiological pH,
but with a marked hydrophilic and hydrophobic behavior.
In this chapter a morphological and chemical characterization of SAMs of alka-nethiols on ultra-flat gold samples will be first presented. The capability of this surfaces to attract and retain polysomes from a solution will be evaluated with AFM analyses, starting from polysome samples previously purified with traditional methods (sucrose gradient centrifugation) as well as the eventual degree of mor-phological degradation of the polysomes, in order to determine the most promising kind of functionalization to be employed in a purification system.
These result will be then transferred on materials more commonly used for microsystems manufacturing, such as silicon oxides, glass and polymers (PDMS) that, as any hydroxylated substrate, can be functionalized using SAMs formed by silanes. A characterization of the adhesion of polysome on silanizated silicon oxide plane samples will be carried outand finally a proof of principle of a silicon/Pyrex microdevice will be reported.
4.2.1
Characterization of gold substrates
CHAPTER 4. RESULTS AND DISCUSSION 33
0 50 100 150 200
Profile Length (nm)
1 1.2 1.4 1.6 1.8 2
Height (nm)
Gold Surface Profile
A B C
Figure 4.1: 1×1 µm2 area observed with AFM of a gold surface stripped from
mica (panel A) and its 3D reconstruction (panel B). The average roughness is Sa
= (0.15±0.01) nm. Panel C shows the profile of the surface along the white line in
panel A.
Furthermore, the mica template protects the gold surfaces before their use, which can then be produced in batches and stored for months.
Flat surfaces of gold stripped from a mica muscovite template prepared with this procedure (reported in section 3.2.2.1) were employed in the course of this work after an assessment of their morphological and chemical characteristics.
Morphology of the samples has been evaluated with atomic force microscopy: samples obtained with this procedure present a surface with large areas (from hundreds of nanometers to a fewµm in size) of flat surface: one typical example is shown in Figure 4.1. The surface average roughness Sa calculated on several samples is equal to (0.15±0.01) nm, five times greater than the average roughness
obtained on mica sheets in the same measuring conditions (0.04±0.02 nm), but
still considerably lower than a gold surface prepared by evaporation in the same conditions (∼1.71nm) and suitable for observation of ribosomes, and nucleic acids.
The chemical quality of the exposed gold can be assessed through several meth-ods.
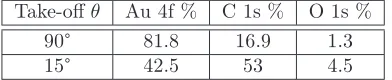
X-ray photoemission Spectroscopy (XPS) can be employed to estimate the el-emental composition of the outer layers of a sample surface. The thickness of the analyzed layer depends on the nature of the analyzed substrate and can be var-ied modifying the electron take-offangle θ relative to the surface. The maximum depth of analysis is reached at take-offangles of 90°, and for gold it corresponds to a depth of∼10-12 nm. Table 4.1 shows the chemical composition of a sample of gold stripped from mica expressed as percentage of the three most abundant elements. Carbon (C 1s) and oxygen (O 1s) come from contaminants adsorbed on the surface, as can be inferred from the fact that their amount is greater for a lower take-offangle, i.e. reducing the depth of the analysis.
Take-offθ Au 4f % C 1s % O 1s %
90° 81.8 16.9 1.3
15° 42.5 53 4.5
Table 4.1: Elemental composition of gold stripped from mica determined by XPS analysis performed at take-offangles 90° and 15°.
Analyses performed with a Time of Flight - Secondary Ions Mass Spectrometer (Tof-SIMS) on gold stripped from mica confirm the presence of a small amount of hydrocarbon contaminants well as t
![Figure 1.4: Schematic illustrations of the structure of SAMs formed from alkanethi- [Ulman, 1996]](https://thumb-us.123doks.com/thumbv2/123dok_us/541181.2053567/19.595.218.315.125.257/figure-schematic-illustrations-structure-sams-formed-alkanethi-ulman.webp)