Detecting Creative Accounting in Businesses in Financial Distress
Nikolaos Arnis1, Konstantinos Karamanis1 & Georgios Kolias1 1
University of Ioannina, Department of Accounting & Finance, Preveza, 48100, Greece
Correspondence: Nikolaos Arnis, University of Ioannina, Department of Accounting & Finance, Preveza, 48100, Greece. E-mail: narnis@teiep.gr
Received: May 2, 2019 Accepted: May 21, 2019 Online Published: May 22, 2019
doi:10.5430/afr.v8n2p232 URL: https://doi.org/10.5430/afr.v8n2p232
Abstract
This paper investigates whether the management of firms in financial distress applies creative accounting techniques in order to fine-tune the elements of their financial statements. For this purpose, the financial statements of 385 Greek bankrupt firms of the trade and manufacturing sectors for the period 2003 to 2014 were analyzed. The sample was divided into two sub periods; in the period before the financial crisis, that is from 2003 to 2008, and the period 2009 to 2014 during which the Greek economy was in crisis and recession. By applying factor analysis, five financial ratios were selected, which formed the independent variables in a Discriminant Analysis (MDA) and Logit models in order to find those firms which, while they were bankrupt they were classified in the last period of their operation as healthy (type I error).By selecting these firms (common to both models), their accounting data for the last two years before they went bankrupt have been investigated in order to determine whether they have been affected by the application of creative accounting methods. The results showed that the management of some of the selected firms applied creative accounting techniques during the last year of operation before their bankruptcy, which led to the manipulation and falsification of the published financial statements during the period before the financial crisis. However, this is not the case for the period 2009 to 2014,because the economic crisis affects the behavior of managers in applying creative accounting, which is owing to the changes in market rules.
JEL Classification: C38, C53, G33, M41
Keywords: creative accounting, financial distress, bankruptcy classification, financial and accounting ratios
1. Introduction
The phenomenon of creative accounting over the last 30 years shows an upward trend and, regardless of the reasons firms are driven to it, the disclosure of its application affects the reliability of the financial statements, resulting in an impact on the borrowing cost, the share price, the confidence of investors and regulators, as well as on the company's relationships with its customers and suppliers.
The cases of firms which collapsed under the weight of scandals and creative accounting, concealing their true financial condition, intrigued several researchers on the basis of study of creative accounting applied by the firms' management (see, e.g. (Healy PM, Palepu KG., 2003)).
The directors of firms in financial distress and high risk of bankruptcy, in order to prolong the economic life of their firms, hoping for a better future economic environment, misrepresent the financial statements through appropriate accounting methods and techniques, making their informative content misleading.
(Argenti J., 1976) states that when the enterprise is close to bankruptcy, there is an increased interference by the directors in order to alter the financial statements. (Rezaee Z, Rilay R., 2009) in their book, Financial Statement Fraud Prevention and Detection, report that the characteristics of accounting fraud are the fraudulent alteration of magnitudes, documents or business transactions, omissions or distortions of facts, accounts and other information from the financial statements, the deliberate misapplication, interpretation and implementation of accounting standards, and the use of accounting techniques to manage illicit benefits.
The main reasons why managers and senior executives of firms in financial distress are led to the implementation of methods and techniques of creative accounting, in order to alter the financial data and embellish their financial statements are:
problem.
∙ In order not to disturb the confidence or in an attempt to restore disturbed relationships with customers and suppliers due to the poor financial position of the business.
∙ Extending the life of the business so that executives or senior executives, using illegal practices and accounting fraud, can reap benefits before the final collapse and bankruptcy.
∙ Benefits sought after by managers for as long as the business is alive, given that their compensation is often linked either to the increase in published earnings or to the increase in the share price.
∙ The resistance to stock collapse and the maintenance of the stock market price of the company.
∙ The creation of favorable conditions for the takeover of the business by other firms or the defense against takeover attacks by other firms.
∙ To conceal errors have been made in management.
In order to bring about the deterioration of the financial data and the embellishment of their financial statements, the directors of the firms follow various manipulation practices, which often exceed the limits of legality, and whose application and scope also depend on the mechanisms and procedures (business environment) that apply in each country.
According to (Leuz C, Nanda D, Wysocki P., 2003) and (Bhattacharya U, Daouk H, Welker M., 2003) in countries where the application of legislation is highly lax and investor protection is not appropriate, earnings management is more intensively used.
Creative accounting is usually done by manipulating the accounts of fixed assets, liabilities, sales - revenues, and expenses, but also by changing methods and accounting policies.
Such manipulation practices may include: ∙ Creating delusive and virtual revenue.
∙ Manipulating real activities, giving excessive sales discounts at the end of the year.
∙ Alteration (increase) of the end-of-year inventory resulting in lower cost of goods sold and increase in gross profit.
∙ Appropriate management of accrued accounts and breach of the accrual principle. ∙ The avoidance of deletion of spoiled inventories or damaged and non-operating fixed assets.
∙ Accounting estimates and policies that set the accounting numbers and constitute a hidden form of earnings management, e.g. reduced provisions for bad debts.
∙ The capitalization of expenses, i.e. the recording of various operating expenses (i.e. expenses of acquired and improving fixed assets) as costs, which are subject to amortization.
∙ Shifting and offsetting expenses in the next management period.
∙ Changes in accounting policies (depreciation method, depreciation rate, asset valuation method).
∙ The conditional policy change in the securities held by the company and their transfer from the investment portfolio to the trading portfolio.
∙ In general, the non-recording of accounting events that affects the company's finances.
In this paper, factor analysis was used to highlight the independent variables that are most important in predicting business bankruptcy. Applying models of Multiple Discriminant Analysis (MDA) and Logit, it was found that the predictive capacity (classification rate) of both models declined in the last year before bankruptcy, categorizing some of the bankrupt firms as healthy (type I error).
techniques of exercising creative accounting used by firms in financial distress before the bankruptcy event occurs, as well as on methods for its detection and tracing.
2. Literature Review
According to the relevant literature and the results of the various studies, the managers and directors of firms follow earnings management methods, which vary corresponding to the incentives that exist each time, in order to conceal their real financial situation.
Houston R., 2016) examined the tendency of troubled firms towards earnings management and the impact on investors' response. They found that firms in financial distress manage earnings considerably more than companies that are not experiencing financial distress. (Dutzi A, Rausch B., 2016) reviewed the existing literature and found that accounting behavior in businesses experiencing problems in the period before failure is ambiguous. (Nagar Neerav, Sen Kaustav., 2016) examine Indian firms’ earnings management strategy, which is related to the severity and extent of the economic downturn, and say that the managers of the companies in distress are managing profits in order to cover the unfavorable performance and to obtain more liquidity from the banks, or for their personal benefit. They also report that they are likely to engage in inappropriate revenue recognition and manipulation of expenses, liabilities and accounts receivable. (Humeedat ΜM., 2018) examines the role of earnings management in order to avoid financial distress and improve profitability in 58 industrial companies listed on the Amman Stock Exchange (Jordan) for the period 2011 to 2016. Empirical results have shown that earnings management is not affected by the outcome of the Altman Z-score model and that there is a positive relationship with the debt to equity ratio, as well as a positive relationship between dividend per share, return on equity, and earnings management.( Ranjbara S, Gholamreza FA., 2018), investigating companies listed on the Tehran Stock Exchange for the period 2010-2015, and using linear regression models, concluded that firms in financial distress are more involved in earnings management than companies that do not have financial problems.
From the above review of the literature, it is evident that, indeed, in various periods prior to bankruptcy, a variety of techniques of creative accounting are applied by companies that are in a state of financial distress, and in order to determine the time and scope of their implementation, different methods of analyzing their financial data are followed. Moreover, the economic environment and macroeconomic characteristics, like economic crises, seems to be drivers for the behavior of firms regarding the application of the adaptation of creative accounting methods.
In the present work, at first, classification models were used to classify sample enterprises into bankrupt and non-bankrupt. The predictive failure of the two above-mentioned models in the last year before bankruptcy in relation to the previous years (i.e. the projected reduction in predictive capacity) for some of the sample companies leads us to assume the widespread application of creative methods and techniques of creative accounting during the last year of their operation. This hypothesis is verified by looking at the evolution over time of certain financial magnitudes of companies (such as inventories, sales, profits and losses) and the favorable changes in these figures in the last year before bankruptcy, which resulted in incorrect classification of the companies by the MDA, Logit models showing a number of companies that went bankrupt as healthy.
3. Data Description
The data of the bankrupt Greek firms were gathered by the Hellenic Statistical Authority while the search regarding the financial data of the financial statements was carried out by ICAP GROUP SA.
The data and characteristics of the final sample of the bankrupt firms are as follows:
∙ The number of firms in the sample amounted to 385 and concerns firms whose published financial data refer to the period 2003 - 2014.
∙ All the firms in the sample have the legal form of the public limited company and belong to the trade and manufacturing sectors.
∙ Bankruptcy is the result of the formal bankruptcy process.
∙ The financial statements of the sample firms were prepared based on the principles of the Greek General Accounting Standards.
∙ In the case of non-availability of financial statements, for some years before bankruptcy, the latest available data were used.
∙ A random sample of 385 non-bankrupt firms, which were matched to the bankrupt ones, based on year, sector and sub-sector was selected. The random selection procedure is preferred to avoid bias problems. ∙ The sample of both bankrupt and healthy businesses includes profitable (whose bankruptcy was probably
due to liquidity problems) and loss-making firms.
∙ The sample included firms whose net sales were less than € 40,000,000. 4. Methodology - Econometric Analysis
For the purposes of the research, the planning of the analysis includes the following steps:
∙ Separating sample firms into two sub periods. The period before the economic crisis (2003-2008) and in the period 2009 - 2014, during which the Greek economy was in crisis and recession.
∙ Developing discriminant analysis (MDA) and Logit probability (Logit) models for each period in order to find those firms that while bankrupt, appear healthy for their last operating period (Type I error).
∙ Selection of those firms that appear to be healthy while bankrupt, which are common set in the classification for both models, forthe 1st and 2nd year before bankruptcy.
∙ Investigating and reviewing the actual financial information of the above firms during the last two years of their pre-bankruptcy period in order to determine whether they have been affected by potential earnings management and what possible practices have been followed.
4.1 Selection of Financial Ratios (Independent Variables)
The criteria with which the financial indicators were initially selected are:
∙ Their usefulness and explanatory power, which has been acknowledged in earlier studies for other countries as well (Chen KH, Shimerda TA., 1981).
∙ Their frequency and popularity, with which they appear in the relative literature (Altman E., 1968).
∙ Coverage of all operational features of the company such as Liquidity, Activity, Capital Efficiency, Capital Structure (Dambolena I, Khoury S., 1980).
Table1 presents the financial ratios that cover a wide range of information and underline the qualitative features of the samples.
Table 1. Variables description
Variable Description Variable Description
x1 Sales to Total Assets x8 Net Profit Margin
x2 EBIDTA to Total Assets x9 Return on Capital Employed
x3 Net Working Capital to Total Assets x10 Return on Equity
x4 Total Liabilities to Total Assets x11 Interest Coverage by EBITDA
x5 Current Assets to Current Liabilities x12 Sales to Receivables
x6 Gross Profit Margin x13 Total Reserves to Total Assets
x7 Equity to Total Liabilities x14 Operating Cash Flows to Total Assets
4.2 Factor Analysis
The descriptive statistics on the bankrupt and healthy firms in the sample are listed in the table 2 below.
Table 2. Descriptive statistics of bankrupt firms in the sample
Variable description Variable Mean Std. Dev. Min Max
Sales to Total Assets x1 1.17 1.15 0.02 8.81
Ebitda to Total Assets x2 0.04 0.10 -0.47 0.36
Net Working Capital to Total Assets x3 0.08 0.27 -1.07 0.77
Total liabilities to Total Assets x4 0.79 0.23 0.14 1.77
Current Assets to Current Liabilities x5 1.43 1.79 0.17 15.84
Gross Profit Margin x6 0.27 0.16 0.02 1.00
Equity to Total liabilities x7 0.44 0.84 -0.43 6.21
Net Profit Margin x8 -0.07 0.35 -2.65 0.25
Return on Capital Employed x9 -0.01 0.11 -0.64 0.30
Return on Equity x10 0.11 1.00 -4.96 5.75
Ebitda to interest expenses x11 3.58 40.62 -206.79 411.05
Sales to Receivables x12 6.03 20.61 0.06 192.18
Total Reserves to Total Assets x13 -0.05 0.31 -2.01 0.34
Operating Cash Flows to Total Assets x14 0.04 0.15 -0.45 0.58
The procedure is essentially based on the estimations of the common factors, as follows: a) estimating the correlations of the variables, b) determining the number of factors and estimating the model, c) Interpreting the factors in better way by rotating the model, d) affirmation of the adequacy of the model.
Table 3. Factor variance – factor weights
Factors Eigenvalues Differences Proportions Cumulative
F1 3.75 1.21 0.27 0.27
F2 2.55 1.12 0.18 0.45
F3 1.43 0.37 0.10 0.55
F4 1.06 0.05 0.08 0.63
F5 1.01 0.09 0.07 0.70
F6 0.92 0.07 0.07 0.77
F7 0.85 0.22 0.06 0.83
F8 0.64 0.08 0.05 0.87
F9 0.55 0.05 0.04 0.91
F10 0.51 0.17 0.04 0.95
F11 0.34 0.10 0.02 0.97
F12 0.25 0.15 0.02 0.99
F13 0.10 0.05 0.01 1.00
F14 0.05 0.00 1.00
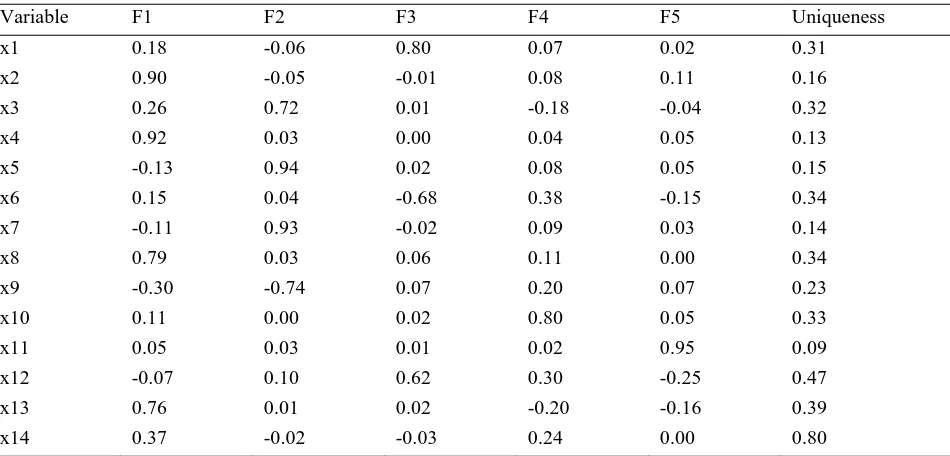
variance of the variable is not adequately explained by the common factors (e.g. the case of variable x14). The variables with the higher loading at each factor are appropriate for the analysis.
Table 4. Rotated factor loadings (pattern matrix) and unique variances
Variable F1 F2 F3 F4 F5 Uniqueness
x1 0.18 -0.06 0.80 0.07 0.02 0.31
x2 0.90 -0.05 -0.01 0.08 0.11 0.16
x3 0.26 0.72 0.01 -0.18 -0.04 0.32
x4 0.92 0.03 0.00 0.04 0.05 0.13
x5 -0.13 0.94 0.02 0.08 0.05 0.15
x6 0.15 0.04 -0.68 0.38 -0.15 0.34
x7 -0.11 0.93 -0.02 0.09 0.03 0.14
x8 0.79 0.03 0.06 0.11 0.00 0.34
x9 -0.30 -0.74 0.07 0.20 0.07 0.23
x10 0.11 0.00 0.02 0.80 0.05 0.33
x11 0.05 0.03 0.01 0.02 0.95 0.09
x12 -0.07 0.10 0.62 0.30 -0.25 0.47
x13 0.76 0.01 0.02 -0.20 -0.16 0.39
x14 0.37 -0.02 -0.03 0.24 0.00 0.80
Finally, taking into account the results of the factor analysis, the variables used in the two models are as follows:
Table 5. Variables used in the models
Variable description Variables
Sales to Total Assets x1
Ebitda to Total Assets x2
Debt to Total Assets x4
Current Assets to Current Liabilities x5
Interest Coverage by EBITDA x11
4.3 Econometric Analysis
The techniques chosen to investigate the prediction of failure and bankruptcy of the firms are the methods of multiple discriminant analysis (MDA) and logarithmic probability model (Logit).
4.3.1 The Method of Linear Discriminant Analysis
Discriminant analysis (for a presentation of the method, see, e.g. McLachlan GJ., 1992) is used in order to describe the differences between two or more groups, with a view to exploiting these differences so as to classify to a known group any observation that is not known to which group it belongs. Assuming that in each group i, the cumulative distribution function of variables x is normal with mean μι and co-variance Σ, identical for each group, the following
formula is used. It is noted that the equal variance condition should be met; otherwise a non-linear method should be chosen (e.g. quadratic discriminant analysis) :
𝑓(𝐱|𝜇𝑖, 𝛴) = 1
(2𝜋)𝑝 2⁄ |𝚺|1 2⁄ 𝑒− 1
2(𝐱−𝜇𝑖)𝚺(𝐱−𝜇𝑖)
The above formula classifies each observation in the group for which the probability pif(x|μι) is greater.
The classification (discriminant) function is a linear combination of independent variables (financial ratios, x), which isolates those characteristics from the observations under consideration, which make the discrimination of the groups distinct, giving a score Z to each enterprise:
𝛧 = 𝑏1𝑥1𝑖+ 𝑏2𝑥2𝑖+ ⋯ + 𝑏𝑘𝑥𝑘𝑖 (1)
where
Χv: independent variables, v=1,2..,k, the number of variables,
and Ζ the discriminant score.
The discrimination will be better as the variance between the groups is high and the variance within the group is low.
4.3.2 The Logarithmic Probability Model (Logit)
The Logit model is a nonlinear regression model specifically designed to estimate dependent binary variables. It gives the probability that the dependent variable will get the value 1, given the values of the independent variables, by adopting techniques leading the estimated values to fluctuate in the range (0,1). Logit models use the cumulative standard logistic distribution function to predict the probability that the dependent variable gets the value 1:
𝑷𝒓(𝒚𝒊= 𝟏|𝒙𝒊) = 𝒆𝒙𝒊𝒃
𝟏 + 𝒆𝒙𝒊𝒃 Therefore, according to the above, the model to be used is in the form:
𝑷𝒓(𝑦 = 1|𝐱) = 𝑭(𝑐 + 𝑏1𝑥1 + 𝑏2𝑥2 + ⋯ + 𝑏𝑘𝑥𝑘)
5. Results
Applying the models of discriminant analysis and Logit, the results for the two periods and for the 1st and 2nd year before the actual bankruptcy of the 385 firms are shown in Table 6 below.
Table 6. Comparative table of prediction of bankrupt firms in the sample
PRE-CRISIS PERIOD
2003 - 2008
CRISIS PERIOD
2009 - 2014
1
st Year
172 firms
2nd Year 172firms
1st Year 213 firms
2nd Year 213firms
MDA 61,90 % 66,67 % 77,38 % 72,61 %
LOGIT 61,90 % 75,00 % 81,30 % 76,47 %
In the period before the financial crisis, 2003-2008, the predictive capacity of the MDA and Logit models declined in the last year before bankruptcy, which is not the case during the economic crisis 2009-2014.This leads us to the conclusion that in the period before the financial crisis, earnings management practices were applied by the firms in order to improve their financial statements. The analysis of the total of 385 bankrupt firms in the sample showed that 84 firms in the last accounting period before the bankruptcy were ranked as healthy for both MDA and Logit models, while in fact during that period they were bankrupt (Type I error): 43 during the period 2003-2008 and 41 during 2009-2014.The upward trend in inventories and sales (Tables 7 and 8), as the bankruptcy firms approach the collapse, in the last year before that, reinforces the conclusion that creative accounting was exercised by the managers, with the aim of increasing profitability or reducing losses by misrepresenting the financial statements, which is achieved by intervening both in the end-of-year inventory and in sales.
Table 7. Inventories, sales, and profits evolution of means, period 2003 – 2008
YEAR BEFORE
BANKRUPTCY INVENTORIES SALES PROFITS
NUMBER OF FIRMS
-1 2.251.628 10.230.365 227.594 20
-2 1.985.159 8.992.093 164.565 20
Table 8. Inventories, sales, and losses evolution of means, period 2003 – 2008
YEAR BEFORE
BANKRUPTCY INVENTORIES SALES LOSSES
NUMBER OF FIRMS
-1 2.341.512 8.955.637 -478.299 23
In contrast, during the period of the financial crisis and the recession of the Greek economy, from 2009 to 2014, there is a normal evolution of inventories, sales, profits and losses in relation to the time of bankruptcy, showing downward trends in the evolution of stocks, sales, and profits and upward trends in losses (Tables 9 and 10).
Table 9. Inventories, sales, and profits evolution of means, period 2003 – 2008
YEAR BEFORE
BANKRUPTCY INVENTORIES SALES PROFITS
NUMBER OF FIRMS
-1 1.592.759 11.360.550 155.253 17
-2 1.617.729 12.053.088 184.010 17
Table 10. Inventories, sales, and losses evolution of means, period 2003 – 2008
YEAR BEFORE
BANKRUPTCY INVENTORIES SALES LOSSES
NUMBER OF FIRMS
-1 1.062.576 3.164.163 -864.729 24
-2 2.099.816 6.613.186 -577.188 24
5. Conclusions
According to the results of the prediction for the bankrupt firms , in the trade and manufacturing sector there is a possible manipulation of the financial data, with the aim of falsifying-embellishing the financial statements, which is documented as follows:
For the period 2003-2008, the predictive ability of the MDA and Logit models is declining in the last year before bankruptcy compared to previous years. Normally, the rate of predictive capacity is rising as an enterprise approaches bankruptcy, as there is a steady deterioration over time. This fact of the worst overall behavior of the two models, a year before bankruptcy, compared to previous years, leads us to the conclusion that financial data of a number of firms are being altered by using creative accounting methods.
Examining the actual financial data of the firms (common to both models) that appear to be solvent while they were bankrupt during the next accounting period (type I error), it is revealed that there is a significant improvement in key financial figures such as sales, or overestimation of assets and earnings in the last year of their operation before bankruptcy compared to previous years.
As can be seen from the analysis of real accounting data, the methods of altering them were based on:
The increase in sales which is achieved either by creating fictitious sales or by manipulating real activities giving excessive discounts.
The deterioration of the end-of-year inventory, which affects, on the one hand, the results of the end of the year (showing profits or decreasing the losses) and, on the other hand, on the balance sheet and in particular on current assets.
In contrast, the percentage of the predictive capacity of the models (MDA) and (Logit) in the period 2009 - 2014, when the Greek economy was in crisis and recession, appear as to have been increasing in the last year before bankruptcy, compared to previous years, which is considered normal and leads us to the conclusion that managers do not exercise creative accounting in this particular period. This is explained by the fact that in times of recession the economic difficulties of already burdened firms are even more serious, and the managers' effort to alter financial data and results are limited. In addition the intensity of utilizing creative accounting is reduced because the economic crisis creates new conditions in the market resulting in a change of suppliers’ and banks’ credit policy as well as of household consumption behavior, which affects firms’ costs and revenues.
References
Altman E. (1968). Financial Ratios, Discriminant Analysis and the Prediction of Corporate Bankruptcy. The Journal of Finance, 23(4), 589-609. https://doi.org/10.1111/j.1540-6261.1968.tb00843.x
Argenti J. (1976). Corporate planning and corporate collapse. Long Range Planning, 9(6), 12-17. https://doi.org/10.1016/0024-6301(76)90006-6
Beasley MS, Carcello JV, Hermanson DR, Nead TL. (2010). Fraudelent Financial Reporting 1998 – 2007. An Analysis of U.S. Public Companies. COSO. 2010; http://www.coso.org/documents/cosofraudstudy2010.pdf
Bhattacharya U, Daouk H, Welker M. (2003). The world price of earnings opacity. The Accounting Review, 78(3), 641-678. https://doi.org/10.2308/accr.2003.78.3.641
Bryan D, Janes T, Tiras SL. (2014). The role that fraud has on bankruptcy and bankruptcy emergence. Journal of Forensic and Investigative Accounting, 6(2), 126–156.
Campa D, Camacho-Minano M. (2014). Earnings management among bankrupt non-listed firms: evidence from Spain. Spanish Journal of Finance and Accounting, 43(1), 3-20. https://doi.org/10.1080/02102412.2014.890820
Charitou A, Lambertides N, Trigeorgis L. (2007b). Earnings behaviour of financially distressed firms: The role of institutional ownership. Abacus, 43(3), 271-296. https://doi.org/10.1111/j.1467-6281.2007.00230.x
Charitou A, Lambertides N, Trigeorgis L. (2007a). Managerial discretion in distressed firms. The British Accounting Review, 39(4), 323-346. https://doi.org/10.1016/j.bar.2007.08.003
Chen KH, Shimerda TA. (1981). An Empirical Analysis of Useful Financial Ratios. Financial Management, 10(1), 51-60. https://doi.org/10.2307/3665113
Dambolena I, Khoury S. (1980). Ratio stability and corporate failure. The Journal of Finance, 35(4), 1017-1026. https://doi.org/10.1111/j.1540-6261.1980.tb03517.x
Dechow P, Sloan R, Sweeney A. (1995). Detecting Earnings Management. The Accounting Review, 70(2), 193-225.
Degeorge F, Patel J, Zeckhauser, R. (1999). Earnings Management to Exceed Thresholds. Journal of Business, 72(1), 1-33. https://doi.org/10.1086/209601
Dutzi A, Rausch B. (2016). Earnings Management before Bankruptcy: A Review of the Literature. Journal of Accounting and Auditing: Research & Practice. https://doi.org/10.5171/2016.245891
Habib A, Bhuiyan MBU, Islam A. (2013). Financial distress, earnings management and market pricing of accruals during the global financial crisis. Managerial Finance, 39(2), 155-180. https://doi.org/10.1108/03074351311294007
Healy PM, Palepu KG. (2003). The Fall of Enron. Journal of Economic Perspectives, 17(2), 3-26. https://doi.org/10.1257/089533003765888403
Howe J, Houston R. (2016). Earnings Management, Earnings Surprises and Distressed Firms. Accounting and Finance Research, 5(1), 64-87. https://doi.org/10.5430/afr.v5n1p64
Humeedat ΜM. (2018). Earnings Management to Avoid Financial Distress and Improve Profitability: Evidence from Jordan. International Business Research, 11(2), 222 https://doi.org/10.5539/ibr.v11n2p222
Jones J. (1991). Earnings management during import relief investigations. Journal of Accounting Research, 29(2), 193-228. https://doi.org/10.2307/2491047
Kalunki JP, Martikainen T. (1999). Financial failure and managers accounting responses: Finnish evidence. Journal of Multinational Financial Management, 9, 15-26. https://doi.org/10.1016/S1042-444X(98)00046-2
Kim JO, Mueller CW. (1978). Factor analysis: Statistical methods and practical issues. (Sage University Paper Series on Quantitative Applications in the Social Sciences, series no. 1978b; 07-014). Newbury Park, CA: Sage.
Kim JO, Mueller CW. (1978). Introduction to factor analysis: What it is and how to do it", (Sage University Paper Series on Quantitative Applications in the Social Sciences, series no.1978a; 07-013). Newbury Park, CA: Sage.
Lara JMG, Osma BG, Neophytou E. (2009). Earnings quality in ex-post failed firms. Accounting and Business Research, 39(2), 119-138. https://doi.org/10.1080/00014788.2009.9663353
Leuz C, Nanda D, Wysocki P. (2003). Earnings Management and Investor Protection: an International Comparison.
Journal of Financial Economics, 69(3), 505-527. https://doi.org/10.1016/S0304-405X(03)00121-1
McLachlan GJ. (1992). Discriminant Analysis and Statistical Pattern Recognition. John Wiley & Sons Inc., New York. https://doi.org/10.1002/0471725293
Miko NU, Kamardin H. (2014). Detecting Earnings Management: Comparative Analysis of Models in Nigeria.
Nagar Neerav, Sen Kaustav. (2016). Earnings Management Strategies during Financial Distress. Working paper, Indian Institute of Management. (ΙΙM-AHMEDABAD), 1-42
Ranjbara S, Gholamreza FA. (2018). The effect of financial distress on earnings management and unpredicted net earnings in companies listed on Tehran Stock Exchange. Management Science Letters, 8, 933-938. https://doi.org/10.5267/j.msl.2018.6.015
Rezaee Z, Rilay R. (2009). Financial Statement Fraud. Prevention and Detection. 2nd Edition, John Wiley and Sons, NY, ISBN: 978-0-470-45570-8
Rosner RL. (2003). Earnings manipulation in failing firms. Contemporary Accounting Research, 20(2), 361-408.https://doi.org/10.1506/8EVN-9KRB-3AE4-EE81
Roychowdhury S. (2006). Earnings management through real activities manipulation. Journal of Accounting and Economics, 42(3), 335-370. https://doi.org/10.1016/j.jacceco.2006.01.002
Smith M, Kestel J, Robinson P. (2001). Economic recession, corporate distress and income increasing accounting policy choice. Accounting Forum, 25(4), 335-352. https://doi.org/10.1111/1467-6303.00070
Sweeney A. (1994). Debt covenant violations and managers' responses. Journal of Accounting and Economics, 17(3), 281-308. https://doi.org/10.1016/0165-4101(94)90030-2
Appendix
1. Period 2003 – 2008, before the financial crisis
1.1. One year before bankruptcy (sample size: 172 firms)
Table 11. Estimation of model coefficients
Variable
Models
Discriminant Logit
Unstandardized coef. Coefficients p-values
Χ1 -0.93 -1.56 0.06
Χ2 -1.25 3.37 0.49
Χ4 0.63 7.55 0.04
Χ5 -0.10 -0.12 0.90
Χ11 0.00 -0.02 0.20
Cons -0.63 -4.45 0.18
Table 12. Predictive capacity of the models
Predictive capacity Models
Discriminant Logit
Prediction of bankrupt 61.90 % 61.90 %
Prediction of healthy 66.67 % 76.19%
Total prediction 64.29 % 69.05 %
Type I error 38.10 % 38.10 %
Type II error 33.33 % 23.81 %
1.2. Two years before bankruptcy (sample size: 172 firms)
Table 13. Estimation of model coefficients
Variable
Models
Discriminant Logit
Unstandardized coef. Coefficients p-values
Χ1 -0.02 -0.05 0.91
Χ2 -7.57 -13.76 0.01
Χ4 2.81 4.20 0.08
Χ5 -0.13 -0.01 0.99
Χ11 0.00 0.00 0.28
ConS -1.68 -2.56 0.26
Table 14. Predictive capacity of the models
Predictive capacity Models
Discriminant Logit
Prediction of bankrupt 66.67 % 75.00 %
Prediction of healthy 75.00 % 75.00 %
Total prediction 70.83 % 75.00 %
Type I error 33.33 % 25.00 %
Type II error 30.14 % 25.00 %
Total error 29.17 % 25.00%
2. Period 2009 – 2014, during the financial crisis
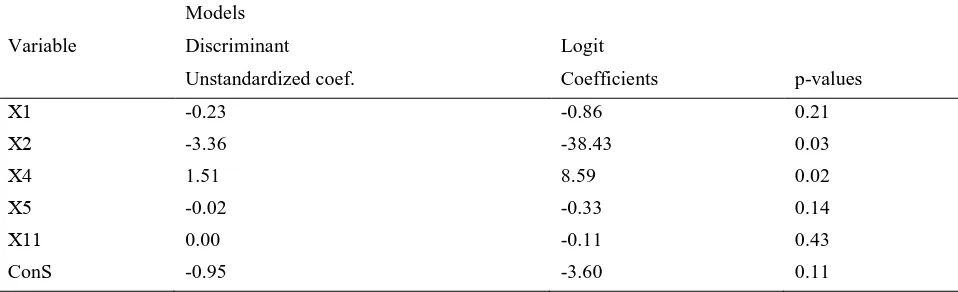
2.1 One year before bankruptcy (sample size: 213 firms)
Table 15. Estimation of model coefficients
Variable
Models
Discriminant Logit
Unstandardized coef. Coefficients p-values
Χ1 -0.23 -0.86 0.21
Χ2 -3.36 -38.43 0.03
Χ4 1.51 8.59 0.02
Χ5 -0.02 -0.33 0.14
Χ11 0.00 -0.11 0.43
Table 16. Predictive capacity of the models
Predictive capacity Models
Discriminant Logit
Prediction of bankrupt 77,38 % 81,30 %
Prediction of healthy 87,30 % 87.30 %
Total prediction 82,34 % 84.30 %
Type I error 22.62 % 18,70 %
Type II error 12.70 % 12.70 %
Total error 17.66 % 15,70 %
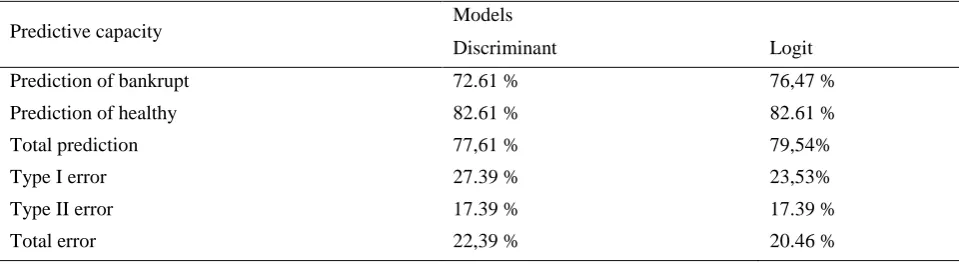
2.2. Two years before bankruptcy (sample size: 213 firms)
Table 17. Assessment of model coefficients
Variable
Models
Discriminant Logit
Unstandardized coef. Συντελεστές p-values
Χ1 0.06 0.07 0.91
Χ2 -4.71 6.75 0.60
Χ4 3.08 8.91 0.01
Χ5 -0.06 -0.13 0.46
Χ11 0.00 -0.42 0.15
ConS -2.29 -6.48 0.02
Table 18. Predictive capacity of the models
Predictive capacity Models
Discriminant Logit
Prediction of bankrupt 72.61 % 76,47 %
Prediction of healthy 82.61 % 82.61 %
Total prediction 77,61 % 79,54%
Type I error 27.39 % 23,53%
Type II error 17.39 % 17.39 %