METHODOLOGY
BAMscale: quantification of next-generation
sequencing peaks and generation of scaled
coverage tracks
Lorinc S. Pongor
1*, Jacob M. Gross
1, Roberto Vera Alvarez
2, Junko Murai
1, Sang‑Min Jang
1, Hongliang Zhang
1,
Christophe Redon
1, Haiqing Fu
1, Shar‑Yin Huang
1, Bhushan Thakur
1, Adrian Baris
1, Leonardo Marino‑Ramirez
2,
David Landsman
2, Mirit I. Aladjem
1*and Yves Pommier
1*Abstract
Background: Next‑generation sequencing allows genome‑wide analysis of changes in chromatin states and gene expression. Data analysis of these increasingly used methods either requires multiple analysis steps, or extensive computational time. We sought to develop a tool for rapid quantification of sequencing peaks from diverse experi‑ mental sources and an efficient method to produce coverage tracks for accurate visualization that can be intuitively displayed and interpreted by experimentalists with minimal bioinformatics background. We demonstrate its strength and usability by integrating data from several types of sequencing approaches.
Results: We have developed BAMscale, a one‑step tool that processes a wide set of sequencing datasets. To demon‑ strate the usefulness of BAMscale, we analyzed multiple sequencing datasets from chromatin immunoprecipitation sequencing data (ChIP‑seq), chromatin state change data (assay for transposase‑accessible chromatin using sequenc‑ ing: ATAC‑seq, DNA double‑strand break mapping sequencing: END‑seq), DNA replication data (Okazaki fragments sequencing: OK‑seq, nascent‑strand sequencing: NS‑seq, single‑cell replication timing sequencing: scRepli‑seq) and RNA‑seq data. The outputs consist of raw and normalized peak scores (multiple normalizations) in text format and scaled bigWig coverage tracks that are directly accessible to data visualization programs. BAMScale also includes a visualization module facilitating direct, on‑demand quantitative peak comparisons that can be used by experimental‑ ists. Our tool can effectively analyze large sequencing datasets (~ 100 Gb size) in minutes, outperforming currently available tools.
Conclusions: BAMscale accurately quantifies and normalizes identified peaks directly from BAM files, and creates coverage tracks for visualization in genome browsers. BAMScale can be implemented for a wide set of methods for calculating coverage tracks, including ChIP‑seq and ATAC‑seq, as well as methods that currently require specialized, separate tools for analyses, such as splice‑aware RNA‑seq, END‑seq and OK‑seq for which no dedicated software is available. BAMscale is freely available on github (https ://githu b.com/ncbi/BAMsc ale).
Keywords: Histone modifications, Expression, ATAC‑seq, ChIP‑seq, NS‑seq, Replication timing, Replication origins, RNA‑seq, SLFN11
© The Author(s) 2020. This article is licensed under a Creative Commons Attribution 4.0 International License, which permits use, sharing, adaptation, distribution and reproduction in any medium or format, as long as you give appropriate credit to the original author(s) and the source, provide a link to the Creative Commons licence, and indicate if changes were made. The images or other third party material in this article are included in the article’s Creative Commons licence, unless indicated otherwise in a credit line to the material. If material is not included in the article’s Creative Commons licence and your intended use is not permitted by statutory regulation or exceeds the permitted use, you will need to obtain permission directly from the copyright holder. To view a copy of this licence, visit http://creat iveco mmons .org/licen ses/by/4.0/. The Creative Commons Public Domain Dedication waiver (http://creat iveco mmons .org/publi cdoma in/ zero/1.0/) applies to the data made available in this article, unless otherwise stated in a credit line to the data.
Background
Improved technologies and decreasing sequencing costs enable in-depth analyses of chromatin and gene expression changes for genome-wide comparisons. These integrative multi-omics studies elucidate the
Open Access
*Correspondence: [email protected]; [email protected]; [email protected]
1 Developmental Therapeutics Branch and Laboratory of Molecular
Pharmacology, Center for Cancer Research, National Cancer Institute, NIH, 37 Convent Dr, Bethesda, MD 20892, USA
functionalities of coding and non-coding parts of the genome, their influence on development of complex disease such as cancers [1–4] and their translational implications [5–7].
Currently many studies focus on identifying protein– DNA interactions through sequencing (ChIP-seq) [8, 9]. By mapping protein-bound DNA, we can determine transcription factor binding sites or histone modification distributions across the genome. Other analyses focus on identifying open-chromatin and DNA-accessible regions [10–13], which are useful to classify enhancer regions, and transcription factor footprints [14–16]. Integrating these analyses with gene expression data such as RNA-seq [17–19], it is possible to gain better understanding of the architecture and regulation of the genome.
Recently, a new method has been introduced for genome-wide mapping of DNA double-strand breaks (END-seq) [20]. By enabling detection of DNA breaks that occur in a small fraction of a cell population, END-seq can be used to understand how breaks occur and are repaired.
To understand DNA replication patterns across the genome, next-generation sequencing methods are increasingly used. They are either based on sequencing newly synthesized and RNA-primed DNA, such as Oka-zaki fragment sequencing (OK-seq) [21] for the lagging strand or nascent-strand sequencing (NS-seq) for the leading strand [22]. These approaches are useful to pin-point where DNA replication is initiated in the genome. The order of genome replication can also be measured with replication-timing sequencing, which involves iden-tifying copy-number state differences between diploid G1-phase and replicating S-phase (or asynchronous— AS) cells [23–26].
Although sequencing methods are routinely used, data analyses need constant improvement to reduce the num-ber of steps prone to error. In many cases, results are dif-ficult to accurately reproduce because they are obtained with “in-house” scripts. One such example is the quan-tification of ChIP-seq/ATAC-seq peaks followed by normalization. Another example is generating sequenc-ing coverage tracks [27–29], which requires either more computation time for scaling and/or multiple steps to get accurate results. Additionally, many sequencing types do not have dedicated solutions for creating coverage tracks for accurate visualization. One example is OK-seq, where replication fork directionality (RFD) is used to identify replication origins in the genome. RFD is calculated from the ratio of reads aligning on the forward and reverse strand, which is usually accomplished by calculations involving multiple steps. Another example is splice-aware RNA-seq, for which the coverage tracks can be calcu-lated using multiple tools, but many of them disregard
exon–intron boundaries are disregarded, yielding inaccu-rate representations of splicing events.
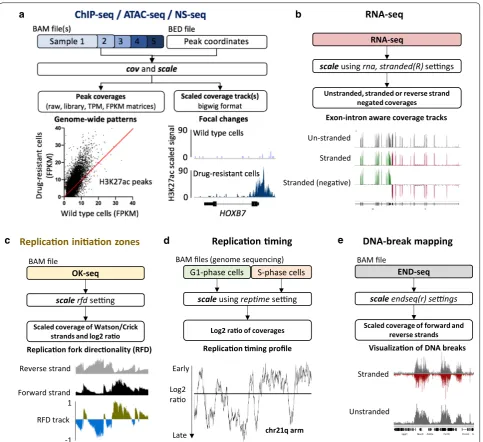
Here, we introduce BAMscale (summarized in Fig. 1 and Table 1), a new genomic software tool for generating normalized peak coverages and scaled sequencing cover-age tracks in bigWig format. BAMscale is a one-step tool that processes DNA sequencing datasets to create scaled and normalized quantifications and coverage tracks. As summarized in Table 1, BAMscale can process sequenc-ing data generated by diverse experimental approaches, including chromatin binding (ChIP-seq), chromatin accessibility (ATAC-seq), stranded and unstranded RNA-seq, DNA replication assays (OK-seq, NS-seq and replication timing) and DNA double-strand breaks sequencing (END-seq). We developed BAMscale in C-programming language using the samtools library [30] and libBigWig [27], achieving superior performance com-pared to existing tools. BAMscale can process 100 GB of aligned data (in BAM format) in under 20 min using a regular computer with 4 processing threads. To dem-onstrate the potential of BAMscale, we processed a wide set of sequencing datasets (Additional file 1: Table S1), benchmarking the performance with existing tools, paired with post-analyses. The tool, with installation and extensive usage examples, is available at https ://githu b.com/ncbi/BAMsc ale.
Results
Some of the most basic functions of BAMscale are the capability to quantify detected peaks and the ability to scale the sequencing coverage for visualization. BAM-Scale modules are available for processing data from BAM files generated by standard chromatin analyses such as ChIP-seq and ATAC-seq experiments and contains additional custom functions to process sequencing data from RNA-seq (rna, stranded or unstranded—Fig. 1b), OK-seq (rfd, Fig. 1c), replication timing analyses (rep-time, Fig. 1d) and DNA break mapping (endseq(r), Fig. 1e). These modules allow direct quantification of peaks from various experimental sources, which are often tested for colocalization in chromatin analyses, using a single, uniform tool.
Peak quantification and scaling coverage track from ATAC‑seq data
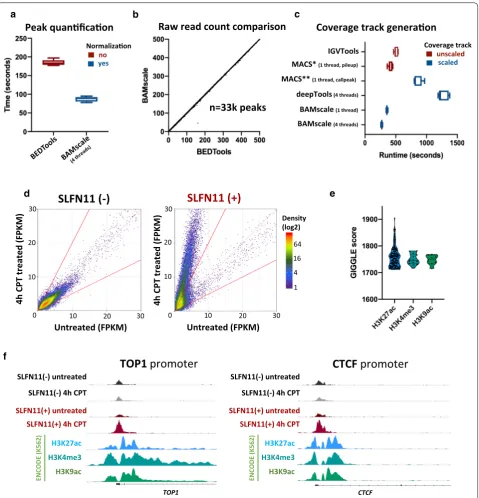
To test the capabilities of BAMScale, we first imple-mented it to compare chromatin accessibility from ATAC-seq data in SLFN11-proficient and deficient cells [31]. While the performance of BAMscale for peak quan-tification was comparable to the most commonly used
Minor reductions of execution time were observed using 8 threads (Additional file 2: Fig. S1A). Notably, BEDTools
only calculates raw read counts, whereas BAMscale per-forms normalization of raw read counts while outputting FPKM, TPM and library size normalized peak scores. This enables a direct comparison of peaks between sam-ples from cells with different genomic backgrounds undergoing diverse treatments. As shown in Fig. 2b and Additional file 2: Fig. S1B (each point represents
one peak), correlations of raw read counts from the two methods were above 0.99 (Fig. 2b and Additional file 2: Fig.S1B), resulting in high density of points on the diag-onal that give the appearance of a straight line. Out of the 32,819 quantified peaks, only a single ATAC-seq peak had low read counts from BAMscale and high read counts from BEDTools. That peak was covered predomi-nantly by reads where the read-pair mapped to a differ-ent chromosome (Additional file 2: Fig. S1C) that were
a b
d c
END-seq
scaleendseq(r) sengs
BAM file
Scaled coverage of forward and reverse strands
Stranded
Unstranded
Visualizaon of DNA breaks
DNA-break mapping
Log2 rao
G1-phase cells S-phase cells
Replicaon ming
scaleusing repme seng
BAM files (genome sequencing)
Log2 rao of coverages
Early
Late chr21q arm
Replicaon ming profile OK-seq
Replicaon iniaon zones
scalerfd seng
BAM file
Scaled coverage of Watson/Crick strands and log2 rao
Reverse strand
Forward strand 1
-1
Replicaon fork direconality (RFD)
Stranded (negave) Un-stranded
Stranded
RNA-seq
scaleusing rna, stranded(R) sengs
Unstranded, stranded or reverse strand negated coverages
Exon-intron aware coverage tracks
RNA-seq
e
RFD track
removed by default by BAMscale. The mean execution time to create sequencing coverage tracks with BAM-scale was 4.6-fold faster than deepTools bamCoverage and 1.8-fold faster than IGVtools (which does not scale for library size). We have also attempted to compare execu-tion times for this task with the MACS2 program, which is able to create bedgraph formatted coverage tracks that need to be converted to bigwig format (Table 1). The pileup function of MACS2 achieved similar run-times as
BAMscale, but did not scale the coverage, whereas the callpeak function scaled coverages with slower run-times (3.1 × slower) due to concomitant peak calling (Fig. 2c).
We next compared the effect of the topoisomerase I (TOP1) inhibitor camptothecin (CPT) on ATAC-seq pat-terns in human leukemia CCRF-CEM (SLFN11-positive) cells and their isogenic SFLN11-knockout [31]. After CPT treatment, chromatin accessibility remained unchanged in the SLFN11-KO cells, while accessibility of pre-exist-ing sites strongly increased in the SLFN11-positive cells (Fig. 2d). Using the GIGGLE tool [32] on the Cistrome
[33] website, we found that ATAC-seq peaks strongly overlapped with H3K27ac, H3K4me3 and H3K9ac sites, which are histone marks associated with active genes (Fig. 2e). Colocalization analysis of sites with > threefold increase during CPT treatment in SLFN11-positive cells showed ~ 20% increase in overlap with H3K4me3 and H3K9ac sites, identified using Coloweb [34] (Additional file 1: Table S2, Additional file 2: Fig. S2). DNA accessibil-ity sites were strongly enriched in gene promoter regions, such as in the TOP1 and CTCF gene promoters (Fig. 2f).
BAMscale is designed to quantify
ChIP-seq/ATAC-seq peaks from BAM and BED files, producing raw read counts, as well as TPM, FPKM and library size
normalized peak scores (Fig. 1a). By providing accurate peak quantification in parallel with generated scaled coverage tracks, BAMscale simplifies the comparison and visualization of genome-wide and local changes. To illustrate this point, we reanalyzed published histone ChIP-seq data from MV4-11 cell line and their isogenic counterpart (MV4-11R) resistant to PKC412, a multi-target protein kinase inhibitor [35]. Using the BAMscale
“cov” and “scale” functions, we accurately quantified peak strengths, and created scaled coverage tracks ready for visualization. In agreement with published results, we observed a global increase of H3K27ac, a decrease in H3K27me3 and a largely unchanged H3K4me3 signal in the drug-resistant cells (Fig. 1a, Additional file 2: Fig. S3A-C). Drug-resistant cells displayed elevated protein expression of HOXB7 [35], which has increased histone H3K27ac signal, a known marker for active genes.
RNA‑seq data coverage track generation
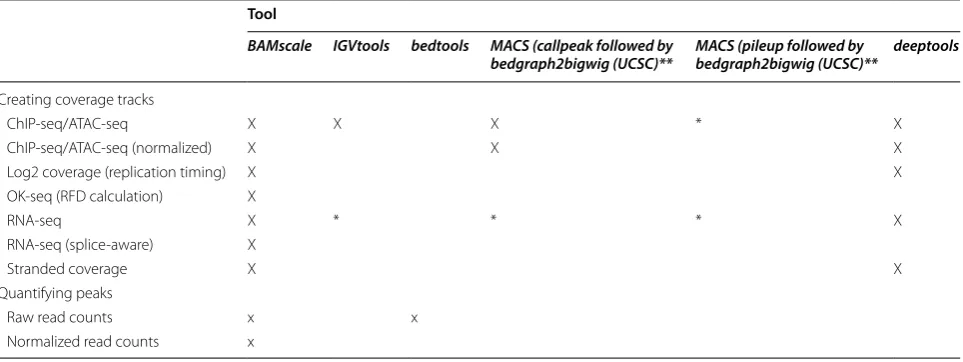
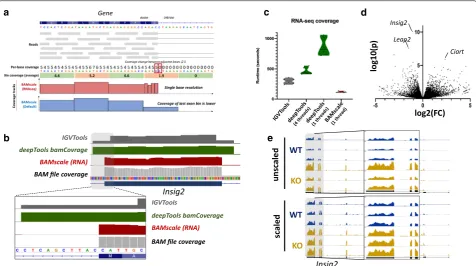
RNA-seq involves sequencing of mature RNA, where introns are spliced-out of the molecules. For this reason, genome alignment of RNA-seq is performed with splice-aware aligners such as STAR [36] or HISAT2 [37]. These tools are able to split sequencing reads between two (or more) exons with or without prior gene annotations. Currently most tools that generate coverage tracks (in bigWig or tdf format) are capable of identifying splicing events in the alignments, but their binning process cre-ates inaccurate representations. This causes strong cov-erage drops in bins that overlap exon–intron boundaries. For this reason, we implemented an RNA-seq-compati-ble function for BAMscale (Fig. 1b). Compared to the standard run, in RNA-seq mode BAMscale searches for Table 1 Capabilities of BAMScale and other publicly available tools
* Scaling factor cannot be specified
** BAM file has to be pre-filtered for alignment quality Tool
BAMscale IGVtools bedtools MACS (callpeak followed by
bedgraph2bigwig (UCSC)** MACS (pileup followed by bedgraph2bigwig (UCSC)** deeptools
Creating coverage tracks
ChIP‑seq/ATAC‑seq X X X * X
ChIP‑seq/ATAC‑seq (normalized) X X X
Log2 coverage (replication timing) X X
OK‑seq (RFD calculation) X
RNA‑seq X * * * X
RNA‑seq (splice‑aware) X
Stranded coverage X X
Quantifying peaks
Raw read counts x x
sudden changes in coverages between adjacent bases in a bin (usually >=5 reads), where resolution changes from bin to a single base pair (illustrated in Fig. 3a). A major advantage of this method is that no gene/tran-script annotation is needed for accurate representation
of recurrent splicing events. Output coverages can be set to be unstranded (“rna” operation) or stranded (opera-tion set to “stranded” or “stranded”), where two separate bigWig files are created for the two strands (Additional file 2: Fig. S4).
n=33k peaks
Raw read count comparison
d
f
e
TOP1
TOP1
promoter
CTCF
promoter
SLFN11 (-)
SLFN11 (+)
Untreated (FPKM)
4h CPT treated (FPKM)
Untreated (FPKM)
4h CPT treated (FPKM)
0 10 20 30
10 20 30
0 10 20 30
10 20 30
CTCF Density
(log2)
1 4 16 64
SLFN11(-) untreated SLFN11(-) 4h CPT
SLFN11(+) untreated SLFN11(+) 4h CPT
H3K4me3
H3K27ac
H3K9ac
ENCODE (K562)
SLFN11(-) untreated SLFN11(-) 4h CPT
SLFN11(+) untreated SLFN11(+) 4h CPT
H3K4me3
H3K27ac
H3K9ac
ENCODE (K562)
Peak quanficaon
no yes Normalizaon
Coverage track generaon
unscaled scaled Coverage track
a b c
IGVTools
deepTools (4 threads)
BAMscale (4 threads) BAMscale (1 thread) MACS* (1 thread, pileup) MACS** (1 thread, callpeak)
To test the potential of BAMscale RNA-seq mode, we reprocessed previously published RNA-seq data from
Top1mt wild type and knock-out mice [38]. BAMscale
is capable of producing more accurate, single-base res-olution tracks at exon–intron boundaries, compared to IGVTools or deepTools bamCoverage (Fig. 3b). Addi-tionally, the RNA-seq compatible BAMscale (using one processing thread) is 2.5-fold faster than IGVTools, 7.2-fold and 3.9-7.2-fold faster than deepTools bamCoverage
running on one or four threads, respectively (Fig. 3c). After differential expression analysis, we identified several genes that are upregulated in the KO samples (Additional file 1: Table S3), such as Insig2, which was the statistically most significantly, but with a mod-erate fold-change increase around 2x (Fig. 3d). This subtle change in expression is somewhat visible in the unscaled tracks, but the variation in the signal is very strong across replicates (Fig. 3e, upper tracks). This can be overcome by either extracting scaling factors for samples from the differential expression analysis pro-gram such as DESeq 2 (Fig. 3e, lower tracks), or by using the genome-size scaling, which scales to the number of sequenced bases. These methods ensure more compa-rable results for visualization by reducing the variations due to sequencing library size differences.
Alignment of DNA‑breakage sites and replication origins with replication timing domains
BAMScale expands the range of data type that can be quantitatively scaled and analyzed to include OK-seq, replication timing and splice-aware RNA-seq analyses in addition to ChIP-seq/ATAC-seq, which can be ana-lyzed by other tools as well (see Table 1 for a detailed comparison of data types and analysis tools). To test these capabilities, we processed replication timing, OK-seq and END-OK-seq data derived from activated mouse B cells [39], where the coverage tracks for the three data-sets were created with BAMscale.
Replication timing sequencing calculates the order of genome replication. This usually involves the com-parison of sequencing depths between G1-phase and S-phase cells. Replication timing log2 coverages of two BAM files can be calculated with BAMscale by setting the “reptime” flag as the operation. In this process,
BAMscale first calculates the bin-level coverage of the genome for both BAM files, followed by separate signal smoothening. By default, the bin size is set to 100 bp, while the smoothening is set to 500 bins. After smooth-ening the coverage of the two input files, the log2 cov-erage is calculated and exported to a bigWig file for visualization.
WT
KO
WT
KO
unscale
d
scaled
Insig2
a c
b e
Insig2
Leap2
Ciart
log2(FC)
log10(p)
IGVTools
deepTools bamCovrage
BAMscale (RNA) BAM file coverage
Insig2
IGVTools
deepTools bamCoverage
BAMscale (RNA) BAM file coverage
d
Gene
For OK-seq, the replication fork directionality (RFD) can be calculated with BAMscale, for which no other dedicated tools are currently available. When BAM-scale is set with the “rfd” operation, it calculates the bin-level coverage of the genome for reads aligning to the forward strand, and reverse strand separately, fol-lowed by RFD calculation of each bin [21]. In case of mapping of DNA breaks with END-seq, stranded bin-level coverages can be calculated by setting the opera-tion flag to “endseq” (both strands have positive values) or “endseqr” (negative strand coverage will be negative) which allows to overlay the two strand coverages in one figure.
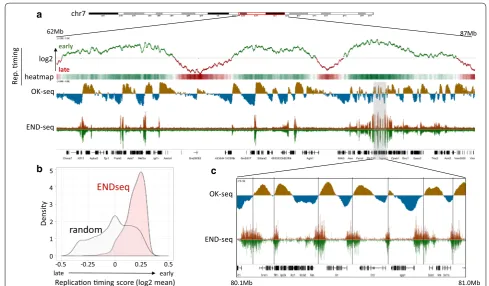
Visual comparison showed high similarly with the deposited tracks (Additional file 2: Fig. S5). As previ-ously reported, END-seq DNA-break signals were pre-dominantly observed in early replicating regions of the genome (Fig. 4a). Genome regions with stronger END-seq signal displayed a higher replication timing average calculated from the log2 tracks compared to randomly selected regions (Fig. 4b). Comparison of negative to pos-itive strand switching in the replication initiation zones identified by OK-seq showed strong overlaps among regions with increased END-seq signal (Fig. 4c).
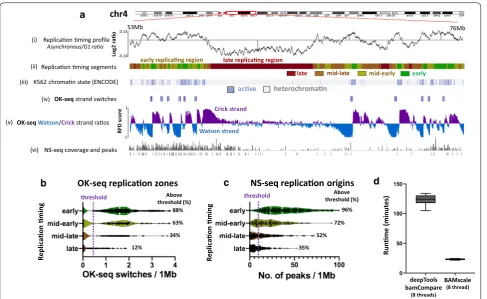
Finally, we compared replication timing data to OK-seq and NS-OK-seq (Nascent strand OK-sequencing) data from the human leukemia K562 cell line. Replication timing results (Fig. 5a(i)) and the generated segments (Fig. 5a(ii)) showed that early-replicating regions strongly corre-late with active chromatin regions (Fig. 5a(iii)) identi-fied with ChromHMM [40, 41]. Furthermore, BAMscale
also showed a strong overlap of OK-seq [42]. RFD strand switches (associated with synchronized replication initia-tion zones) with active euchromatin (Fig. 5a(iv, v)). Fewer than 0.5% of identified OK-seq strand switches were iden-tified in heterochromatin, where no overlap with active chromatin regions was found. Similarly, we observed higher NS-seq signal (and replication origin peaks) in euchromatin (Fig. 5a(vi). Early-replicating regions tend to be associated with more replication initiation sites, which gradually decrease in later phases of replication timing (Fig. 5b). These results correlate strongly with the NS-seq results showing that early replicating regions have higher peak densities compared to late-replicating regions [43] (Fig. 5b). We also tested BAMscale on 80 single-cell repli-cation timing sequencing (scRepli-seq) samples [44]. We were able to accurately reproduce the single-cell log2 rep-lication timing profiles from G1 phase and mid-S phase
Rep.
ming
OK-seq
END-seq
END-seq OK-seq
80.1Mb 81.0Mb
a
b c
random ENDseq
Replicaon ming score (log2 mean)
-0.5 -0.25 0 0.25 0.5
De
ns
ity
0 1 2 3 4 5
62Mb 87Mb
chr7
early
late
log2
heatmap
late early
cells (Additional file 2: Fig. S6), requiring on average 11 s of processing time for each sample pair using 4 process-ing threads. Furthermore, we compared the performance of BAMscale and deepTools bamCompare on the replica-tion timing data derived from the human leukemia K562 cell line using eight processing threads. The sequencing data consists of > 103 Gb of sequencing data in BAM for-mat, which we re-analyzed six times. The mean run time of BAMscale was 23.2 min, which is a 5.3-fold decrease in analysis time, compared to 123.1 min required for
deepTools.
Discussion
Widespread usage of DNA and RNA capture-based methods helps us understand and categorize changes in chromatin state and their regulatory effects on DNA rep-lication and gene expression. Visualization of genome-wide data is a crucial step to identify complex genomic patterns and relationships. Because of the increased usage of next-generation sequencing both in basic research and clinical settings, it is important to analyze data reproducibly by removing as many analysis steps as
possible, as they may be prone to error and be limiting for experimentalists.
BAMscale addresses two critical prevalent issues that are often encountered in sequencing-based chroma-tin analyses. First, since the scope of next-generation sequencing is usually genome-wide, the signal distribu-tion of these techniques is generally visualized with dif-ferent genomic viewers [29, 45]. However, available tools for sequencing track generation either require multiple steps or need long computation time to produce results ready for visualization [27–29]. Additionally, quantifica-tion and normalizaquantifica-tion of ChIP-seq and ATAC-seq peak strengths require multiple analysis steps using time-con-suming, case-by-case programming of “in-house” scripts, i.e., time-consuming case-by-case programming. Second, although there are multiple tools to analyze genome-level coverage of sequencing data (e.g., IGVTools [29], deep-Tools [27], and MACS2 [46] coverage mode coverage mode and align2rawsignal [https ://code.googl e.com/p/ align 2raws ignal /]; Table 1), many sequencing approaches require specific analysis methods for accurate representa-tions. A simple example is RNA-seq, where the binning Replicaon ming profile
NS-seqcoverage and peaks chr4
76Mb
late
Watson strand
Crick strand
Replicaon ming segments
OK-seq Watson/Crickstrand raos
mid-late mid-early early
Asynchronous/G1 rao a
c b
(i)
(ii)
(v)
(vi)
K562 chroman state (ENCODE) (iii)
53Mb
acve heterochroman
late replicang region early replicang region
OK-seq replicaon zones NS-seq replicaon origins
Replicaon
min
g threshold
88% 63% 34% 12%
Above threshold (%)
Replicaon
min
g threshold
Above threshold (%)
96% 72% 52% 35%
RFD
sc
or
e 1
-1
Lo
g2
ra
o
OK-seqstrand switches (iv)
d
Ru
n
me
(minut
es
)
-0.24 0.14
deepTools bamCompare
(8 threads)
BAMscale (8 thread)
process has to be splice-aware for accurate representa-tion of exon–intron boundaries. These are currently not supported by the above-mentioned tools. Another example is OK-seq, which can be used to identify replica-tion origins based on the calculareplica-tion of replicareplica-tion fork directionality (RFD), for which no dedicated software is available. BAMscale provides a uniform, single-step scal-ing function for these diverse data types, includscal-ing easy-to-use custom scripts that facilitate quantification and analyses. The additional post-analysis and visualization scripts of BAMscale allow experimentalists to compare, quantify and analyze data from a variety of experimen-tal approaches, aiding in the integration of epigenetic studies.
We developed BAMscale to analyze data in a quick, simple and reproducible manner. It is developed in basic C-programming, resulting in very fast execution times compared to previous methods. To facilitate data analy-sis, we implemented multiple pre-defined settings for a wide set of sequencing types accompanied with extensive tutorials (https ://githu b.com/ncbi/BAMsc ale wiki page).
Using BAMscale as a peak quantification method and a scaled coverage-track generation tool, users can iden-tify single focal changes in the genome as well as under-stand how certain conditions alter global chromatin. We have also implemented an RNA-seq-compatible version enabling accurate visualization of exon–intron bounda-ries from both stranded and un-stranded data. Notably,
BAMscale eliminates the need to perform and convert outputs from multiple analyses tools to quantify and visu-alize data measuring chromatin modifications (ChIP-seq/ ATAC-seq), transcription (splice-aware RNA-seq), DNA breakage (END-Seq) and replication (OK-seq, replication timing, NS-Seq). This capability facilitates the analyses of the effects of perturbation on those concomitant chro-matin transactions and provides a methodological basis to address important issues such as the coordination of DNA replication and transcription or the orchestration of DNA damage repair with histone modifications. Inte-gration of these multiple analyses would also enable the stratification and identification of genomic regions of interest displaying alterations in one or multiple epige-netic properties.
Conclusions
BAMscale is a tool that can be used to accurately quan-tify and normalize identified peaks directly from BAM files, as well as create coverage tracks for visualiza-tion in genome browsers. The uniform scaling func-tion and the peak-size comparison visualizafunc-tion tool allow easy interpretation of data from various sequenc-ing approaches by experimentalists, and the availabil-ity of custom scripts facilitate the integration of distinct
chromatin interactions interrogated with diverse meth-odologies. Due to the multithreaded implementation, our tool outperforms currently used methods. We imple-mented sequencing-specific coverage track calculation modes including: (1) replication timing, (2) replication fork directionality analysis from OK-seq data, (3) strand-specific coverage of DNA breaks from END-seq and (4) splice-aware RNA-seq coverage modes, many of which lack any dedicated software. BAMscale is freely available on github (https ://githu b.com/ncbi/BAMsc ale).
Methods
BAMscale algorithm Peak quantification
Peaks can be quantified with BAMscale’s cov function, which takes as input a BED file with peak coordinates, and one or multiple BAM files, outputting raw read counts, FPKM, TPM and library size normalized peak scores. Paired-end reads can be quantified in two main ways: (1) using each read as a single entity, or (2) count-ing read pairs as one fragment. Additionally, it is possible to count reads that follow either the strand direction of each peak in the BED file, or simply calculate forward or reverse reads only.
During peak quantification, BAMscale by default first reads the entire BAM file(s) to count the number of aligned reads using the selected alignment filters to get the effective library size. This approach gives more accurate alignment statistics than using the BAM index file, which has information on number of aligned reads only, containing duplicate reads and low-quality reads as well. After calculating the effective library size, BAM-scale counts the number of overlapping reads with each coordinate in the BAM file, followed by FPKM [47], TPM [48] and library size (scaled to the smallest library) normalization.
To facilitate pairwise comparisons (as seen in Fig. 2d), we prepared an interactive R script (available at https :// githu b.com/ncbi/BAMsc ale) using the shiny, ggplot2, tidyr, ggrepel and gridExtra libraries to plot density dot-plots of the quantified (TPM, FPKM and library size nor-malized) peaks outputted from BAMscale.
Creating coverage tracks from sequencing data
To generate normalized coverage tracks, the BAMscale
the per-bin coverage, while increasing the coverage when the sequenced bases are less than the genome size. The advantage of this approach is that each sample can be scaled separately. Alternatively, it is possible to scale mul-tiple samples based on the library size. In these cases, the number of aligned reads is calculated for each sample, and scaling is done by scaling each sample to the smallest in the set. A drawback of this approach is that all samples have to be processed in parallel, which increases memory requirements (~ 500 Mb for each sample when the bin size is set to 5 bp). Additionally, it is possible to supply a scaling factor for each sample that will be used to adjust the coverages.
We implemented an RNA-seq-compatible option for creating coverage tracks with a difference in binning strategy. In RNA-seq mode, at cases where two adjacent bases in one bin have a coverage difference above 4 reads, the resolution is automatically changed to single base resolution. This enables the accurate representation of exon–intron boundaries.
Additionally, we implemented a signal smoothing option for coverage tracks. When smoothening a signal, the number of adjacent bins can be specified, which will be used to calculate the final signal of each bin.
In cases where two files are specified, different opera-tions can be performed, such as calculating the log2 ratio of bins, or subtracting the values of bins.
For ease of use, we implemented predetermined set-tings to analyze replication timing data and END-seq data. In case of the “reptime” operation, the log2 cover-age of two bam files are calculated for 100 bp bin sizes, with signal smoothening set to 500 bins. In case of END-seq, we can set the operation to “endseq”, which creates stranded coverage tracks, or “endseqr”, which negates the coverage track of the negative strand for ease of visualization.
OK‑seq data and replication fork directionality
In case of OK-seq data first the Watson (forward) and Crick (reverse) strand coverages are calculated consecu-tively. After importing the strand-specific coverages, the replication fork directionality (RFD) is calculated as:
where XCrick,i denotes the Crick read counts, XWatson,i denotes the Watson read counts for the i-th bin (based on [21]).
Sequenced data
NS‑seq and replication timing sequencing of K562 cell lines To produce high coverage sequencing of replication ori-gins for the K562 human bone marrow derived cell line,
RFDi=
XCrick,i−XWatson,i
XCrick,i+XWatson,i
,
we performed nascent-strand sequencing and replication timing sequencing available at GEO (GSE131417).
K562 NS‑seq sample preparation
Replication origins were mapped using the nascent-strand sequencing and abundance assay [22]. Briefly, DNA fractionation was performed using a 5-30% sucrose gradient to collect DNA fractions ranging from 0.5 to 2 kb. Five prime single-strand DNA ends were phos-phorylated by T4 polynucleotide kinase (T4PK) (NEB, M0201S). After phenol/chloroform treatment to remove T4 PK, DNA was precipitated, resuspended and then treated with lambda-exonuclease (NEB, M0262S) to remove genomic DNA fragments that lacked the phos-phorylated RNA primer. After RNase treatment and DNA purification (Qiagen PCR purification kit, 28004), single-stranded nascent strands were random-primed using the Klenow and DNA Prime Labeling System (Inv-itrogen, 18187013). Double-stranded nascent DNA (1 μg) was sequenced using the Genome Analyzer II (Illumina).
K562 replication timing sample preparation
To get the pure G1 phase cells, 1 × 10⁸ K562 cells were washed twice with cold PBS and fractionated by elutria-tion at each of the following flow speeds: 15 × 2, 16 × 2, 17 × 2, 18 × 2 19 × 2, 20 × 2 ml/min. Each fraction was stained by DAPI in PBS and confirmed by FACS. Genomic DNA from G1 phase and asynchronized K562 cells was extracted simultaneously according to manufac-turer’s instructions (Qiagen, 69506).
Data analysis
We demonstrate the capabilities of BAMscale on a wide set of sequencing datasets, such as ATAC-seq [31], ChIP-seq [35], replication timing data and END-ChIP-seq [39], OK-seq [39, 42], single-cell Repli-OK-seq and BrdU-IP [44] and stranded RNA-seq [38]. The complete list of analyzed samples, genome version and tissues of origins used in this study are shown in Additional file 1: Table S1.
Alignment of sequencing data
The next-generation sequencing data GEO/ENA and SRA ids, along with sample type, aligner (and version) and genome build summarizing 27 processed sequencing experiments can be found in Additional file 1: Table S1. ATAC-seq, ChIP-seq, OK-seq, END-seq and NS-seq were aligned with the bwa mem aligner [49] (version 0.7.17) or dragen pipeline [50] in case of the K562 replica-tion timing. RNA-seq data were aligned using the STAR
samtools [30] (version 1.8), followed by duplicate mark-ing usmark-ing picard-tools (version 2.9.2).
Peak calling and coverage track generation for ATAC‑seq, ChIP‑seq and NS‑seq
Peaks were identified using MACS [46] peak caller (ver-sion 2.1.1.20160309), using the nomodel setting for ATAC-seq and NS-seq, and FDR set to 0.01 to filter low-quality peaks. ATAC-seq peaks were called using the narrow setting, while histone peaks were called using the broad peak setting of MACS. In case of NS-seq data, both broad and narrow peaks were called, the top 10% of narrow peaks were intersected with the broad peaks to retrieve the highest scoring regions. Called peaks for each cell line and condition were sorted and merged using BEDTools [28] (version 2.27.1). Peak quantification was performed with the “cov” function of BAMscale sep-arately for each sequencing type.
Gene expression quantification and differential expression analysis from RNA‑seq data
Raw read counts for each gene were calculated using the
TPMcalculator program [52]. Differential expression
analysis between wild-type and KO samples were cal-culated using DESeq 2 [53], where, as suggested in the manual, genes with less than ten reads on average were removed from the analysis. Scaling factors for each sam-ple were obtained using DESeq 2 sizeFactors() function. Scaled coverages were created with BAMscale “scale” function with operation set to “strandrnaR” and bin size set to 15 bases, scaling set to “-k custom” and scaling fac-tor set to the reciprocal estimated facfac-tors from DESeq 2 for each sample.
OK‑seq data
BigWig signal of aligned OK-seq reads were created with the BAMscale “scale” function, with the operation set to “rfd” (replication fork directionality), all other parameters were set to default.
END‑seq data
The strand-specific coverage tracks for END-seq data were created the BAMscale “scale” function, with the operation set to “endseqr”. Two coverage tracks are cre-ated, one with the forward strand, and a separate track for negative strand reads, where the score is negated.
Replication timing data
Replication timing log2 ratio coverage tracks were cre-ated with the BAMscale “scale” function, with the operation set to “reptime”. The first specified BAM file is the G1-phase-specific sequencing data, the second BAM file was the asynchronous cell-cycle BAM file.
Replication-timing segments were identified the “Repli-cation_timing_segmenter.R” script developed in R, and deposited on github along the BAMscale code.
Single‑cell (sc) Repli‑seq
Replication timing log2 ratio coverage tracks for single-cell replication timing data [44] were created with the
BAMscale “scale” function. The operation parameter was set to log2, and to reproduce the original analysis results, we set the bin size was set to 50 kb, and signal smoothen-ing to 4 (resultsmoothen-ing in 400 kb smoothensmoothen-ing). In case of the standard CBA/MsM samples the “CBMS1_ESC_single_ G1_01” (GSM2904978) sample was used as the G1 phase reference, and sample “CBMS1_Day7Diff_ESC_single_ G1_01” (GSM2905031) was used as the G1 phase refer-ence for the 7-day differentiated CBA/MsM samples.
BrdU‑IP replication timing data
The log2 coverage of early and late S-phase BrdU-IP sequencing was calculated using the BAMscale “scale” function. Similarly to the scRepli-seq data, the operation parameter was set to log2, and to reproduce the original analysis results, we set the bin size to 50 kb, and signal smoothening to 4 (resulting in 400 kb smoothening).
Supplementary information
Supplementary information accompanies this paper at https ://doi. org/10.1186/s1307 2‑020‑00343 ‑x.
Additional file 1: Table S1. Detailed list of processed samples. Table S2. Colocalization statistics of ATAC‑seq peaks with > 3x opening and < 3x opening induced by camptothecin (CPT) treatment in human leukemia CCRF‑CEM SLFN11 wild type and KO. Table S3. Differential expression analysis results between Top1mt wild type and knockout murine liver tumor samples.
Additional file 2. Fig.S1. Benchmarking and comparison of different tools using ATAC‑seq data. A) Peak quantification performance using bedtools and BAMscale (1, 4 and 8 execution threads). B) Comparison of raw read counts between bedtools and BAMscale in six ATAC‑seq samples. C) IGV screenshot of a peak overestimated by bedtools in all samples, where read pairs align to different chromosomes. Fig. S2. Colocaliza‑ tion of ATAC‑seq peaks. Peaks with > threefold opening had increased colocalization with H3K4me3 and H3K9ac compared to peaks with weaker or no increase. Fig. S3. Changes in histone ChIP‑seq signal between MV4‑ 11 and MV4‑11R cells. A) H3K27me3 signal decreased, B) H3K27ac signal increased, and C) H3K4me3 signal did not change in the MV4‑11R cells compared to the MV4‑11 cells. Fig.S4. Stranded and unstranded RNA‑seq coverage tracks created with BAMscale. Fig. S5. Comparison of deposited END‑seq and OK‑seq data reprocessed with BAMscale.
Abbreviations
Acknowledgements
We thank the NCI Sequencing Facility headed by Bao Tran and Jyotti Shetty for expert technical assistance. The study utilized the high‑performance com‑ puter capabilities of the Biowulf HPC cluster at the NIH. Our work is supported by the Center for Cancer Research, the intramural program of the National Cancer Institute (Z01‑BC‑006150, ZIA‑BC‑010411).
Authors’ contributions
LSP, JMG, RVA, DL, MIA and YP conceptualized the program. LSP, JMG, RVA developed the core program. JM, SJ, HZ and SYH contributed with the ATAC‑ seq and ChIP‑seq data processing method development. CR, HF, BT and AB contributed to the development of NS‑seq, replication timing and OK‑seq data analysis methods. CR, HF, SY performed the K562 NS‑seq and replication timing sample preparation. LSP, JMG, RVA, LM, DL, MIA and YP contributed to writing and editing of the manuscript. All authors contributed to the data interpretation. All authors read and approved the final manuscript.
Funding
This research was supported by the Intramural Research Programs at the National Cancer Institute [Z01‑BC‑006150 to YP and ZIA‑BC‑010411 to MIA] and the National Library of Medicine at the NIH.
Availability of data and materials
BAMscale is freely available on github (https ://githu b.com/ncbi/BAMsc ale). All re‑analyzed samples (including the GEO and SRA identifiers) are summarized in Additional file 1: Table S1. The K562 cell line NS‑seq and replication timing data are available at GEO (GSE131417).
Ethics approval and consent to participate Not applicable.
Consent for publication Not applicable.
Conflict of interests
The authors declare that they have no competing interests.
Author details
1 Developmental Therapeutics Branch and Laboratory of Molecular Pharma‑
cology, Center for Cancer Research, National Cancer Institute, NIH, 37 Convent Dr, Bethesda, MD 20892, USA. 2 Computational Biology Branch, National
Center for Biotechnology Information, National Library of Medicine, NIH, 8600 Rockville Pike, Bethesda, MD 20892, USA.
Received: 10 January 2020 Accepted: 11 April 2020
References
1. Huang YH, et al. POU2F3 is a master regulator of a tuft cell‑like variant of small cell lung cancer. Genes Dev. 2018;32(13–14):915–28.
2. Borromeo MD, et al. ASCL1 and NEUROD1 reveal heterogeneity in pul‑ monary neuroendocrine tumors and regulate distinct genetic programs. Cell Rep. 2016;16(5):1259–72.
3. Bernt KM, et al. MLL‑rearranged leukemia is dependent on aberrant H3K79 methylation by DOT1L. Cancer Cell. 2011;20(1):66–78. 4. Jang SM, et al. The replication initiation determinant protein (RepID)
modulates replication by recruiting CUL4 to chromatin. Nat Commun. 2018;9(1):2782.
5. Patten DK, et al. Enhancer mapping uncovers phenotypic heteroge‑ neity and evolution in patients with luminal breast cancer. Nat Med. 2018;24(9):1469–80.
6. Raisner R, et al. Enhancer activity requires CBP/P300 bromodomain‑ dependent histone H3K27 acetylation. Cell Rep. 2018;24(7):1722–9. 7. Ross‑Innes CS, et al. Differential oestrogen receptor binding is associated
with clinical outcome in breast cancer. Nature. 2012;481(7381):389–93. 8. Johnson DS, et al. Genome‑wide mapping of in vivo protein‑DNA interac‑
tions. Science. 2007;316(5830):1497–502.
9. Barski A, et al. High‑resolution profiling of histone methylations in the human genome. Cell. 2007;129(4):823–37.
10. Buenrostro JD, et al. ATAC‑seq: a method for assaying chromatin acces‑ sibility genome‑wide. Curr Protoc Mol Biol. 2015;109:21–9.
11. Song L, Crawford GE. DNase‑seq: a high‑resolution technique for map‑ ping active gene regulatory elements across the genome from mam‑ malian cells. Cold Spring Harb Protoc. 2010;2010(2):pdb prot5384. 12. Giresi PG, et al. FAIRE (Formaldehyde‑Assisted Isolation of Regulatory
Elements) isolates active regulatory elements from human chromatin. Genome Res. 2007;17(6):877–85.
13. Boyle AP, et al. High‑resolution mapping and characterization of open chromatin across the genome. Cell. 2008;132(2):311–22.
14. Davie K, et al. Discovery of transcription factors and regulatory regions driving in vivo tumor development by ATAC‑seq and FAIRE‑seq open chromatin profiling. PLoS Genet. 2015;11(2):e1004994.
15. Lu Z, et al. Combining ATAC‑seq with nuclei sorting for discovery of cis‑ regulatory regions in plant genomes. Nucleic Acids Res. 2017;45(6):e41. 16. Baek S, Goldstein I, Hager GL. Bivariate genomic footprinting detects
changes in transcription factor activity. Cell Rep. 2017;19(8):1710–22. 17. Lister R, et al. Highly integrated single‑base resolution maps of the epig‑
enome in Arabidopsis. Cell. 2008;133(3):523–36.
18. Mortazavi A, et al. Mapping and quantifying mammalian transcriptomes by RNA‑Seq. Nat Methods. 2008;5(7):621–8.
19. Nagalakshmi U, et al. The transcriptional landscape of the yeast genome defined by RNA sequencing. Science. 2008;320(5881):1344–9. 20. Canela A, et al. DNA breaks and end resection measured genome‑wide
by end sequencing. Mol Cell. 2016;63(5):898–911.
21. Petryk N, et al. Replication landscape of the human genome. Nat Com‑ mun. 2016;7:10208.
22. Martin MM, et al. Genome‑wide depletion of replication initiation events in highly transcribed regions. Genome Res. 2011;21(11):1822–32. 23. Marchal C, et al. Genome‑wide analysis of replication timing by next‑
generation sequencing with E/L Repli‑seq. Nat Protoc. 2018;13(5):819–39. 24. Mukhopadhyay R, et al. Allele‑specific genome‑wide profiling in human
primary erythroblasts reveal replication program organization. PLoS Genet. 2014;10(5):e1004319.
25. Hansen RS, et al. Sequencing newly replicated DNA reveals wide‑ spread plasticity in human replication timing. Proc Natl Acad Sci USA. 2010;107(1):139–44.
26. Koren A, et al. Genetic variation in human DNA replication timing. Cell. 2014;159(5):1015–26.
27. Ramirez F, et al. deepTools: a flexible platform for exploring deep‑ sequencing data. Nucleic Acids Res. 2014;42:W187–91.
28. Quinlan AR, Hall IM. BEDTools: a flexible suite of utilities for comparing genomic features. Bioinformatics. 2010;26(6):841–2.
29. Robinson JT, et al. Integrative genomics viewer. Nat Biotechnol. 2011;29(1):24–6.
30. Li H, et al. The sequence alignment/map format and SAMtools. Bioinfor‑ matics. 2009;25(16):2078–9.
31. Murai J, et al. SLFN11 blocks stressed replication forks independently of ATR. Mol Cell. 2018;69(3):371–84.
32. Layer RM, et al. GIGGLE: a search engine for large‑scale integrated genome analysis. Nat Methods. 2018;15(2):123–6.
33. Liu T, et al. Cistrome: an integrative platform for transcriptional regulation studies. Genome Biol. 2011;12(8):R83.
34. Kim R, et al. ColoWeb: a resource for analysis of colocalization of genomic features. BMC Genomics. 2015;16:142.
35. Gollner S, et al. Loss of the histone methyltransferase EZH2 induces resistance to multiple drugs in acute myeloid leukemia. Nat Med. 2017;23(1):69–78.
36. Dobin A, et al. STAR: ultrafast universal RNA‑seq aligner. Bioinformatics. 2013;29(1):15–21.
37. Kim D, Langmead B, Salzberg SL. HISAT: a fast spliced aligner with low memory requirements. Nat Methods. 2015;12(4):357–60.
38. Baechler SA, et al. The mitochondrial type IB topoisomerase drives mito‑ chondrial translation and carcinogenesis. Nat Commun. 2019;10(1):83. 39. Tubbs A, et al. Dual roles of poly(dA:dT) tracts in replication initiation and
fork collapse. Cell. 2018;174(5):1127–42.
40. Ernst J, Kellis M. ChromHMM: automating chromatin‑state discovery and characterization. Nat Methods. 2012;9(3):215–6.
•fast, convenient online submission •
thorough peer review by experienced researchers in your field • rapid publication on acceptance
• support for research data, including large and complex data types •
gold Open Access which fosters wider collaboration and increased citations maximum visibility for your research: over 100M website views per year •
At BMC, research is always in progress.
Learn more biomedcentral.com/submissions
Ready to submit your research? Choose BMC and benefit from: 42. Wu X, et al. Developmental and cancer‑associated plasticity of DNA repli‑
cation preferentially targets GC‑poor, lowly expressed and late‑replicating regions. Nucleic Acids Res. 2018;46(19):10532.
43. Smith OK, et al. Distinct epigenetic features of differentiation‑regulated replication origins. Epigenet Chromatin. 2016;9:18.
44. Takahashi S, et al. Genome‑wide stability of the DNA replication program in single mammalian cells. Nat Genet. 2019;51(3):529–40.
45. Haeussler M, et al. The UCSC genome browser database: 2019 update. Nucleic Acids Res. 2019;47(D1):D853–8.
46. Zhang Y, et al. Model‑based analysis of ChIP‑Seq (MACS). Genome Biol. 2008;9(9):R137.
47. Trapnell C, et al. Transcript assembly and quantification by RNA‑Seq reveals unannotated transcripts and isoform switching during cell dif‑ ferentiation. Nat Biotechnol. 2010;28(5):511–5.
48. Wagner GP, Kin K, Lynch VJ. Measurement of mRNA abundance using RNA‑seq data: RPKM measure is inconsistent among samples. Theory Biosci. 2012;131(4):281–5.
49. Li H, Durbin R. Fast and accurate short read alignment with Burrows‑ Wheeler transform. Bioinformatics. 2009;25(14):1754–60.
50. Miller NA, et al. A 26‑hour system of highly sensitive whole genome sequencing for emergency management of genetic diseases. Genome Med. 2015;7:100.
51. Baruzzo G, et al. Simulation‑based comprehensive benchmarking of RNA‑ seq aligners. Nat Methods. 2017;14(2):135–9.
52. Vera Alvarez R, et al. TPMCalculator: one‑step software to quantify mRNA abundance of genomic features. Bioinformatics. 2019;35(11):1960–2. 53. Love MI, Huber W, Anders S. Moderated estimation of fold change and
dispersion for RNA‑seq data with DESeq2. Genome Biol. 2014;15(12):550.
Publisher’s Note