R E S E A R C H
Open Access
Functional proteomics can define prognosis and
predict pathologic complete response in patients
with breast cancer
Ana M Gonzalez-Angulo
1*, Bryan T Hennessy
2, Funda Meric-Bernstam
3, Aysegul Sahin
4, Wenbin Liu
5, Zhenlin Ju
6,
Mark S Carey
7, Simen Myhre
8, Corey Speers
9, Lei Deng
10, Russell Broaddus
11, Ana Lluch
12, Sam Aparicio
13,
Powel Brown
14, Lajos Pusztai
15, W Fraser Symmans
16, Jan Alsner
17, Jens Overgaard
18, Anne-Lise Borresen-Dale
19,
Gabriel N Hortobagyi
20, Kevin R Coombes
21and Gordon B Mills
22* Correspondence: [email protected] 1Departments of Breast Medical Oncology and Systems Biology, The University of Texas MD Anderson Cancer Center, 1515 Holcombe Blvd, Houston, TX 77030, USA
Full list of author information is available at the end of the article
Abstract
Purpose:To determine whether functional proteomics improves breast cancer classification and prognostication and can predict pathological complete response (pCR) in patients receiving neoadjuvant taxane and anthracycline-taxane-based systemic therapy (NST).
Methods:Reverse phase protein array (RPPA) using 146 antibodies to proteins relevant to breast cancer was applied to three independent tumor sets. Supervised clustering to identify subgroups and prognosis in surgical excision specimens from a training set (n = 712) was validated on a test set (n = 168) in two cohorts of patients with primary breast cancer. A score was constructed using ordinal logistic regression to quantify the probability of recurrence in the training set and tested in the test set. The score was then evaluated on 132 FNA biopsies of patients treated with NST to determine ability to predict pCR.
Results:Six breast cancer subgroups were identified by a 10-protein biomarker panel in the 712 tumor training set. They were associated with different recurrence-free survival (RFS) (log-rank p = 8.8 E-10). The structure and ability of the six subgroups to predict RFS was confirmed in the test set (log-rank p = 0.0013). A prognosis score constructed using the 10 proteins in the training set was associated with RFS in both training and test sets (p = 3.2E-13, for test set). There was a significant association between the prognostic score and likelihood of pCR to NST in the FNA set (p = 0.0021).
Conclusion:We developed a 10-protein biomarker panel that classifies breast cancer into prognostic groups that may have potential utility in the management of patients who receive anthracycline-taxane-based NST.
Keywords:Breast Cancer, Functional Proteomics, Prognosis, Prediction
Introduction
To inform decisions about therapy, it is necessary to have a better understanding of the molecular mechanisms underlying the heterogeneity of breast cancer. Transcrip-tional profiling revealed that breast cancer represents at least six molecular subtypes associated with different clinical features [1-3]. However, comprehensive analysis of breast cancer transcriptomes does not capture all levels of biological complexity; important additional information may reside in the proteome [4-7].
Proteins are the direct effectors of cellular function. Protein levels and function depend on translation as well as on post-translational modifications [6], which influ-ence protein stability and activity [7]. Although many proteins have been studied as prognostic and predictive factors in breast cancer, only three alter current practice: estrogen receptor (ER), progesterone receptor (PR) and HER2. Thus, a systematic study of expression and activation of multiple proteins and signaling pathways may facilitate more accurate classification and prediction in breast cancer.
Neoadjuvant systemic therapy (NST) allows for in vivo assessment of chemosensitiv-ity. Attaining a pathologic complete response (pCR) following NST provides a surro-gate marker for improved long-term outcome. Conversely, patients with residual breast cancer after NST are at increased risk for recurrence and may have therapy-resistant disease [8-12].
The objective of this study was to apply functional proteomics to breast cancer clas-sification and prognosis, and to develop a predictor of pCR in a group of primary tumor samples obtained by fine needle aspirations (FNA) from patients who subse-quently received NST.
Material and Methods
Tumor tissues
Three sets of frozen breast cancer tissues were used: Training set (n = 712) was col-lected at M. D. Anderson Cancer Center (MDACC), Hospital Clinico Universitario de Valencia, Spain, University of British Columbia, Vancouver, BC, and Baylor College of Medicine, Houston, TX. Complete clinical information was available for 541 patients. Test set (n = 168) was obtained from an independent group of patients enrolled in the Danish DBCG 82 b and c breast cancer studies [13,14]. All tumors in the training and test sets were collected by excision during their primary surgery. Tumor content was verified by histopathology. The third set consisted of 256 FNAs obtained from primary breast cancers prior to NST of which 132 belonged to patients who subsequently received uniform taxane and anthracycline-based NST at MDACC (12 cycles of weekly paclitaxel or 4 cycles of every 3-week docetaxel, followed by 4 cycles of FAC or FEC100). All tissues were collected under Institutional Review Board-approved labora-tory protocols.
membranous staining occurred in≥10% of tumor cells, with a HER2/CEP17 ratio of > 2.0 or with a log2 mean centered cutoff of +0.82 by RPPA [15].
Reverse phase protein lysate microarray (RPPA)
RPPA was completed independently and at different time points for training and tests sets using individual arrays. Protein was extracted from human tumors and RPPA was performed as described previously [16-19]. Lysis buffer was used to lyse frozen tumors by homogenization (excised tumors) or sonication (FNAs). Tumor lysates were nor-malized to 1 μg/μL concentration as assessed by bicinchoninic acid assay (BCA) and boiled with 1% SDS. Supernatants were manually diluted in five-fold serial dilutions with lysis buffer. An Aushon Biosystems 2470 arrayer (Burlington, MA) created 1,056 sample arrays on nitrocellulose-coated FAST slides (Schleicher & Schuell BioScience, Inc.). Slides were probed with 146 validated primary antibodies (Additional File 1, Table S1) and signal amplified using a DakoCytomation-catalyzed system. Secondary antibodies were used as a starting point for amplification. Slides were scanned, ana-lyzed, and quantified using Microvigene software (VigeneTech Inc., Carlisle, MA) to generate spot signal intensities, which were processed by the R package SuperCurve (version 1.01) [18], available at “http://bioinformatics.mdanderson.org/OOMPA“. A fitted curve ("supercurve”) was plotted with the signal intensities on the Y-axis and the relative log2 concentration of each protein on the X-axis using the non-parametric, monotone increasing B-spline model [18]. Protein concentrations were derived from the supercurve for each lysate by curve-fitting and normalized by median polish. Pro-tein measurements were corrected for loading as described [15-17,19]. For the selec-tion of the 146 antibody set, we focused on markers currently used for breast cancer classification due to their value in treatment decisions (ER, PR, HER2). We then added additional antibodies to targets implicated in breast cancer pathophysiology, followed by antibodies to targets implicated in the pathophysiology of other cancer lineages. Final selection of antibodies was also driven by the availability of their high quality that could pass a strict validation process as previously described [20].
Statistical Methods
Detailed statistical methods are described in Additional File 2.
Identification of Prognostic Groups
curves to select the marker set that was associated with the clearest differences in RFS between the groups identified in the training set. Because of multiple testing and the possibility of false discovery, this model was locked and then applied to an independent test set to which the statistical analysis team was kept blinded. The selected protein groups were as follows: ER function (ER, ERpS118, ERpS167, PR, AR, EIG121, Bcl2, GATA3, IGF1R, and IGFBP2), grade/proliferation (CCNB1, CCND1, CCNE1, CCNE2, and PCNA), and receptor tyrosine kinase activity (cKit, EGFR, EGFRp1045, EGFRp922, HER2, HER2p1248, FGFR1, FGFR2, IGF1R, IGFRpY1135/Y1136).
RFS was estimated according to the Kaplan-Meier method and compared between groups using the log-rank statistic. Cox proportional Hazard Models were fitted using proteomic subgroups, selected markers and clinical variables.
Decision trees
We constructed a statistical model to predict the classes discovered by hierarchical clus-tering using a binary decision tree with a logistic regression model at each node. The split at each node was a union of two of the classes. Protein-by-protein two-sample t-tests between the two halves of the split were computed. The proteins were ordered by p-value and then added one at a time into a logistic regression model until the desired prediction accuracy was achieved. In order to avoid overfitting data, a default precision accuracy of 95% was set for each node. Finally, the Akaike Information Criterion (AIC) was used to eliminate redundant terms from the logistic regression model [23].
Validation of Prognostic Groups for RFS
The coefficients of the model, which used logistic regression at each node of a decision tree to place samples in one of six classes (or prognostic groups) were finalized and locked. An implementation of the model was provided to an independent analyst, along with the class predictions. The independent analyst was provided with the unblinded clinical data after implementation of the model. Cox proportional hazards models were then constructed using the predicted classes as covariates to test their association with RFS.
Validation of Prognostic Groups for pCR
We applied the algorithm to the last sample set (132 FNAs) and correlated the groups with response to NST. We clustered the samples as above and compared these clusters to the class labels predicted by the decision tree model with Cohen’s kappa statistic [24,25]. Using the predicted prognostic groups, we developed a Bayesian model to esti-mate the posterior probability of pCR in each group. We modeled the pCR rates as coming from a beta-binomial distribution [26].
Development of a Prognostic Score and its Application to Prediction of pCR
We next converted the six prognostic groups into a continuous prognostic score (PS) by fitting an ordinal regression model on the training set [27]. PS is a weighted linear combination of the relative protein concentration of the markers:
We used this formula to compute PS on the test set; PS was associated with RFS estimates by the Cox proportional hazards model. We also used the same formula to compute PS on the NST treated FNA set. We fitted a logistic regression model using the NST response as the binary response variable (pCR vs. residual disease) and PS as a predictor. The prediction of response was evaluated by a receiver operating charac-teristics (ROC) curve.
Models for Recurrence-Free Survival and Likelihood of Pathologic Complete Response
A Cox proportional hazards model to estimate association with RFS was fit using each of the following covariates: prognostic group, tumor size, histologic grade, node status, each of the 10 protein markers, and PS. Using the same covariates, a logistic regression model was fit to estimate the association of each covariate with pCR. Stepwise multi-variate model selection [28,29] was used to determine the combination of comulti-variates for the multivariate models.
All statistical analysis was performed in R 2.8.1. (R Development Core Team (2008). R: A language and environment for statistical computing (R Foundation for Statistical Computing, Vienna, Austria). http://www.R-project.org.
Results
Unsupervised Proteomic Clustering
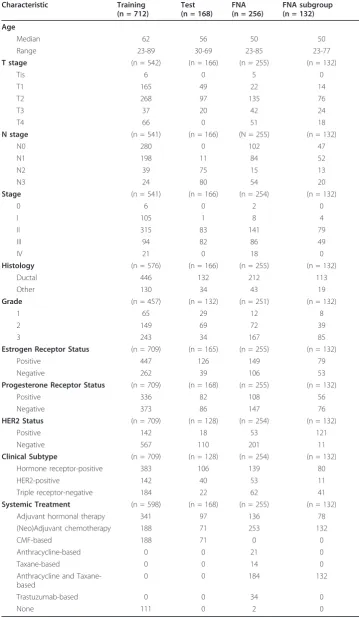
Table 1 summarizes the clinical characteristics of each set. Training set (n = 712) was analyzed for 146 proteins (Additional File 1, Table S1) using RPPA. Proteins were cho-sen based on a literature search of important targets and proteomic processes in breast cancer for which robust antibodies binding to a single or dominant band on western blotting could be identified and validated for RPPA as described [1-3,30-32]. Unsuper-vised clustering of the proteomic profiles is shown in Additional file 1: Figure S1. The 146 proteins stratified breast cancers into six major groups with different RFS out-comes (Additional file 1: Figure S2). The six groups included a predominantly HER2-positive group, a HR-negative and HER2-negative (triple receptor-negative) group with poor outcomes, a HR-positive group with a good outcome and three groups with inter-mediate outcome: an HR group with overexpression of proteins including cyclins B1 and E1 as well as components of the protein synthesis machinery including phosphory-lated S6 ribosomal protein and 4EBP1, a group with overexpression of stromal markers including collagen VI, CD31 and caveolin1, and a group defined by up-regulation of a large number of proteins and phospho-proteins in several mechanistic pathways.
Supervised Proteomic Clustering
Table 1 Clinical characteristics of all sets
Characteristic Training (n = 712)
Test (n = 168)
FNA (n = 256)
FNA subgroup (n = 132)
Age
Median 62 56 50 50
Range 23-89 30-69 23-85 23-77
T stage (n = 542) (n = 166) (n = 255) (n = 132)
Tis 6 0 5 0
T1 165 49 22 14
T2 268 97 135 76
T3 37 20 42 24
T4 66 0 51 18
N stage (n = 541) (n = 166) (N = 255) (n = 132)
N0 280 0 102 47
N1 198 11 84 52
N2 39 75 15 13
N3 24 80 54 20
Stage (n = 541) (n = 166) (n = 254) (n = 132)
0 6 0 2 0
I 105 1 8 4
II 315 83 141 79
III 94 82 86 49
IV 21 0 18 0
Histology (n = 576) (n = 166) (n = 255) (n = 132)
Ductal 446 132 212 113
Other 130 34 43 19
Grade (n = 457) (n = 132) (n = 251) (n = 132)
1 65 29 12 8
2 149 69 72 39
3 243 34 167 85
Estrogen Receptor Status (n = 709) (n = 165) (n = 255) (n = 132)
Positive 447 126 149 79
Negative 262 39 106 53
Progesterone Receptor Status (n = 709) (n = 168) (n = 255) (n = 132)
Positive 336 82 108 56
Negative 373 86 147 76
HER2 Status (n = 709) (n = 128) (n = 254) (n = 132)
Positive 142 18 53 121
Negative 567 110 201 11
Clinical Subtype (n = 709) (n = 128) (n = 254) (n = 132)
Hormone receptor-positive 383 106 139 80
HER2-positive 142 40 53 11
Triple receptor-negative 184 22 62 41
Systemic Treatment (n = 598) (n = 168) (n = 255) (n = 132)
Adjuvant hormonal therapy 341 97 136 78
(Neo)Adjuvant chemotherapy 188 71 253 132
CMF-based 188 71 0 0
Anthracycline-based 0 0 21 0
Taxane-based 0 0 14 0
Anthracycline and Taxane-based
0 0 184 132
Trastuzumab-based 0 0 34 0
None 111 0 2 0
presence of the six subgroups as well as their RFS in an independent test set, (Log-rank p = 0.0013), (Figures 1B and 1E). Table 2 summarizes the 5-year RFS estimates for each of the prognostic groups in the training and test sets.
We applied this classification approach to 256 FNAs from MDACC. In order to con-firm that the same clusters were present, we compared the patient groups obtained by direct hierarchical clustering of the 256 FNA samples to the prognostic groups pre-dicted in the FNA samples by the decision tree model derived from the training set (Cohen’s = 0.70, p < 1E-20). The decision tree predictions were also applied to the subset of 132 FNAs from patients who received uniform anthracycline and taxane-based NST, and the same six clusters were found (Cohen’s = 0.66, p value < 1E-20, Figure 2A). The association between pCR rates and the (predicted) prognostic groups did not quite reach statistical significance (c2= 10.3076 on 5 degrees of freedom; p = 0.067). However, a Bayesian analysis of the pCR rates indicated that there was at least a 70% posterior probability that groups PG2 and PG3 have pCR rates at least 5% lower than those in PG4 or PG6 (Figure 2B).
Prognostic Score Predicts pCR
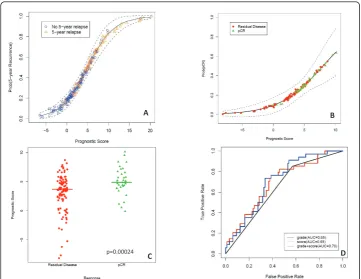
As described in Methods, we computed a continuous prognostic score (PS) based on the grouping defined in the training set. A Cox proportional hazards model on the training set (CoxTrain) using PS to predict RFS was significant (Wald test; coefficient = 0.128, p = 3.2E-13). A second Cox model, fit on the test set (CoxTest), was also sig-nificant (Wald test; coefficient = 0.084, p = 1.1E-05) (Figure 3A). Of 132 patients who received anthracycline-taxane-based NST, 32 (24%) had a pCR. We computed the prognostic score PS for each FNA sample; the values ranged from -8.16 to 10.16. A
C D E
A B
P=8.8E-10 P=0.0013
Training Test
logistic regression model showed that PS was also significantly associated with pCR (p = 0.0021, Figure 3B). Further, an unequal variance t-test comparing the prognostic scores between patients with pCR and residual disease also revealed a significant differ-ence between mean scores (p = 0.00024 Figure 3C). The area under the curve (AUC) in a ROC curve analysis was 0.7 with a specificity of 98% and a negative predictive value of 76% (Figure 3D).
Models for Recurrence-Free Survival and Likelihood of Pathologic Complete Response
Univariate models for RFS (Cox proportional hazards on the test set; CoxTest) and pCR (logistic regression on the uniformly treated FNA dataset; LR-FNA) are Table 2 Five-year DFS estimates for each of the prognostic groups in both the training and test sets
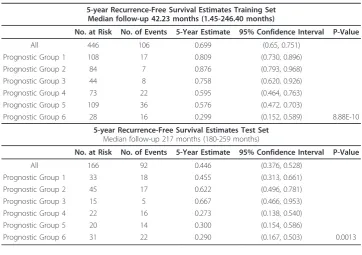
5-year Recurrence-Free Survival Estimates Training Set Median follow-up 42.23 months (1.45-246.40 months)
No. at Risk No. of Events 5-Year Estimate 95% Confidence Interval P-Value
All 446 106 0.699 (0.65, 0.751)
Prognostic Group 1 108 17 0.809 (0.730, 0.896)
Prognostic Group 2 84 7 0.876 (0.793, 0.968)
Prognostic Group 3 44 8 0.758 (0.620, 0.926)
Prognostic Group 4 73 22 0.595 (0.464, 0.763)
Prognostic Group 5 109 36 0.576 (0.472, 0.703)
Prognostic Group 6 28 16 0.299 (0.152, 0.589) 8.88E-10
5-year Recurrence-Free Survival Estimates Test Set Median follow-up 217 months (180-259 months)
No. at Risk No. of Events 5-Year Estimate 95% Confidence Interval P-Value
All 166 92 0.446 (0.376, 0.528)
Prognostic Group 1 33 18 0.455 (0.313, 0.661)
Prognostic Group 2 45 17 0.622 (0.496, 0.781)
Prognostic Group 3 15 5 0.667 (0.466, 0.953)
Prognostic Group 4 22 16 0.273 (0.138, 0.540)
Prognostic Group 5 20 14 0.300 (0.154, 0.586)
Prognostic Group 6 31 22 0.290 (0.167, 0.503) 0.0013
A B
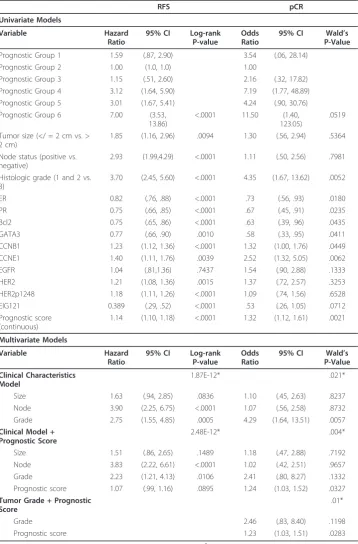
summarized in Table 3. All clinical and molecular variables, except for EGFR, were sig-nificantly associated with RFS. The addition of the prognostic score to the model with clinical covariates reduced the residual deviance with a X21= 2.96, p = 0.09. Stepwise
model selection using AIC retained all clinical covariates and the prognostic score for the final model:
log(h(t)/h0(t)) = 0.414Size + 1.34Node + 0.803Grade + 0.070PrognosticScore.
For response (pCR vs. residual disease), grade was the only clinical covariate signifi-cantly associated with response. All protein markers except EGFR, HER2, pHER21248 and EIG121 were significantly associated with response. The addition of the prognostic score to grade reduced residual deviance with a X21 = 5.39, p = 0.02. Stepwise model
selection using AIC showed that both grade and prognostic score were retained in the final model:
logit(pCR) = -2.61 + 0.902Grade + 0.2210PrognosticScore.
We compared ROC curves for predicting pCR by the prognostic scores and the step-wise selected model and found that AUC, as well as the specificity and negative
D C
B A
p=0.00024
Table 3 Models for Recurrence-Free Survival and likelihood of pathological complete response RFS pCR Univariate Models Variable Hazard Ratio
95% CI Log-rank P-value
Odds Ratio
95% CI Wald’s P-Value
Prognostic Group 1 1.59 (.87, 2.90) 3.54 (.06, 28.14)
Prognostic Group 2 1.00 (1.0, 1.0) 1.00
Prognostic Group 3 1.15 (.51, 2.60) 2.16 (.32, 17.82)
Prognostic Group 4 3.12 (1.64, 5.90) 7.19 (1.77, 48.89)
Prognostic Group 5 3.01 (1.67, 5.41) 4.24 (.90, 30.76)
Prognostic Group 6 7.00 (3.53, 13.86)
<.0001 11.50 (1.40, 123.05)
.0519
Tumor size (</ = 2 cm vs. > 2 cm)
1.85 (1.16, 2.96) .0094 1.30 (.56, 2.94) .5364
Node status (positive vs. negative)
2.93 (1.99,4.29) <.0001 1.11 (.50, 2.56) .7981
Histologic grade (1 and 2 vs. 3)
3.70 (2.45, 5.60) <.0001 4.35 (1.67, 13.62) .0052
ER 0.82 (.76, .88) <.0001 .73 (.56, .93) .0180
PR 0.75 (.66, .85) <.0001 .67 (.45, .91) .0235
Bcl2 0.75 (.65, .86) <.0001 .63 (.39, .96) .0435
GATA3 0.77 (.66, .90) .0010 .58 (.33, .95) .0411
CCNB1 1.23 (1.12, 1.36) <.0001 1.32 (1.00, 1.76) .0449
CCNE1 1.40 (1.11, 1.76) .0039 2.52 (1.32, 5.05) .0062
EGFR 1.04 (.81,1.36) .7437 1.54 (.90, 2.88) .1333
HER2 1.21 (1.08, 1.36) .0015 1.37 (.72, 2.57) .3253
HER2p1248 1.18 (1.11, 1.26) <.0001 1.09 (.74, 1.56) .6528
EIG121 0.389 (.29, .52) <.0001 .53 (.26, 1.05) .0712
Prognostic score (continuous)
1.14 (1.10, 1.18) <.0001 1.32 (1.12, 1.61) .0021
Multivariate Models
Variable Hazard
Ratio
95% CI Log-rank P-value
Odds Ratio
95% CI Wald’s P-Value
Clinical Characteristics Model
1.87E-12* .021*
Size 1.63 (.94, 2.85) .0836 1.10 (.45, 2.63) .8237
Node 3.90 (2.25, 6.75) <.0001 1.07 (.56, 2.58) .8732
Grade 2.75 (1.55, 4.85) .0005 4.29 (1.64, 13.51) .0057
Clinical Model + Prognostic Score
2.48E-12* .004*
Size 1.51 (.86, 2.65) .1489 1.18 (.47, 2.88) .7192
Node 3.83 (2.22, 6.61) <.0001 1.02 (.42, 2.51) .9657
Grade 2.23 (1.21, 4.13) .0106 2.41 (.80, 8.27) .1332
Prognostic score 1.07 (.99, 1.16) .0895 1.24 (1.03, 1.52) .0327 Tumor Grade + Prognostic
Score
.01*
Grade 2.46 (.83, 8.40) .1198
Prognostic score 1.23 (1.03, 1.51) .0283
RFS: Recurrence-free survival; pCR; pathologic complete response. * X2
predictive values were the same (0.7, 98% and 76% respectively), suggesting that the prognostic score may be a more powerful predictor than clinical information.
Discussion
We have identified and validated a 10-protein panel that accurately and reproducibly classifies patients with breast cancer into six subgroups with significantly different 5-year RFS times. These six groups included two HR positive groups differentiated pri-marily by PR levels with the PR high group having the best outcome, a HER2, pHER2 and EGFR positive group with the worst outcome (pre-trastuzumab treatment) and three triple negative groups, one with high cyclins and two groups without well defined selectors. Further, in an independent set of FNAs from patients who underwent NST, we were able to reproduce this classification and to use it to predict response to neoadjuvant anthracycline and taxane-based therapy. Further, in three independent sets, the 10-protein signature had a higher predictive value than clinical variables including tumor size, nodal status and grade in Cox models for RFS and in a logistic regression model to predict pCR.
Several studies using transcriptional profiling have classified breast cancer into differ-ent subtypes with implications in patidiffer-ent prognosis [1,30-32], frequency of genomic alterations [33,34], and therapy response [31,35,36]. Since proteins are the immediate effectors of cellular behavior, interrogation of the functional proteome is likely to com-plement data derived from transcriptional profiling. Thus, the integrated study of the expression and activation of multiple proteins and signaling pathways has the potential to provide powerful classifiers and predictors in breast cancer. As protein levels and function depend not only on translation but also on post-translational modifications, functional proteomic profiling may theoretically yield more direct answers to func-tional and pharmacological questions than transcripfunc-tional profiling alone. However, practical, high-throughput approaches to the study of the functional proteome have not been available until recently. RPPA is a useful tool to identify and validate protein and phospho-proteins [19-23]. Our data suggest that RPPA has the potential to advance our understanding of breast cancer biology and to aid in the identification and validation of useful biomarkers. Our findings validate the importance of ER, PR and HER2. However, seven additional markers including other tyrosine kinase receptors and proliferation markers involved in therapy resistance (EGFR, CCNB1, CCNE1) are part of the 10-protein panel. The combination of 10 markers and the power of the 10 markers as compared to ER/PR and HER2 is novel. The ER, PR and HER2 and the proliferation markers correspond to other breast cancer classifiers such us the intrinsic subtypes or the Oncotype DX Recurrence Score which have also shown that ER, HER2 and proliferation are the most important classifiers, prognostic and predictive markers in breast cancer [1,31]. This demonstrates that RPPA can capture prognostic and pre-dictive differences associated with breast cancer subtypes.
at all steps in any project. The current study has satisfied all of the requirements men-tioned above. RPPA is a robust platform able to detect minimal changes in protein levels [15]. Three large independent sample sets with adequate clinical and outcome information were used for training and testing. Bioinformaticians were closely involved in study design as well as data analyses.
Our findings also have limitations. Patient cohorts received diverse types of systemic treatments and limiting the ability to dissect effects on prognosis from variables that predict endocrine and/or chemotherapy sensitivity. When looking at pCR predictors, all prognostic signatures can reasonably predict pCR, however patients predicted to obtain pCR may have significantly worse survival than those predicted not to respond due to different prognostic variables i.e. HR positivity. So, if our signature is primarily prognostic, its potential utility for selecting chemotherapy sensitivity would be limited; for this reason, validation studies in independent cohorts are needed.
The issues of tumor heterogeneity and the utility of laser captured microdissection were considered in our previous work focusing on the technical assessment of the uti-lity of RPPA for the study of the functional proteome in non-microdissected human breast cancers [20]. This approach used captures information contained in the tumor cells, the stroma and in particular the tumor stroma interaction. The approach of using the complete tumor including interactions of tumor and stroma to classify patients and predict outcomes is the basis for the current transcriptional profiling approaches such as Oncotype Dx or Mammaprint. We have attempted to develop and implement RPPA approaches on microdissected tumors. However, due to a number of technical challenges, this approach is not as robust as study of complete tumors which captures information from the tumor and the stroma as well as tumor stroma interactions.
In summary, we have developed a 10-protein biomarker panel that may have poten-tial utility in the management of patients with breast cancer. Today, it is clear that we should view breast cancer as several distinct diseases. Thus, further work is needed to identify predictors of response to individual therapies that target different clinical and molecular subgroups of breast cancer.
Abbreviations Page
AIC: Akaike Information Criterion; BCA: Bicinchoninic acid assay; ER: estrogen recep-tor; FISH: Flourescent in-situ hybridization; FNA: Fine needle aspirate; HR: hormone receptor; IHC: Immunohistochemistry; MDACC: MD Anderson Cancer Center; NST: Neoadjuvant systemic therapy; pCR: Pathologic complete response; PR: Progesterone receptor; PS: Prognostic Score; RFS: Recurrence-free survival; ROC: Receiving operat-ing curve; RPPA: Reverse phase protein array
Additional material
Additional file 2: Expansion of the Statistical methods. More detailed description of the statistical methods with the corresponding references.
Additional file 3: Breast cancer classifier via a logistic-regression decision tree. Locked logistic-regression tree used for validation
Acknowledgements and funding
The authors are thankful to Xuemei Wang for outstanding statistical help and review of the manuscript.
This work was supported in part by the Kleberg Center for Molecular Markers at M. D. Anderson Cancer Center, ASCO Career Development Award, NCI 1K23CA121994-01 and NCI 1R21CA120248-01 (to A.M.G.), The Susan G. Komen Foundation FAS0703849 (to A. M. G., B. T. H., G. B. M.), NCI 1R01CA112199 and NCRR Grant 3UL1RR024148 (to F.M.B.), the Research Council of Norway grant 175240/S10 (to A.L.B.), and the Danish Cancer Society, Danish Council for Strategic Research, and CIRRO, The Lundbeck Foundation Centre for Interventional Research in Radiation Oncology (to J.A., J.O.).
Author details 1
Departments of Breast Medical Oncology and Systems Biology, The University of Texas MD Anderson Cancer Center, 1515 Holcombe Blvd, Houston, TX 77030, USA.2Departments of Gynecology Medical Oncology and Systems Biology, The University of Texas MD Anderson Cancer Center, 1515 Holcombe Blvd, Houston, TX 77030, USA.3Department of Surgical Oncology, The University of Texas MD Anderson Cancer Center, 1515 Holcombe Blvd, Houston, TX 77030, USA.4Department of Pathology, The University of Texas MD Anderson Cancer Center, 1515 Holcombe Blvd, Houston, TX 77030, USA.5Department of Bioinformatics, The University of Texas MD Anderson Cancer Center, 1515 Holcombe Blvd, Houston, TX 77030, USA.6Department of Bioinformatics, The University of Texas MD Anderson Cancer Center, 1515 Holcombe Blvd, Houston, TX 77030, USA.7Department of Systems Biology, The University of Texas MD Anderson Cancer Center, 1515 Holcombe Blvd, Houston, TX 77030, USA.8Department of Genetics, Institute for Cancer Research, The Norwegian Radium Hospital, and Faculty Division The Norwegian Radium Hospital, Faculty of Medicine, University of Oslo, Sognsvannsveien 20, Oslo 0027 Norway.9Lester and Sue Smith Breast Center, Baylor College of Medicine, 1 Baylor Plaza # Bcm600, Houston, TX 77030, USA.10Department of Pathology, The University of Texas MD Anderson Cancer Center, 1515 Holcombe Blvd, Houston, TX 77030, USA.11Department of Pathology, The University of Texas MD Anderson Cancer Center, 1515 Holcombe Blvd, Houston, TX 77030, USA.12Department of Hematology and Oncology, Hospital Clinico Universitario de Valencia, Avenida Blasco Ibáñez, 17, Valencia, 46010, Spain.13Molecular Oncology and Breast Cancer Program, University of British Columbia, 2211 Wesbrook Mall, Vancouver, British Columbia V6T 2B5, Canada.14Department of Cancer prevention, The University of Texas MD Anderson Cancer Center, 1515 Holcombe Blvd, Houston, TX 77030, USA.15Department of Breast Medical Oncology, The University of Texas MD Anderson Cancer Center, 1515 Holcombe Blvd, Houston, TX 77030, USA.16Department of Pathology, The University of Texas MD Anderson Cancer Center, 1515 Holcombe Blvd, Houston, TX 77030, USA.17Department of Experimental Clinical Oncology, Aarhus University Hospital, Nordre Ringgade 1, DK-8000, Aarhus, Denmark.18Department of Experimental Clinical Oncology, Aarhus University Hospital, Nordre Ringgade 1, DK-8000, Aarhus, Denmark.19Department of Genetics, Institute for Cancer Research, The Norwegian Radium Hospital, and Faculty Division The Norwegian Radium Hospital, Faculty of Medicine, University of Oslo, Sognsvannsveien 20, Oslo 0027 Norway.20Department of Breast Medical Oncology, The University of Texas MD Anderson Cancer Center, 1515 Holcombe Blvd, Houston, TX 77030, USA.21Department of Bioinformatics, The University of Texas MD Anderson Cancer Center, 1515 Holcombe Blvd, Houston, TX 77030, USA.22Department of Systems Biology, The University of Texas MD Anderson Cancer Center, 1515 Holcombe Blvd, Houston, TX 77030, USA.
Authors’contributions
AMG-A:Contributed samples, Performed all experiments, Analyzed the data, Wrote the manuscript, Funded the experiments. BTH:Contributed samples, Performed all experiments, Analyzed the data, Wrote the manuscript, Funded the experiments. FMB:Contributed samples, Analyzed the data, Wrote the manuscript. AS:Contributed samples, Approved final manuscript. WL:Analyzed the data, Approved final manuscript. ZJ:Analyzed the data, Approved final manuscript. MSC:Contributed samples, Performed experiments. SM:Contributed samples, Approved final manuscript. CS:Contributed samples, Approved final manuscript. LD:Contributed antibodies, Approved final manuscript. RB: Contributed antibodies, Approved final manuscript. AL:Contributed samples, Approved final manuscript SA: Contributed samples, Approved final manuscript. PB:Contributed samples, Approved final manuscript. LP:Contributed samples, Approved final manuscript. WFS:Contributed samples, Approved final manuscript. JA:Contributed samples, Approved final manuscript. JO:Contributed samples, Approved final manuscript. A-LB-D:Contributed samples, Approved final manuscript. GNH:Contributed data, Approved final manuscript. KRC:Analyzed the data, Approved final manuscript. GBM:Contributed samples, Analyzed the data, Wrote the manuscript, Funded the experiments, Approved final manuscript. All authors read and approved the final manuscript.
Competing interests
Authors declare that they have no competing interests.
Received: 5 July 2011 Accepted: 8 July 2011 Published: 8 July 2011
References
2. Pusztai L, Ayers M, Stec J,et al:Gene expression profiles obtained from fine-needle aspirations of breast cancer reliably identify routine prognostic markers and reveal large-scale molecular differences between estrogen-negative and estrogen-positive tumors.Clin Cancer Res2003,9:2406-15.
3. van de Vijver MJ, He YD, van’t Veer LJ,et al:A gene-expression signature as a predictor of survival in breast cancer. N Engl J Med2002,347:1999-09.
4. Gygi SP, Rochon Y, Franza BR, Aebersold R:Correlation between protein and mRNA abundance in yeast.Mol Cell Biol 1999,19:1720-30.
5. Diks SH, Peppelenbosch MP:Single cell proteomics for personalised medicine.Trends Mol Med2004,10:574-7. 6. Yeh E, Cunningham M, Arnold H,et al:A signalling pathway controlling c-Myc degradation that impacts oncogenic
transformation of human cells.Nat Cell Biol2004,6:308-18.
7. Amerik AY, Hochstrasser M:Mechanism and function of deubiquitinating enzymes.Biochem Biophys Acta2004, 1695:189-207.
8. Rastogi P, Anderson SJ, Bear HD,et al:Pathologic assessment of response to induction chemotherapy in breast cancer. Preoperative chemotherapy: updates of National Surgical Adjuvant Breast and Bowel Project Protocols B-18 and B-27.J Clin Oncol2008,10(26):78-85.
9. Kuerer HM, Newman LA, Smith TL,et al:Clinical course of breast cancer patients with complete pathologic primary tumor and axillary lymph node response to doxorubicin-based neoadjuvant chemotherapy.J Clin Oncol1999, 17:460-9.
10. Guarneri V, Broglio K, Kau S,et al:Prognostic value of pathologic complete response after primary chemotherapy in relation to hormone receptor status and other factors.J Clin Oncol2006,24:1037-44.
11. Symmans WS, Peintinger F, Hatzis C,et al:Measurement of residual breast cancer burden to predict survival after neoadjuvant chemotherapy.J Clin Oncol2007,25:4414-22.
12. Honkoop AH, Pinedo HM, De Jong JS,et al:Effects of chemotherapy on pathologic and biologic characteristics of locally advanced breast cancer.Am J Clin Pathol1997,107:211-8.
13. Overgaard M, Hansen PS, Overgaard J,et al:Postoperative radiotherapy in high-risk premenopausal women with breast cancer who receive adjuvant chemotherapy. Danish Breast Cancer Cooperative Group 82b Trial.N Engl J Med1997,337:949-55.
14. Overgaard M, Hansen PS, Overgaard J,et al:Postoperative radiotherapy in high-risk postmenopausal breast-cancer patients given adjuvant tamoxifen: Danish Breast Cancer Cooperative Group DBCG 82c randomised trial.Lancet 1999,353:1641-8.
15. Stemke-Hale K, Gonzalez-Angulo AM, Lluch A,et al:An integrative genomic and proteomic analysis of PIK3CA, PTEN and AKT mutations in breast cancer.Cancer Res2008,68:6084-91.
16. Tibes R, Qiu Y, Lu Y, Hennessy B, Mills GB, Kornblau S, Reverse phase protein array (RPPA):Validation of a novel proteomic technology and utility for analysis of primary leukemia specimens and hematopoietic stem cells.Mol Cancer Ther2006, 2512-21.
17. Liang J, Shao SH, Xu ZX, Hennessy B, Ding Z, Larrea M,et al:The energy sensing LKB1-AMPK pathway regulates p27kip1 phosphorylation mediating the decision to enter autophagy or apoptosis.Nat Cell Biol2007,9:218-24. 18. Hu J, He X, Baggerly KA, Coombes KR, Hennessy BT, Mills GB:Non-parametric quantification of protein lysate arrays.
Bioinformatics2007,23:1986-94.
19. Hennessy BT, Lu Y, Poradosu E, Liu Q, Yu S, Hall H,et al:Quantified pathway inhibition as a pharmacodynamic marker facilitating optimal targeted therapy dosing: Proof of principle with the AKT inhibitor perifosine.Clin Cancer Res2007,13:7421-31.
20. Hennessy BT, Lu Y, Gonzalez-Angulo AM, Carey MS, Myhre S, Ju Z,et al:A technical assessment of the utility of reverse phase protein arrays for the study of the functional proteome in non-microdissected human breast cancers.Clin Proteomics2010,6:129-151.
21. Eisen MB, Spellman PT, Brown PO, Botstein D:Cluster analysis and display of genome-wide expression patterns.Proc Natl Acad Sci USA1998,95:14863-8.
22. Ward JH:Hierachical grouping to optimize an objective function.J Am Statist Assoc1963,58:236-44.
23. Akaike H:A new look at the statistical model identification.IEEE Transactions on Automatic Control1974,19:716-23. 24. Wolfrum C:Appearance of quasiequivalent solutions, in a generalization of the Kruskal scale technic, to metric
spaces using a Minkowski metric.Arch Psychol1976,128:96-111.
25. Landis JR, Koch GG:The measurement of observer agreement for categorical data.Biometrics1977,33:159-74. 26. Gelman A, Carlin JB, Stern HS, Rubin DB:Bayesian Data Analysis.Boca Raton, FL. Chapman & Hall;, 2 2004, 125-31. 27. Verweij PJM, Van Houwelingen JC:Penalized likelihood in Cox regression.Stat in Med1994,13:2427-36.
28. Hastie TJ, Pregibon D:Generalized linear models.InStatistical Models in S. Wadsworth & Brooks/Cole Computer Science Series.Edited by: Chambers JM and Hastie TJ. Boca Raton, Fla. Chapman 1991:195-248.
29. Venables WN, Ripley BD:Generalized Linear Models.InModern Applied Statistics with S..4 edition. Edited by: Venables WN, Ripley BD. New York, NY. Springer-Verlag; 2002:183-208.
30. Ayers M, Symmans WF, Stec J,et al:Gene expression profiles predict complete pathologic response to neoadjuvant paclitaxel and fluorouracil, doxorubicin, and cyclophosphamide chemotherapy in breast cancer.J Clin Oncol2004, 22:2284-93.
31. Paik S, Shak S, Tang G,et al:A multigene assay to predict recurrence of tamoxifen-treated, node-negative breast cancer.N Engl J Med2004,351:2817-26.
32. Hu Z, Fan C, Oh DS,et al:The molecular portraits of breast tumors are conserved across microarray platforms.BMC Genomics2006,7:96.
33. Fan C, Oh DS, Wessels L,et al:Concordance among gene-expression-based predictors for breast cancer.N Engl J Med2006,355:560-9.
34. Bergamaschi A, Kim YH, Wang P,et al:Distinct patterns of DNA copy number alteration are associated with different clinicopathological features and gene-expression subtypes of breast cancer.Genes Chromosomes Cancer 2006,45:1033-40.
36. Hess KR, Anderson K, Symmans WF,et al:Pharmacogenomic predictor of sensitivity to preoperative chemotherapy with paclitaxel and fluorouracil, doxorubicin, and cyclophosphamide in breast cancer.J Clin Oncol2006,24:4236-44.
doi:10.1186/1559-0275-8-11
Cite this article as:Gonzalez-Anguloet al.:Functional proteomics can define prognosis and predict pathologic complete response in patients with breast cancer.Clinical Proteomics20118:11.
Submit your next manuscript to BioMed Central and take full advantage of:
• Convenient online submission
• Thorough peer review
• No space constraints or color figure charges
• Immediate publication on acceptance
• Inclusion in PubMed, CAS, Scopus and Google Scholar
• Research which is freely available for redistribution