Neighborhoods, Healthier Children
2013
Correlates of Active School Transport Immediately Before and
Correlates of Active School Transport Immediately Before and
After the Transition from Primary to Secondary School: A
After the Transition from Primary to Secondary School: A
Pilot-Study
Study
Richard Larouche
Children's Hospital of Eastern Ontario, [email protected]
Guy Faulkner
University of Toronto, [email protected]
Mark S. Tremblay
Children's Hospital of Eastern Ontario, [email protected]
Follow this and additional works at: https://digitalcommons.library.tmc.edu/childrenatrisk
Recommended Citation Recommended Citation
Larouche, Richard; Faulkner, Guy; and Tremblay, Mark S. (2013) "Correlates of Active School Transport Immediately Before and After the Transition from Primary to Secondary School: A Pilot-Study," Journal of Applied Research on Children: Informing Policy for Children at Risk: Vol. 4 : Iss. 2 , Article 4.
Available at: https://digitalcommons.library.tmc.edu/childrenatrisk/vol4/iss2/4
The Journal of Applied Research on Children is brought to you for free and open access by CHILDREN AT RISK at
Introduction
During the last decade, active school transport (AST) has emerged as an important topic in the fields of public health, urban planning and environmental sciences.1-3 Despite the numerous benefits of AST, the proportion of children and youth using active modes of transport such as walking and cycling is generally very low and has decreased markedly in the last decades in countries such as Australia,4 Canada,5 and the United States.6 Moreover, according to a recent systematic review, most AST promotion interventions (ie, Safe Routes to School and walking school buses) have led to modest increases in walking and cycling to/from school and the magnitude of the observed changes has been heterogenous.7
Current theoretical models assume that parents are the key decision makers with respect to their children’s travel mode8,9; hence, a large proportion of studies that examined perceived barriers to AST have focused on parents’ perceptions. There is consistent evidence showing that the distance between a child’s residence and the school that he/she attends (both perceived and objectively measured) is a strong determinant of travel mode choices.10-12 However, travel decisions can also be influenced by a wide array of factors pertaining to different levels of influence as postulated by social-ecological theory.9,13 These may include personal characteristics (eg, attitudes toward walking and cycling), the social environment (eg, social support from family and friends), public policies (eg, school policies, municipal bylaws), the built environment (eg, availability of sidewalks and bicycle paths), and the physical environment (eg, topography). These two models9,13 also posit that the relationship between the correlates of AST and travel patterns is moderated by the age of the child, but longitudinal studies on this topic are scarce.
Although children may have some input into travel mode decisions, few studies have simultaneously assessed child- and parent-perceived barriers to AST.9 Timperio and colleagues14,15 examined perceived barriers among children of different age groups and their parents, but they did not report the concordance between these perceptions. More recently, Napier and colleagues16 reported that children’s and parents’ perception of five different barriers to AST was similar, except in areas defined as “less walkable” where parents expressed greater concerns. Further research is warranted to determine the extent to which children’s and parents’ perceptions are concordant across a larger number of barriers pertaining to multiple levels of influence.
to choose to live in “walkable areas”.17,18 For example, Frank and colleagues17 assessed the relative influence of neighborhood walkability and self-selection, and they found that both aspects were independently associated with adults’ travel modes. To our knowledge, only one study has examined the influence of parental neighborhood selection factors on children’s travel patterns, reporting that children were more likely to engage in AST if their parents had chosen to live in their neighborhood so that their children could walk to school.19 Hence, further research is needed to confirm this association and examine the influence of other parental neighborhood selection factors; for instance parents could choose their neighborhood for its proximity to their workplace or because of monetary constraints.
In addition, there is a growing body of evidence showing that socio-demographic characteristics can influence children’s travel mode. Many North American studies have shown that girls20-22 and children living in high socioeconomic status (SES) families21,23,24 are less likely to walk or cycle to/from school. Other researchers have reported that car ownership was inversely related to AST.25 This evidence underscores the need for studies of correlates of AST to consider socio-demographic factors.
Therefore, the present pilot-study had four key objectives: 1) to assess the concordance between child- and parent-perceived barriers to AST; 2) to examine the association between child- and parent-perceived barriers to AST and children’s primary mode of transport; 3) to explore the influence of different parental neighborhood selection factors on children’s travel mode; and 4) to investigate the association between a series of socio-demographic characteristics of the household and AST. These relationships were assessed at the end of primary school (grade six) and the beginning of secondary school (grade seven) among the same participants. This important transition period is associated with a large decrease in physical activity levels.26
Methods
questionnaire at baseline or because they did not respond to our e-mail reminders. Of the 38 remaining participants, 31 returned their study packages, but two of these contained blank questionnaires; thus data from 29 participants was included in the follow-up analyses. Baseline data were collected in May/June 2012 and the follow-up data in September/October 2012. Primary and secondary schools were respectively given a $100 and $50 honorarium for participation in the study to support physical activity-related initiatives. Ethical approval was obtained from institutional research ethics boards and from the two participating school boards.
Setting. Previous research has shown that secondary schools generally have larger catchment areas than primary schools.27 As a result, the average distance between participants’ home and the school that they attend should be greater for secondary school students; thereby, the school transition could lead to a decrease in the mode share of AST (eg, the proportion of children engaging in AST). In the subsample of participants (n = 28) that provided baseline and follow-up data, an increase in average distance to school (from 2.61 km to 3.86 km) and a decrease in the mode share of AST (from 57.1% to 46.4%) were observed as reported elsewhere.28 According to a US study,10 average distance is generally lower in neighborhoods with greater population density; hence, population density of the primary school census tracts was obtained from the 2006 Canadian census.29 Participants attending the two primary schools located in higher density census tracts (3531-4100 inhabitants/km2) all stayed in the same area for secondary school. In contrast, those who attended the two primary schools located in lower density census tracts (988-2159 inhabitants/km2) went to seven different secondary schools, most of which were located outside of their neighborhood. All schools were located in urban areas within the city of Ottawa (Canada). Assuming that distance is a key determinant of AST, one would assume that the latter participants would be less likely to engage in AST, especially in secondary school. Presumably, the relative influence of barriers to AST will be modified given the change in school location. For example, the distance to school may increase, a different set of safety concerns may present themselves, and travel modes may become more or less convenient or available (eg, school bussing eligibility).
perceived barriers to AST that has been previously validated among youth and adults.30 In this questionnaire, individuals were asked to indicate their level of agreement with simple statements on a four-point scale ranging from 1 (strongly disagree) to 4 (strongly agree). While the Forman et al 30 scale has been validated for assessing perceived barriers to active transport for different trip purposes, only the barriers pertaining to the school trip were examined given that the present study focused on AST. Because road safety is an important correlate of AST9 that is specifically targeted by interventions promoting AST (ie, Safe Routes to School), two items were added to the scale targeting traffic around participants’ home and around the school that they attend. These items were added to get additional precision regarding the location of road safety concerns based on previous suggestion that AST research should examine characteristics of the neighborhood, route, and school environments.31,32 Third, parental neighborhood selection factors were assessed with a seven-item scale adapted from the Neighborhood Selection Questionnaire developed by Frank et al.17 Parents indicated their level of agreement with these statements on a five-point scale ranging from 1 (strongly agree) to 5 (strongly disagree). Fourth, parents were asked several socio-demographic questions including the number of children and cars in the household, whether their child had access to a bicycle, the type of family (eg, two parents, one parent or other), and the education level and employment status of the mother and father.
Data treatment. Participants were classified as active travelers if they reported using active modes of transport for at least 50% of school trips. Pilot data using the same classification method has shown substantial test-retest reliability over two consecutive weeks of measurements.28 Given the small sample size, response options for the barrrier statements were dichotomized as “disagree” (strongly disagree or somewhat disagree) and “agree” (strongly agree or somewhat agree). Similarly, response options for the neighborhood selection factors were dichotomized as “disagree” (strongly disagree, somewhat disagree or neither agree nor disagree) and “agree” (strongly agree or somewhat agree). Participants’ primary school neighborhood was coded as “higher” vs. “lower” density.
assumptions are not satisfied. These analyses were performed at baseline and follow-up with IBM SPSS 20 and α was set at .05. Finally, a posteriori
power calculations were performed with the G*Power 3.1.3 software. Variables that have sufficient statistical power (eg, ≥0.8 according to
Cohen34) are indicated in the tables.
Results
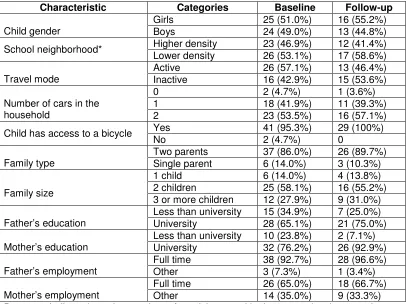
Descriptive characteristics of the sample are shown in Table 1. Almost all children had access to a bicycle and almost all parents had at least one car. The majority of children lived in two-parent families with highly educated parents and almost all fathers were full-time employed, suggesting that the household SES status may be higher than the average Canadian population.35 No significant differences in socio-demographic characteristics were found between individuals who participated in the follow-up and those who did not (all p > 0.232).
Table 1. Descriptive characteristics of the sample
Characteristic Categories Baseline Follow-up
Girls 25 (51.0%) 16 (55.2%)
Child gender Boys 24 (49.0%) 13 (44.8%)
Higher density 23 (46.9%) 12 (41.4%) School neighborhood*
Lower density 26 (53.1%) 17 (58.6%)
Active 26 (57.1%) 13 (46.4%)
Travel mode Inactive 16 (42.9%) 15 (53.6%)
0 2 (4.7%) 1 (3.6%)
1 18 (41.9%) 11 (39.3%)
Number of cars in the
household 2 23 (53.5%) 16 (57.1%)
Yes 41 (95.3%) 29 (100%)
Child has access to a bicycle
No 2 (4.7%) 0
Two parents 37 (86.0%) 26 (89.7%)
Family type Single parent 6 (14.0%) 3 (10.3%)
1 child 6 (14.0%) 4 (13.8%)
2 children 25 (58.1%) 16 (55.2%) Family size
3 or more children 12 (27.9%) 9 (31.0%) Less than university 15 (34.9%) 7 (25.0%) Father’s education University 28 (65.1%) 21 (75.0%)
Less than university 10 (23.8%) 2 (7.1%) Mother’s education University 32 (76.2%) 26 (92.9%)
Full time 38 (92.7%) 28 (96.6%)
Father’s employment Other 3 (7.3%) 1 (3.4%)
Full time 26 (65.0%) 18 (66.7%)
Mother’s employment Other 14 (35.0%) 9 (33.3%)
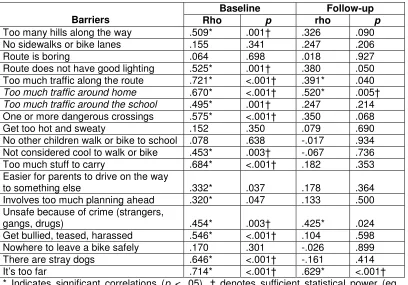
Spearman correlations between child- and parent-perceived barriers to AST at baseline and follow-up are reported in Table 2. At baseline, significant correlations (rho 0.32-0.72) were found for 14 out of 19 questionnaire items. Of particular note, correlations were generally higher for the road safety (eg, traffic, lighting and crossings) and distance components (rho ≥ 0.50). At follow-up, significant correlations between
child- and parent-perceived barriers to AST (rho 0.39-0.63) were found for only four items: traffic along the route and around the home, crime-related concerns, and distance between home and school.
Table 2. Spearman correlations between child- and parent-perceived barriers to active transportation at baseline and follow-up
Baseline Follow-up
Barriers Rho p rho p
Too many hills along the way .509* .001† .326 .090
No sidewalks or bike lanes .155 .341 .247 .206
Route is boring .064 .698 .018 .927
Route does not have good lighting .525* .001† .380 .050 Too much traffic along the route .721* <.001† .391* .040
Too much traffic around home .670* <.001† .520* .005†
Too much traffic around the school .495* .001† .247 .214
One or more dangerous crossings .575* <.001† .350 .068
Get too hot and sweaty .152 .350 .079 .690
No other children walk or bike to school .078 .638 -.017 .934 Not considered cool to walk or bike .453* .003† -.067 .736 Too much stuff to carry .684* <.001† .182 .353 Easier for parents to drive on the way
to something else .332* .037 .178 .364
Involves too much planning ahead .320* .047 .133 .500 Unsafe because of crime (strangers,
gangs, drugs) .454* .003† .425* .024
Get bullied, teased, harassed .546* <.001† .104 .598 Nowhere to leave a bike safely .170 .301 -.026 .899 There are stray dogs .646* <.001† -.161 .414
It’s too far .714* <.001† .629* <.001†
* Indicates significant correlations (p < .05). † denotes sufficient statistical power (eg, ≥0.8 according to Cohen34). The two items that were added to Forman and colleagues’ (2008) scale are in italics.
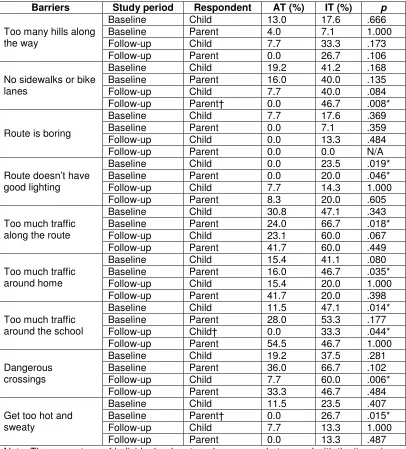
Table 3. Associations between child-perceived barriers and active school transport at baseline and follow-up
Barriers Study period Respondent AT (%) IT (%) p
Baseline Child 13.0 17.6 .666
Baseline Parent 4.0 7.1 1.000
Follow-up Child 7.7 33.3 .173
Too many hills along the way
Follow-up Parent 0.0 26.7 .106
Baseline Child 19.2 41.2 .168
Baseline Parent 16.0 40.0 .135
Follow-up Child 7.7 40.0 .084
No sidewalks or bike lanes
Follow-up Parent† 0.0 46.7 .008*
Baseline Child 7.7 17.6 .369
Baseline Parent 0.0 7.1 .359
Follow-up Child 0.0 13.3 .484
Route is boring
Follow-up Parent 0.0 0.0 N/A
Baseline Child 0.0 23.5 .019*
Baseline Parent 0.0 20.0 .046*
Follow-up Child 7.7 14.3 1.000
Route doesn’t have good lighting
Follow-up Parent 8.3 20.0 .605
Baseline Child 30.8 47.1 .343
Baseline Parent 24.0 66.7 .018*
Follow-up Child 23.1 60.0 .067
Too much traffic along the route
Follow-up Parent 41.7 60.0 .449
Baseline Child 15.4 41.1 .080
Baseline Parent 16.0 46.7 .035*
Follow-up Child 15.4 20.0 1.000
Too much traffic around home
Follow-up Parent 41.7 20.0 .398
Baseline Child 11.5 47.1 .014*
Baseline Parent 28.0 53.3 .177
Follow-up Child† 0.0 33.3 .044*
Too much traffic around the school
Follow-up Parent 54.5 46.7 1.000
Baseline Child 19.2 37.5 .281
Baseline Parent 36.0 66.7 .102
Follow-up Child 7.7 60.0 .006*
Dangerous crossings
Follow-up Parent 33.3 46.7 .484
Baseline Child 11.5 23.5 .407
Baseline Parent† 0.0 26.7 .015*
Follow-up Child 7.7 13.3 1.000
Get too hot and sweaty
Follow-up Parent 0.0 13.3 .487
Barriers Study period Respondent AT (%) IT (%) p
Baseline Child 3.8 6.3 1.000
Baseline Parent 0.0 20.0 .046*
Follow-up Child 0.0 13.3 .484
No other children walk or bike to school
Follow-up Parent 0.0 13.3 .492
Baseline Child 0.0 0.0 N/A
Baseline Parent 0.0 13.3 .135
Follow-up Child 0.0 0.0 N/A
Not considered cool to walk or bike
Follow-up Parent 0.0 6.7 1.000
Baseline Child 7.7 37.5 .038*
Baseline Parent† 4.0 42.9 .005*
Follow-up Child 0.0 40.0 .018*
Too much stuff to carry
Follow-up Parent 8.3 33.3 .182
Baseline Child 19.2 44.4 .098
Baseline Parent 16.0 42.9 .124
Follow-up Child 7.7 46.7 .038*
Easier to drive
Follow-up Parent 0.0 26.7 .106
Baseline Child 3.8 11.8 .552
Baseline Parent 8.3 20.0 .354
Follow-up Child 7.7 26.7 .333
Involves too much planning ahead
Follow-up Parent 0.0 20.0 .231
Baseline Child 7.7 29.4 .093
Baseline Parent 0.0 26.7 .015*
Follow-up Child 15.4 13.3 1.000
Unsafe because of crime
Follow-up Parent† 0.0 26.7 .106
Baseline Child 3.8 5.9 1.000
Baseline Parent 0.0 6.7 .375
Follow-up Child 7.7 6.7 1.000
Get bullied
Follow-up Parent 0.0 6.7 1.000
Baseline Child 3.8 17.6 .284
Baseline Parent 0.0 0.0 N/A
Follow-up Child 7.7 33.3 .173
Nowhere to leave a bike safely
Follow-up Parent 0.0 7.1 1.000
Baseline Child 4.0 5.9 1.000
Baseline Parent 0.0 0.0 N/A
Follow-up Child 7.7 6.7 1.000
There are stray dogs
Follow-up Parent 0.0 6.7 1.000
Baseline Child† 0.0 76.5 <.001*
Baseline Parent† 0.0 66.7 <.001*
Follow-up Child† 7.7 66.7 <.001*
It’s too far
Follow-up Parent† 0.0 53.3 .003*
AST if they perceived that the school is too far (p = .002), that there are dangerous crossings along the route (p = .006), that they have too much stuff to carry (p = .018), that it is easier for their parents to drive them (p = .038), and that there is too much traffic around the school (p = .044). Children were also less likely to engage in AST if their parent perceived that the school is too far (p = .003) and that there are no sidewalks or bike lanes along the route (p = .008). Only one child who perceived that the school is too far engaged in AST.
Table 4 shows the association between parental neighborhood selection factors and children’s travel mode at baseline and follow-up. At both time points, children were more likely to engage in AST if their parents indicated that they have chosen to live in their neighborhood because “it is easy for our children to walk or cycle to school” (p = .001 and .047 respectively). At follow-up, children were also more likely to engage in AST if their parents indicated that they have chosen to live in their neighborhood because “there are shops and restaurants you can walk or cycle to” (p = .036).
Table 4. Associations between parental neighborhood selection factors and child’s travel mode at baseline and follow-up
Neighborhood selection factors Study
period AT (%) IT (%) p Baseline 92.0 81.3 .362 We liked some aspects of its built
environment (street layout, the organization of buildings along the streets, the green spaces & parks, etc.)
Follow-up 91.7 92.9 1.000
Baseline 52.0 68.8 .344 We like some aspects of its social
environment, such as proximity to friends
and family Follow-up 66.7 71.4 1.000
Baseline 26.1 18.8 .711 It was one of the few neighborhoods we
could afford to live in Follow-up 16.7 28.6 .652
Baseline† 64.0 12.5 .001* It is easy for our child(ren) to walk or cycle to
school Follow-up 75.0 28.6 .047*
Baseline 66.7 75.0 .729 It is a convenient location with respect to
work Follow-up 83.3 64.3 .391
Baseline 84.0 68.8 .276 It is a convenient location with respect to our
household’s non-work activities, such as
shopping, exercise, parks, etc. Follow-up 91.7 64.3 .170 Baseline 64.0 43.8 .334 There are shops and restaurants you can
walk or cycle to Follow-up 91.7 50.0 .036*
The association between socio-demographic charecteristics of the household and children’s travel mode at baseline and follow-up is shown in Table 5. At baseline and follow-up, children attending school in denser areas were significantly more likely to engage in AST (p = .003 and p < .001 respectively). At follow-up only, children whose parents owned at least two cars were less likely to engage in AST (p = .006). Other socio-demographic characteristics were not associated with children’s travel mode at any time point. Because more than 95% of participants had access to a bicycle, this variable was omitted from the analyses.
Table 5. Associations between socio-demographic characteristics of the household and children’s travel mode at baseline and follow-up
Characteristic Categories Study Period AT (%) IT (%) P
Baseline 51.9 47.4 1.000
Child gender Girls vs. boys
Follow-up 61.5 46.7 .476 Baseline† 66.6 21.1 .003* School
neighborhood
Higher vs.
lower density Follow-up† 84.6 6.7 <0.001*
Baseline 46.1 43.8 1.000
Number of cars in
the household ≤ 1 vs ≥ 2 Follow-up† 69.2 14.3 0.006*
Baseline 88.5 81.3 .658
Family type 2 parents vs. others
Follow-up 92.3 93.3 1.000
Baseline 11.5 18.8 .658
Family size 1 children vs. others
Follow-up 15.4 13.3 1.000
Baseline 73.1 56.3 .322
Father’s education University vs. others
Follow-up 91.7 66.7 .182
Baseline 84.0 68.8 .276
Mother’s education University vs. others
Follow-up 100.0 86.7 .484
Baseline 96.2 86.7 .543
Father’s employment
Full time vs.
others Follow-up 100.0 93.3 1.000
Baseline 69.6 56.3 .503
Mother’s employment
Full time vs.
others Follow-up 61.5 71.4 .695
The percentage of individuals with the referent categories mentioned in the 2nd column was compared between active travelers (AT) and inactive travelers (IT) with Fisher’s exact test (eg, at baseline, 51.9% of active travelers were girls; implying that the remaining 48.1% were boys). * Indicates significant differences (p < .05). † denotes sufficient statistical power34.
Discussion
Concordance of child- and parent-perceived barriers to AST. In general, children’s and parents’ perceptions of barriers to AST were significantly correlated at baseline. Using the same instrument, Forman et al30 reported high intraclass correlation coefficients between adolescent and parent reports, but they combined survey items in three subscales instead of examining agreement for each barrier separately. Another study in the US found good agreement between children and parent reports, except within less walkable neighborhoods where parents expressed greater concerns.16
However, at follow-up significant correlations were found for only four of 19 questionnaire items. Because follow-up data collection occured only a few weeks after participants started secondary school, it is possible that children and/or their parents were less familiar with the route to/from school and the school surroundings. This novelty aspect may have biased the comparisons toward the null hypothesis. It is also worth emphasizing that there was sufficient power for 12 items at baseline, but only two at follow-up. Nevertheless, at both time points, the concordance was generally higher for the distance and road safety components and most of these components were associated with children’s travel mode. To our knowledge, no other study has assessed how the concordance between child- and parent-perceived barriers changes from primary to secondary school, underscoring a need for future research on this topic.
Associations between perceived barriers and AST. In the present study, the strongest perceived barrier to AST was the distance between home and school as perceived by both children and parents. Moreover, in the sub-sample of participants who provided travel mode data at both time points, the average distance increased upon the transition from primary to secondary school while the mode share of AST decreased significantly.28 These longitudinal findings are consistent with cross-sectional studies comparing the mode share of AST between primary, middle school, and high school students in Canada24,36 and the United States.20,23 In addition, data from the US National Household Travel Survey suggest that a 10% increase in distance is associated with a 7.5% decrease in the mode share of walking.10 Finally, a systematic review of the relationship between objectively-measured environmental factors and AST found that distance was the only consistent correlate.12
perceived the absence of sidewalks and cycle paths as a barrier was consistently greater among the inactive travelers, but this relationship was only significant at follow-up among parents. This might be an artifact of the small sample size and low statistical power. In the published literature, several studies have found that perceived road safety was an important barrier to AST.37-40 In addition, an Australian study that examined the predictors of increasing AST found that when parents perceived that there were not enough traffic lights and pedestrian crossings in their neighborhood, children were half as likely to begin walking or cycling to school.41 Nevertheless, conflicting findings have also been reported with respect to the association between road safety elements and AST.14,42
The perception of having too much stuff to carry was associated with inactive travel at baseline and follow-up. This element was mentioned as an important barrier in a qualitative study,43 although it has not been assessed often in quantitative studies. Technology could help to reduce backpack loads (ie, using USB sticks and tablets instead of heavy textbooks). Another possibility would be to equip bikes with racks and panniers to avoid the need for carrying heavy loads on one’s back.44
At baseline only, parents’ crime-related concerns were associated with motorized travel; however, there were no associations between
children’s personal safety concerns and travel mode at any time point. The lack of concordance in this regard warrants future investigation.
Nevertheless, it is noteworthy that a literature review has reported
inconsistent evidence regarding the relationship between personal safety aspects (eg, “stranger danger,” crime, bullying) and AST among both children and parents.9 Given the higher rates of AST among children living in low SES neighborhoods (which also tend to have higher crime rates), SES might be an important confounding variable.45,46
sample size may explain why such associations were not found in the present study.
In her theoretical framework, McMillan8 assumed that parents are the key decision-makers regarding their children’s mode of transport. However, more recent frameworks posit that as children become older, they likely have a greater input into this decision.9,13 This assumption is consistent with the observation that independent mobility (eg, the degree of freedom of children and youth to move around in public spaces without adult supervision) increases with age.49 In turn, independent mobility is associated with greater AST and PA levels.50,51 Another study has shown that Canadian adolescents who have some input in the decision making process are more likely to engage in AST,52 and an American study indicated that although children- and parent-perceived barriers were correlated, they were still independently associated with the frequency of walking trips.16 Together, this body of evidence emphasizes the need to consider both child- and parent-perceived barriers to AST. Similarly, future research should examine how these perceived barriers change over time among both parents and children to inform the development of more effective AST interventions.
Parental neighborhood selection factors. At both time points, children were significantly more likely to engage in AST when their parent reported that they chose to live in their neighborhood so that their children could easily walk or cycle to school. Another study in the Greater Toronto Area found that children were less likely to be driven to school if their parents reported that they had chosen to live in their neighborhood so that their children can walk to school.19 In addition, children were more likely to engage in AST at follow-up if their parents chose their neighborhood for the proximity of parks and restaurants. Perceived proximity to such destinations has been shown to be associated with higher physical activity levels in children and youth.53 Our findings provide preliminary evidence suggesting that parental neighborhood selection factors can influence their child’s travel modes. Future studies could use a design similar to Frank et al17 to attempt to disentangle the relative influence of self-selection and built environment characteristics.
Nevertheless, there is conflicting evidence with respect to the association between density and AST in the literature.12 This may be due to inconsistencies in methodology12, to the indirect effect of density (eg, mediated by distance8), to a ceiling effect (eg, beyond a certain level, increasing density may have no effect on AST), or because denser areas may be associated with greater traffic exposure and safety concerns.54 Density may be less salient when a large proportion of children do not attend a school within their neighborhood as seems to be the case for the participants who attended primary schools in lower density areas. Moreover, differences in AST between school neighborhoods could also be due to other characteristics of the built environment and to school policies that may favor AST to a greater extent in these schools.
Parents’ car ownership was the only other socio-demographic variable that was associated with children’s travel mode, but this association was found only at follow-up. Specifically, children were almost five times less likely to engage in AST when their parents owned at least two cars. However, only two families did not own a car so they were combined with those that owned one car in analyses. Moreover, children who traveled by car and bus were combined in the analyses; this has likely biased the results toward the null hypothesis. This could explain why our findings differ from those of DiGuiseppi et al,25 who reported that British children were much more likely to be driven to school by their parents if they owned at least one car, and the odds were even greater when parents owned two cars. Presumably, higher car ownership makes the option of driving children to/from school more feasible.
The lack of association for the other socio-demographic variables might be due to the small sample size and to the limited variability of these characteristics in the sample (eg, the majority of parents had university education and almost all fathers worked full time). Therefore, these findings should be interpreted cautiously. North American studies have generally found higher rates of AST in children living in low SES households,21,23,24,45 in single-parent families,24 and in boys.20-22
associated with a significant increase in distance and a marked decrease in the mode share of AST. Based on data from the National Household Travel Survey, McDonald8 estimated that only 20% of US students lived within 1.6 km (1 mile) from their school and argued that this situation greatly reduces the potential effectiveness of Safe Routes to School interventions. To address this issue, a recent policy statement from the American Academy of Pediatrics56 recommended that consideration be given to children’s ability to engage in AST in the process of determining the location of new schools.
Policies can also be implemented to address some of the road safety barriers identified in the present study and in other investigations. For example, walking school buses can reduce parental safety concerns and foster AST and physical activity.57,58 US schools located in states where crossing guards are required and in school districts with strong Safe Routes to School policies were more likely to implement walking school buses.59
In another US study, investigators asked the principals of over 600 schools to estimate the proportion of students who engaged in AST and collected information on state transportation laws.60 They found that more children engaged in AST in states that required the presence of crossing guards and lower speed limits around schools. In London (UK), the implementation of 32 km/h (20 mph) speed limits has led to a 49% decrease in road casualties among children.61 In addition, an evaluation of the California Safe Routes to School legislation has shown that urban form changes such as adding or improving sidewalks, traffic lights, pedestrian crossings, and bike paths can lead to an increase in AST.62 In New York City, a 44% decrease in pedestrian injuries among school-aged children was observed in census tracts where Safe Routes to School interventions had been implemented while no changes were observed in control census tracts.63
are related to changes in travel modes because of the even smaller number of participants who changed travel modes. Future studies should address this research gap to inform the development and refinement of AST interventions. Third, although walking and cycling may have distinct correlates, it was unfeasible to assess the correlates separately. Fourth, analyses were not adjusted for gender and other potential confounders (ie, school, SES, car ownership). Such variables could moderate (or mediate) the relationship between perceived barriers and children’s AST.9 However, the mode share of AST did not differ between boys and girls in the present study. Finally, the low participation rate and the large proportion of parents who were university graduates suggest that the sample may not be representative of the Canadian population. Approval from school principals was mandatory before proceeding with data collection, and all primary schools that granted approval were included in the study. This may have led to a greater participation of schools located in higher SES neighborhoods. The longitudinal study design, and the school board requirement that incentives cannot be offered to participants, may have contributed to the low participation rate.
Nevertheless, the present study has important strengths. Of particular interest, the association between children’s travel mode and perceived barriers to AST was examined at the end of primary school and the beginning of secondary school among the same group of participants. Second, no other study has systematically compared the concordance between child- and parent-perceived barriers to AST before and after the school transition. Third, a wide variety of potential correlates of AST were considered, many of which have not been studied extensively. Furthermore, while several prospective studies have shown large decreases in physical activity levels from childhood to adolescence,26 little is known about the influence of the school transition on AST. Only two studies have examined this question longitudinally28,65 and both reported a substantial decrease in the mode share of AST.
Conclusion
References
1. de Nazelle A, Nieuwenhuijsen MJ, Anto JM, et al. Improving health through policies that promote active travel: a review of evidence to support health impact assessment. Environ Int. 2011;37(4):766-777.
2. Larouche R. The environmental and population health benefits of active transport: a review. In: Liu G ed. Greenhouse Gases – Emissions, Measurement and Management. Rijeka, Croatia: InTech; 2012:413-440.
3. Sallis JF, Cervero RB, Ascher W, Henderson KA, Kraft MK, Kerr J. An ecological approach to creating active living communities. Annu Rev Public Health, 2006;27:297-322.
4. van der Ploeg HP, Merom D, Corpuz G, Bauman AE. Trends in Australian children traveling to school 1971-2003: burning petrol or carbohydrates? Prev Med. 2008;46(1):60-62.
5. Buliung RN, Mitra R, Faulkner G. Active school transportation in the Greater Toronto area, Canada: an exploration of trends in space and time (1986-2006). Prev Med. 2009;48(6):507-512.
6. McDonald NC. Active transportation to school: trends among US schoolchildren 1969-2001. Am J Prev Med. 2007;32(6):509-516. 7. Chillon P, Evenson KR, Vaughn A, Ward DS. A systematic review
of interventions for promoting active transportation to school. Int J Behav Nutr Phys Act. 2011;8:10.
8. McMillan TE. Urban form and a child’s trip to school: the current literature and a framework for future research. J Planning Literature. 2005;19(4):440-456.
9. Panter JR, Jones AP, van Sluijs EMF. Environmental determinants of active travel in youth: a review and framework for future research. Int J Behav Nutr Phys Act. 2008;5:34.
10. McDonald NC. Children’s mode choice for the school trip: the role of distance and school location in walking to school. Transportation. 2008;35:23-35.
11. Nelson NM, Foley E, O’Gorman DJ, Moyna NM, Woods CB. Active commuting to school: how far is too far? Int J Behav Nutr Phys Act. 2008;5(1).
12. Wong BYM, Faulkner G, Buliung R. GIS measured environmental correlates of active school transport: a systematic review of 14 studies. Int J Behav Nutr Phys Act. 2011;8(39).
factors influencing children’s active travel. Aust Occup Ther J. 2011;58:138-144.
14. Timperio A, Crawford D, Telford A, Salmon J. Perceptions about the local neighborhood and walking and cycling among children.
Prev Med. 2004;38(1):39-47.
15. Timperio A, Ball K, Salmon J, et al. Personal, family, social, and environmental correlates of active commuting to school. Am J Prev Med. 2006;30(1):45-51.
16. Napier MA, Brown BB, Werner CM, Gallimore J. Walking to school: community design and child and parent barriers. J Environ Psychol. 2011;31(1):45-51.
17. Frank LD, Saelens BE, Powell KE, Chapman JE. Stepping towards causation: do built environments or neighborhood and travel preferences explain physical activity, driving, and obesity? Soc Sci Med. 2007;65:1898-1914.
18. Handy S, Cao X, Mokhtarian P. Self-selection in the relationship between the built environment and walking: Empirical evidence from Northern California. J Am Plan Assoc. 2006;72(1): 55-74. 19. Mammen G, Faulkner G, Buliung R, Lay J. Understanding the drive
to escort: a cross-sectional analysis examining parental attitudes toward children’s school travel and independent mobility. BMC Public Health. 2012;12:862.
20. Fulton JE, Shisler JL, Yore MM, Caspersen CJ. Active transportation to school: Findings from a national survey. Res Q Exerc Sport. 2005;76(3):352-357.
21. GroppK, Pickett W, Janssen I. Multi-level examination of correlates of active transportation to school among youth living within 1 mile of their school. Int J Behav Nutr Phys Act. 2012;9:124.
22. McMillan T, Day K, Boarnet M, Alfonzo M, Anderson C. Johnny walks to school – does Jane? Sex differences in children’s active travel to school. Child Youth Environ. 2006;16(1):75-89.
23. Evenson KR, Huston SL, McMillen BJ, Bors P, Ward DS. Statewide prevalence and correlates of walking and bicycling to school. Arch Pediatr Adolesc Med. 2003;157(9):887-892.
24. Pabayo R, Gauvin L, Barnett TA. Longitudinal changes in active transportation to school in Canadian children aged 6 through 16 years. Pediatrics. 2011;128(2):e404-413.
26. Dumith SC, Gigante DP, Domingues MR, Kohl III HW. Physical activity change during adolescence: a systematic review and a pooled analysis. Int J Epidemiol. 2011;40:685-698.
27. Environmental Protection Agency. Travel and environmental implications of school siting. Washington, DC: Environmental Protection Agency; 2003.
28. Larouche R, Faulkner G, Tremblay MS. Assessing the influence of the transition from primary to secondary school on the volume of active school transport and physical activity: a prospective pilot-study. Bioenergetics. 2013;2(105).
29. Statistics Canada. Census tract profiles, 2006 Census. Ottawa, ON: Statistics Canada.
http://www12.statcan.ca/census-recensement/2006/dp-pd/prof/92-597/index.cfm?Lang=E. Accessed
January 29, 2013.
30. Forman H, Kerr J, Norman GJ, et al. Reliability and validity of destination-specific barriers to walking and cycling. Prev Med. 2008;46(4):311-316.
31. Curriero FC, James NT, Shields TM, et al. Exploring Walking Path Quality as a Factor for Urban Elementary School Children's Active Transport to School. J Phys Act Health. 2013;10:323-334.
32. Panter JR, Jones AP, Van Sluijs EMF, Griffin SJ. Neighborhood, route, and school environments and children’s active commuting.
Am J Prev Med. 2010;38(3):268-278.
33. Fisher RA. On the interpretation of X2 from contingency tables, and the calculation of P. J Royal Stat Soc. 1922;85(1):87-94.
34. Cohen J. Statistical power analysis for the behavioral science. 2nd ed. Lawrence Erlbaum: Hillsdale, NJ; 1988.
35. Statistics Canada. Educational attainment and employment: Canada in an international context. Ottawa, ON: Statistics Canada;
http://www.statcan.gc.ca/pub/81-599-x/81-599-x2012008-eng.pdf
Accessed January 31, 2013.
36. Pabayo R, Gauvin L. Proportion of students who use various modes of transportation to and from school in a representative population-based sample of children and adolescents, 1999. Prev Med. 2008;46(1):63-66.
37. Carver A, Timperio A, Crawford D. Playing it safe: the influence of neighbourhood safety on children’s physical activity. A review.
Health Place. 2008;14(2):217-227.
39. Martin S, Carlson S. Barriers to children walking to or from school – United States, 2004. Morb Mortal Wkly Rep. 2005;54:949-952. 40. Voorhees CC, Ashwood S, Evenson KR, et al. Neighborhood
design and perceptions: relationship with active commuting. Med Sci Sports Exerc. 2010;41(7):1253-1260.
41. Hume C, Timperio A, Salmon J, et al. Walking and cycling to school: predictors of increase among children and adolescents. Am J Prev Med. 2009;36(3):195-200.
42. Carson V, Kuhle S, Spence JC, Veugelers PJ. Parent’s perception of neighborhood environment as a determinant of screen time, physical activity and active transport. Can J Public Health. 2010;101(2):124-127.
43. Ahlport KN, Linnan L, Vaughn A, Evenson KR, Ward DS. Barriers to and facilitators of walking and bicycling to school: formative results from the non-motorized travel study. Health Educ Behav. 2008;35(2):221-244.
44. Lovejoy K, Handy S. Developments in bicycle equipment and its role in promoting cycling as a travel mode. In J. Pucher and R. Buehler, eds. City Cycling (pp. 75-104.). Cambridge, MA: Massachusetts Institute of Technology Press; 2012.
45. Pabayo R, Gauvin L, Barnett TA, Morency P, Nikiéma B, Séguin, L. Understanding the determinants of active transportation to school among children: evidence of environmental injustice from the Quebec Longitudinal Study of Child Development. Health Place, 2012;18(2):163-171.
46. Rossen LM, Pollack KM, Curriero FC, et al. Neighborhood incivilities, perceived neighborhood safety, and walking to school among urban-dwelling children. J Phys Act Health. 2011;8(2):262-271.
47. Faulkner GEJ, Richichi V, Buliung RN, Fusco C, Moola F. What’s “quickest and easiest?”: parental decision making about school trip mode. Int J Behav Nutr Phys Act. 2010;7(62).
48. McDonald NC, Aalborg AE. Why parents drive children to school: Implications for Safe Routes to School programs. J Am Plan Assoc. 2009;75(3):331-342.
49. Hillman M, Adams J, Whitelegg J. One false move: A study of children’s independent mobility. London: PSI Publishing; 1990. 50. Page A, Cooper AR, Griew P, Jago R. Independent mobility,
51. Schoeppe S., Duncan MJ, Badland H, Oliver M, Curtis C. Associations of children’s independent mobility and active travel with physical activity, sedentary behaviour and weight status: a systematic review. J Sci Med Sport. 2013;16(4):312-319.
52. Wong BYM, Faulkner G, Buliung R, Irving, H. Mode shifting in school travel mode: examining the prevalence and correlates of active school transport in Ontario, Canada. BMC Public Health. 2011;11:618.
53. Ding DG, Sallis JF, Kerr J, Lee S, Rosenberg DE. Neighborhood environment and physical activity among youth: a review. Am J Prev Med. 2011;41(4):442-455.
54. Giles-Corti B, Kelty SF, Zubrick SR, Villanueva KP. Encouraging walking for transport and physical activity in children and adolescents: how important is the built environment? Sports Med. 2009;39(12):995-1009.
55. Council of Educational Facility Planners International. Guide for planning educational facilities. Council of Educational Facility
Planners International, Scottsdale, AZ; 1991.
http://eric.ed.gov/?id=ED344336 Accessed November 25, 2013.
56. American Academy of Pediatrics. The built environment: designing communities to promote physical activity in children. Pediatrics. 2009;123(6):1591-1598.
57. Heelan KA, Abbey BM, Donnelly JE, Mayo MS, Welk GJ. Evaluation of a walking school bus for promoting physical activity in youth. J Phys Act Health. 2009;6(5):560-567.
58. Mendoza JA, Watson K, Baranowski T, Nicklas TA, Uscanga DK, Hanfling MJ. The walking school bus and children’s physical activity: a pilot cluster randomized controlled trial. Pediatrics. 2011;128(3):e537-e544.
59. Turner L, Chriqui J, Chaloupka F. Walking school bus programs in U.S. public elementary schools. J Phys Act Health. 2013;10:641-645.
60. Chriqui JF, Taber DR, Slater SJ, Turner L, Lowrey KM, Chaloupka FJ. The impact of state safe routes to school-related laws on active travel to school policies and practices in U.S. elementary schools.
Health Place. 2012;18(1):8-15.
61. Grundy C, Steinbach R, Edwards P, Green J, Armstrong B, Wilkinson P. Effect of 20mph traffic speed zones on road injuries in London, 1986-2006: controlled interrupted time series analysis.
62. Boarnet M, Anderson CL, Day K, McMillan T, Alfonzo M. Evaluation of the California Safe Routes to School legislation: urban form changes and children’s active transportation to school. Am J Prev Med. 2005;28(Suppl. 2):134-140.
63. DiMaggio C, Li G. Effectiveness of a Safe Routes to School program in preventing school-aged pedestrian injury. Pediatrics. 2013;131:290-296.
64. Altman DG, Bland JM. Statistics note: Absence of evidence is not evidence of absence. BMJ. 1995;311:485.
65. Cooper AR, Jago R, Southward EF, Page AS. Active travel and physical activity across the school transition: the PEACH project.