www.ijaer.in Copyright © IJAER 2016, All right reserved Page 424
EVALUATION OF LOW NITROGEN TOLERANCE IN RICE
GENOTYPES USING STRESS TOLERANCE INDICES
Angelita Puji Lestari1, Suwarno2, Trikoesoemaningtyas3,
Didy Sopandie3, Hajrial Aswidinnoor3*
1Student at Graduate School of Department of Agronomy, Faculty of Agriculture, Bogor Agricultural University, Darmaga, Bogor 16680. West Java, Indonesia
Telp./Fax. +62251-8350713, email: [email protected]
2Muara Experimental Farm, Indonesian Center for Rice Research, Jl. Raya Ciapus 25A, Bogor. West Java, Indonesia Telp./Fax. +62251-8350713.
email: [email protected]
3Department of Agronomy, Faculty of Agriculture, Jl. Meranti. Bogor Agricultural University, Darmaga, Bogor 16680, West Java, Indonesia.
Telp/fax. +62251-8629353, email: [email protected]
ABSTRACT
Nitrogen (N) is one of the most important nutrient for plant growth. Low N condition is ussually occur because its character which easily eliminate from the soil. Thirty-eight rice genotypes were evaluated under low N and optimum N environments. The experiment was conducted at Muara Experimental Farm Bogor, Indonesia using augmented design with three replicates under low N (34.5 kg N ha-1) and optimum N (138 kg N ha-1). Seven selection indices for stress tolerance
www.ijaer.in Copyright © IJAER 2016, All right reserved Page 425
significant correlation of Ys and Yp with MP, GMP, and STI concluded that these indices were the best predictors of yield under low N and optimum N environments.
Keywords: rice, grain yield, low N, stress indices
INTRODUCTION
Grain yield in rice plant commonly affected by less nitrogen (N) nutrient in the soil due to its caharters that easy to leaching, Less N conditions is common in all regions due to volatilization (Zhong-cheng et al. 2012), denitrification, timing and placement of fertilizer, leaching, run-off, and absorbed by plants (Choudury and Kenedy, 2005) or recovered in crop about 22%–30% of the applied N (Mei-hua et al. 2012).that easy to remove by nature or harvest plant. It is unconscious that tolerant rice variety in poor-nitrogen soil or have nitrogen use efficiency is necessary.
Selection under environmental stress condition is required for exploiting genetic variations to improve stress tolerant genotypes (Reynolds and Borlaug 2006; Le Gouis et al. 2000; Ortiz et al. 2008). However, other researcher stated that in order to develop tolerant cultivars, the selection program should be conducted under strees condition too (Presterl et al. 2003; Galais and Coque2005).In this experiment we had selected some population crossed between high yielding varieties with local varieties to obtain new cultivars which using N efficiently. The genotypes resulted form selection then evaluated for low N tolerance using different stress tolerance indices.
www.ijaer.in Copyright © IJAER 2016, All right reserved Page 426
and stress non-stress production index (SNPI) to identify relatively tolerant (through ATI and SSPI) and resistant (through SNPI) genotypes under nonirrigatedand irrigated conditions.For selection based on acombination of indices, some researchers have used principal component analysis (PCA), a biplot as a better approach than a simple correlationanalysis is necessary to identify superior genotypes for both stress and non-stress conditions (Amiri et al. 2014). Jalilvandy and Rozrokh (2013) stated that selection of genotypes with low PC1 and high PC2 are suitable for both stress and non-stress environments. Our experiment aimed to evaluate of low nitrogen tolerance in rice genotypes using stress tolerance indices.
MATERIALS AND METHODS
A field experiment was carried out at Muara Experimental Farm Bogor, Indonesia and 200 m above sea level. The soil of the field is latosol. Thirty-eight rice genotypes were evaluated under low N (34.5 kg N ha -1) and optimum N (138 kg N ha –1)environments.This experiment used
augmented design with three replications.Grain yield were recorded from 5 m2 plot for each rice
genotypes and converted as t ha-1. The data were analyzed using Microsoft Excel and Minitab
software. A biplot derived from principal component analysis (PCA) based on the two-way data of selection criteria(low N tolerant indices) was conductedusing Minitab software. PCA was calculated to analyze relationships among selection criteria,to compare genotypes on the basis of low N tolerance indices. The tolerance indices were calculated as follows:
Tolerance (TOL) = Yp - Ys
Mean productivity (MP) = 𝑌𝑝+𝑌𝑠
2
Geometric mean productivity (GMP) = √𝑌𝑝 𝑥 𝑌𝑠
Stress susceptible index (SSI)= (1− 𝑌𝑠 𝑌𝑝) (1− 𝑌𝑝̅̅̅̅𝑌𝑠̅̅̅̅
Stress tolerance index (STI) = 𝑌𝑝 𝑥 𝑌𝑠
𝑌𝑝 ̅̅̅̅2
Yield stability index = 𝑌𝑠
𝑌𝑝
www.ijaer.in Copyright © IJAER 2016, All right reserved Page 427
RESULTS
Analysis of variance and genotypes performace
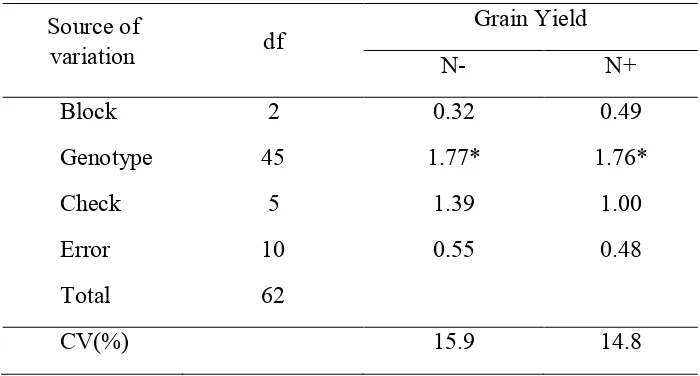
The result of analysis of variance for grain yield under N suboptimum and N optimum environments are presented in Table 1. Mean squares for combine analysis of variance indicated significant differences among all genotypes for yield (P<0.05). It revealed significant variation due to genotypes for grain yield in two different N environments. Check indicated non-significant differences or expected has a stable grain yield under those two N environments.
Table 1. Analysis of variance showing mean square for yield in rice lines under N suboptimum (N-) dan N optimum (N+) environments.
Source of
variation df
Grain Yield
N- N+
Block 2 0.32 0.49
Genotype 45 1.77* 1.76*
Check 5 1.39 1.00
Error 10 0.55 0.48
Total 62
CV(%) 15.9 14.8
*=significant at p<0.05
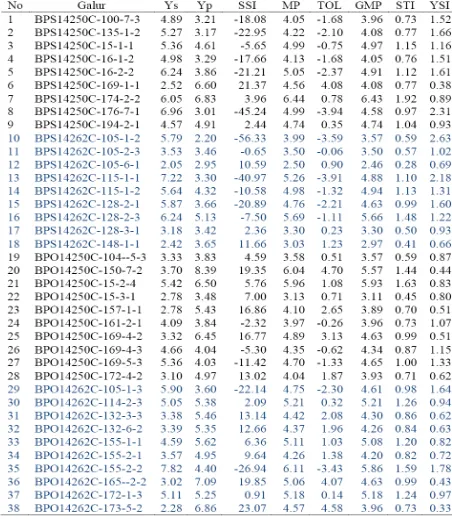
Tolerance indices were calculate on the basis of the genotypes (Table 2). Genotypes showed wide range variations for the estimated indices. The mean yield of genotypes under low N environment varied from 2.05 to 7.82 t ha-1, while mean of yield genotype under optimum N
environment varied from 2.20 to 8.39 t ha-1. The genotypes 35, 13, 8, 16, and 5had the best
www.ijaer.in Copyright © IJAER 2016, All right reserved Page 428
22, 18, and 12 were the least. For SSI the desirable low N tolerant genotypes were 38, 6, and 36 and the leas relative tolerant were 10, 8, and 13. According to TOL the 20, 38, and 6 were the tolerant and 10, 13, and 8 were the least and for YSI the tolerant genotypes were 10, 8, and 13 whereas 36, 6, and 38 were the least rekative tolerant.
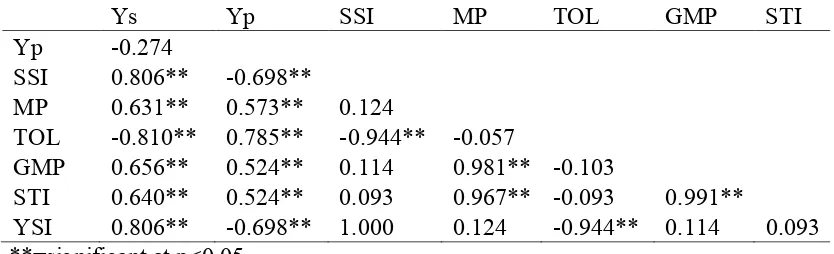
Correlation between grain yield and indices.
To determine the most desirable tolerance criteria the correlation coefficient between quantitative low N tolerance indices to Ys and Yp were calculated (Table 3). tolerance indices (SSI, MP, TOL, GMP, STI, and YSI), while SSI showed high negative correlation. MP and TOL showed the highest coefficients of correlation. Similar results were observed with Ys against SSI, MP, TOL, GMP, STI, and YSI but TOL were highly negative correlated to Ys, while the most closely correlated to Ys were SSI and YSI. MP was the strongly correlated index to Yp and highly correlated to Ys.
Table 2. The correlation coefficient between Ys and Yp with various N tolerance indices
**=significant at p<0.05
Highly significant and positive correlation were observed among each pair of MP, GMP, TOL, and STI (P<0.05). The correlation between Yp and either SSI and YSI was significant and negative.TOL had negatively significant correlated with SSI and YSI. Both Yp and Ys was significantly positive correlation with MP, GMP, and STI. This indicates that these indices were more effective in identifying high yielding lines under low N as well as optimum Nenvironments.
Ys Yp SSI MP TOL GMP STI Yp -0.274
SSI 0.806** -0.698**
MP 0.631** 0.573** 0.124
TOL -0.810** 0.785** -0.944** -0.057
GMP 0.656** 0.524** 0.114 0.981** -0.103
STI 0.640** 0.524** 0.093 0.967** -0.093 0.991**
www.ijaer.in Copyright © IJAER 2016, All right reserved Page 429
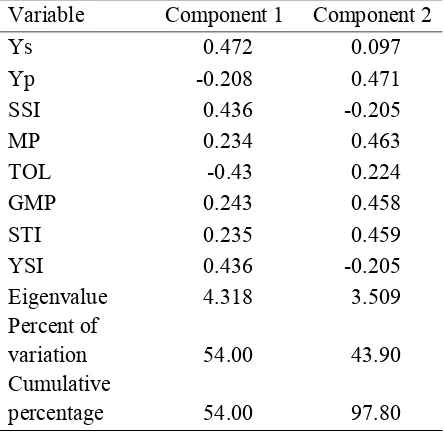
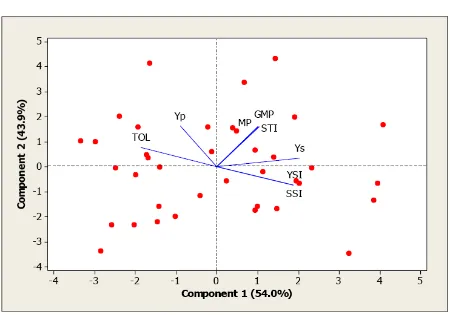
Principal component analysis
In order to asses the relationship between all tolerance indices to identify superior genotypes at once, we used the principal component analysis (Table 3). The first and second components justified 54.00% and 43.90%, respectively and accounted for 97.8% of total variation.
Results demonstrated that there is had positive and high significant correlations with yield in low N conditions (Ys) with some indices such as YSI and SSI, but those YSI and SSI components had negative correlation with TOL (Figure1). Also a high and significant positive correlation was observed between Mp, GMP, and STI.
Table 3. Principal component analysis Ys, Yp and low N tolerance indices of rice lines
Variable Component 1 Component 2
Ys 0.472 0.097
Yp -0.208 0.471
SSI 0.436 -0.205
MP 0.234 0.463
TOL -0.43 0.224
GMP 0.243 0.458
STI 0.235 0.459
YSI 0.436 -0.205
Eigenvalue 4.318 3.509
Percent of
variation 54.00 43.90
Cumulative
percentage 54.00 97.80
Relationship between grain yield and indices
Linear regression revealed that coefficients of determination between Ys and the tolerance indices were R2
STI/Ys = 0.4091, R2GMP/Ys = 0.4297, R2YSI/Ys = 0.649 and R2MP/Ys = 0.389 (Figure 2).
These result revealed that YSI index may be consideredthe best predicate to explain grain yield variations under low N condition. However, relationship between Ys and TOL and SSI were negatively significant with coefficient determination were R2
TOL/Ys= 0.6569 and R2SSI/Ys= 0.649,
www.ijaer.in Copyright © IJAER 2016, All right reserved Page 430
www.ijaer.in Copyright © IJAER 2016, All right reserved Page 431
Figure 1. Principal component analysis of stress tolerance indices
DISCUSSION
www.ijaer.in Copyright © IJAER 2016, All right reserved Page 432
www.ijaer.in Copyright © IJAER 2016, All right reserved Page 433
Figure 2. Relationship between grain yield in low N condition (Ys) and (a) stress tolerance index (STI), (b) geometric mean productivity (GMP), (c) yield stability index, and (d) stress
tolerance (TOL), (e) mean productivity (MP) dan (f) stress susceptability index (SSI).
indicating that these indices are suitable criteria for screening tolerant genotypes. In the other hand, if there no significant correlation then they can be discarded as the desirable markers for identifying drought tolerant genotypes (Farshadfar et al. 2012). If no significant correlation between yield under non-stress with tolerant indices indicating that those indices were not good indicators to identify the genotype with high yield potential (Aliakbari et al. 2014).
Results showed that MP, TOL, GMP, and STI had positive correlation with yield production under optimum N condition, but TOL negatively correlated with yield under low N. This suggested that selection based on low TOL values will reduced grain yield under optimum N environment (Sio-Se Mardeh et al. 2006; Talebi et al. 2009). Golabadi et al. (2006) reported that selection for TOL will be worthwhile only when the target environment is no-drought stressed. Yp and
Ys had positive and significant correlation with MP, STI, and GMP. These results may advise MP, STI and GMP to bethe best predicates for both conditions. SSI, TOL and YSI showed disparity against Ys and Ypindicating the population segregated for genes conditioning yield potential and low Ntolerance. These result was in line withAli and El-Sadek (2016), Talebi et al. (2009),Mohammadi et al. (2012), Ganjeali et al. (2011) and Sio-Se Mardeh et al. (2006).Majidi et al. (2011) reported that GMP and STI indices were similarly able to separate drought sensitive and tolerant genotypes of safflower in both mild and intense water stress environments. Pireivatlou et al. (2010) was also notedthat STI it self can be a reliable index for selecting high yielding genotypes.
www.ijaer.in Copyright © IJAER 2016, All right reserved Page 434
(2014) and Yarnia et al. (2011) used biplot analysis to disciminate high yielding wheat, barley, and rapeseed genotypes, respectively, of which were highly adapted to stress conditions.
CONCLUSION
There were significant variations due to genotypes for grain yield in two N environments. PCA analysis showed that te first PCA explained 54.0% of the variation with YSI, SSI, MP, GMP, and STI.Principal component analysis indicated that the first two components accounted for more than 97% of the total variationsfor drought tolerant indices.Positive and significant correlation of Ys and Yp with MP, GMP, and STI concluded that these indices were the best predictors of yield under low N and optimum N environments.
REFERENCES
Ali MB, El-Sadek AN. 2016. Evaluation of drought tolerance indices for wheat (Triticum aestivum L.) under irrigated and rainfed conditions Comm in Biometry And Crop Science 11(1):77–89.
Aliakbari M, Razi H, Kazemeini SA. 2014. Evaluation of drought tolerance in rapeseed (Brassicanapus l.) cultivars using drought tolerance indices. Int J Adv Biol Biom Res.2(3):696-705.
Amiri R, Bahraminejad S, Sasani Sh, Ghobadi M. 2014. Genetic evaluation of 80 irrigated bread wheat genotypes for drought tolerance indices.Bulgarian Journal of Agricultural Science 20(1):101-111.
Bahari N, Bighdilu BB, karpisheh L. 2013. Evaluation of drought tolerance of bread wheat genotypes by stress and sensitivity tolerance indices.Annals of Biological Research 4(1):43-47.
Choudhury ATMA, Kennedy IR. 2005. Nitrogen fertilizer losses from rice soils and control of environmental pollution problems. Comm in Soil Sci and Plant Analysis 36:1625–1639. Farshadfar E, Jamshidi B, Aghaee M. 2012. Biplot analysis of drought tolerance indicators in
bread wheat lanraces of Iran. Intl J Agri Crop Sci. 4(5):226-233.
Gallais A, Coque M. 2005. Genetic variation and selection for nitrogen use efficiency in maize: a synthesis. Maydica 50: 531-537.
Ganjeali A, Porsa H, Bagheri A. 2011. Assessment of Iranian chickpea (Cicer arietinum L.) germplasms for drought tolerance. Agricul Water Management 98:1477–1484. doi:10.1016/j.agwat.2011.04.017.
www.ijaer.in Copyright © IJAER 2016, All right reserved Page 435
Khan AA, Kabir MR. 2014. Evaluation of spring wheat genotypes (Triticum aestivum L.) for heat stress tolerance using different stress tolerance indices. Cercetari Agronomice in Moldova 57(4):49-63.
Khakwani AA, Dennett MD, Munir M. 2011. Drought tolerance screening of wheat varieties by inducing water stress conditions. Songklanakarin J Sci Technol. 33:135-142.
Le Gouis J, Beghin D, Heumez E, and Pluchard P. 2000. Genetic differences for nitrogen uptake and nitrogen utilization efficiencies in winter wheat. European Journal of Agronomy 12: 163–173.
Majidi MM, Tavakoli V, Mirlohi A, Sabzalian MR. 2011. Wild safflower species (Carthamus oxyacanthus Bieb.): A possible source of drought tolerance for arid environments. AJCS 5(8):1055-1063.
Mei-Hua, D., Xiao-Jun, S., Yu-Hua, T., Bin, Y., Shao-Lin, Z., Zhao-Liang, Z. and Kimura, S.D. 2012. Optimizing Nitrogen Fertilizer Application for Rice Production in the Taihu Lake Region, China. Pedosphere 22(1): 48–57.
Mohammadi S, Janmohammadi M, Javanmard A, Sabaghnia N, Rezaie M, Yezdansepas A. 2012. Assessment of drought tolerance indices in bread wheat genotypes under different sowing dates. Cercetări Agronomice în Moldova 3(151):25-39.
Moosavi SS, Samadi BY, Naghavi MR, Zali AA, Dashti H, Pourshahbazi A. 2008. Introduction of new indices to identify relative drought tolerance and resistance in wheat genotypes. Desert 12:165-178.
Ortiz R, Braun H, Crossa J, Crouch JH, Davenport G, Dixon J, Dreisigacker S, Duveiller E, He Z, Huerta J.2008. Wheat genetic resources enhancement by the international maize and wheat improvement center (CIMMYT). Genet Resour Crop Evol55: 1095-1140.
Pireivatlou AS, Masjedlou BD. Aliyev RT. 2010. Evaluation of yield potential and stress adaptive trait in wheat genotypes under post anthesis drought stress conditions. Afric J of Agric Res. 5:2829-2836.
Presterl T, Seitz G, Landbeck M, Thiemt W, Schmidt W, Geiger HH. 2003. Improving nitrogen use efficiency in European maize: estimation of quantitative parameters. Crop Sci 43: 1259-1265.
Reynolds MP, Borlaug NE. 2006. Impacts of breeding on international collaborative wheat improvement. J of Agricultural Science 144: 3-17.
Sbei H, Shehzad T, Harrabi M,Okuno K. 2014.Salinity tolerance evaluation of asian barley accessions (Hordeum vulgare l.) at the early vegetative stage. J of Arid Land Studies 24-1:183-186.
www.ijaer.in Copyright © IJAER 2016, All right reserved Page 436
Singh S, Sengar RS, Bhatnagar SK, Chand P, Yadav MK, Singh RR. 2014.Assessment of genetic variabilityof bread wheat (Triticum aestivumL.) genotypes for salinity using salttoleranceindices.International Journal of Agriculture Innovations and Research3(3):874-879.
Sio-Se Mardeh A, Ahmadi A, Poustini K, Mohammadi V. 2006. Evaluation of drought resistance indices under various environmental conditions. Field Crops Research98(Issues 2–3):222–
229.doi:10.1016/j.fcr.2006.02.001.
Talebi R, Fayaz F, Naji AM. 2009. Effective selection criteria for assessing drought stress tolerance in drum wheat (Triticum durum Desf.)General and Appl Plant Physiol. 35: 64-74.
Yarnia M, Arabifard N, Khoei FR, Zandi P. 2011. Evaluation of drought tolerance indices among some winter rapeseed cultivars. African J of Biotech10(53):10914-10922. doi:10.5897/AJB11.1748.
Yasir TA, Chen X, Tian L, Condon AG, Hu Y. 2013. Screening of Chinese bread wheat genotypes under two water regimes by various drought tolerance indices. AJCS 7(13):2005-2013.