I
I
n
n
t
t
e
e
r
r
n
n
a
a
t
t
i
i
o
o
n
n
a
a
l
l
J
J
o
o
u
u
r
r
n
n
a
a
l
l
o
o
f
f
P
P
h
h
a
a
r
r
m
m
a
a
S
S
c
c
i
i
e
e
n
n
c
c
e
e
s
s
Vol. 7, No. 1 (2017): 1720-1727Research Article Open Access
I
ISSSSNN:: 22332200--66881100
Anti-obesity and antioxidant effects of Probucol
against high fat diet-induced obesity in rats
Abdel-Maksoud A. Hussien
1, Mohammed A. Hussein
2,*, Mostafa G. Abdel-Reheem
11
Department of Biochemistry, Faculty of Veterinary Medicine, Benha University, 13736 Moshtohor, Qalioubeya, Egypt 2
Biochemistry Department, Faculty of Applied Medical Sciences, October 6th University, October 6th city, Egypt
* Corresponding author: Mohammed A. Hussein, e-mail: Prof.husseinma@o6u.edu.eg
ABSTRACT
The aim of the present article is to investigate the hepatoprotective and antioxidant effects of probucol (100g/kg.b.w.) in obese diabetic rats for 8 consecutive weeks prior. The results showed that probucol has antidiabetic and antioxidant actions in experimental diabetic rats. Indeed, probucol was significantly prevented the increase in the levels of body weight, blood glucose, triglycerides, total cholesterol, LDL-C, alanine aminotransferase (ALT), aspartate aminotransferase (AST), Lactate dehydrogenase (LDH) and thiobarbituric acid reactive substances (TBARS) as well as plasma levels of tumor necrosis factor-alpha (TNF-α) and nitric oxide (NO) in rats. Also, probucol was significantly improved plasma insulin level as well as liver reduced glutathione (GSH) and superoxide dismutase (SOD) and catalase (CAT) when compared to the high fat diet (HFD) control rats. The results clearly suggest that probucol produced a higher anti-obesity, anti-diabetic and antioxidant activities on experimental obese diabetic rats.
Keywords:
Probucol, high fat diet, obesity, oxidative stress and antioxidants.1. INTRODUCTION
Obesity and insulin resistance are conditions frequently associated with several complications such as hyperlipidemia [1], fatty liver [2], type II diabetes mellitus [3] and cardiovascular diseases [4]. The occurrence of oxidized low density liproprotein (LDL) within atherosclerotic lesions has been amply demonstrated [5-10], but to date the most convincing evidence for the atherogenicity of LDL oxidation is the fact that powerful antioxidants, such as probucol, butylated hydroxytoluene, and diphenyl-phenylenedi-amine (DPPD), significantly reduce atherosclerosis in rabbits, hamsters, and primates [11-16]. The most potent of these compounds, probucol, strongly protects plasma LDL against ex vivo oxidation. However, the mechanisms by which probucol and some other anti-oxidants reduce atherogenesis have not been established. Probucol also has a variety of cellular effects which may or may not be due to its antioxidant properties [17-19].
Probucol,4,4ʼ-isopropylidene-dithiobis[2,6-di-t-butyl phenol is a hypocholesterolemic agent effective in animals and humans [20]. This agent is transported and incorporated into endothelial cell membranes to act as a radical-trapping antioxidant, protecting the endothe-lial cells against oxidative stress [21] and lowers an incidence of ischemic heart disease [22]. The present study aimed to evaluate the possible hepato-protective and antioxidant effect of probucol against high fat diet-induced obesity.
2. MATERIALS AND METHODS
2.1 Chemicals:
Probucol and Metformin were from Sigma (St. Louis, MO).
2.2 Experimental design:
The animals were divided into four groups consisting of 8 animals, two controls groups and three treatment groups:
Normal group: (was received a regular diet for 8-week period).
Control positive: (was received a high fat diet for 8-week period).
Group III: Was fed a high-fat diet with Probucol (100mg/kg.b.w.) for an 8- week period [23].
Group IV: Was fed a high-fat diet with metformin (500mg/kg.b.w.) orally in a single daily dose for an 8-week period [24].
Diets were stored in airtight containers at 4oC in a
refrigerator. Peroxide content of the diets did not change during the storage period [25].
The regular diet consists of wheat flour 22.5%, soybeen powder 25%, Essential Fatty Acids 0.6%, Vitamins (A 0.6mg/kg of diet, D 1000IU/kg of diet, E 35mg/kg of diet, Niacin 20mg/kg of diet, pantothenic acid 8mg/kg, riboflavin 0.8mg/1000 kcal of diet, thiamin 4mg/kg of diet, B6 50µg/kg of diet and B12 7mg/kg of diet) and
Minerals (calcium 5g/kg of diet, Phosphorus 4g/kg of diet, fluoride 1mg/kg of diet, iodine 0.15mg/kg of diet, chloride 5mg/kg of diet, iron 35mg/kg of diet, copper 5mg/kg of diet, magnesium 800mg/kg of diet, potassium 35mg/kg of diet, manganese 50mg/kg of diet and sulfur 3mg/kg of diet) [26]. The nutrition contents of the high fat diet were similar to those of the regular diet except for the addition of 200g of fat/kg and 1% (w/w) cholesterol [27]. Body weights were measured biweekly, blood was collected for blood glucose analysis. At the end of the study, blood was also collected for the determination of plasma insulin, and lipid profile levels as well as liver antioxidant and lipid peroxidation parameters were determined.
2.3 Blood and tissue samples:
At the end of the experiment, 57th day, rats of each
group were sacrificed by cervical decapitation. Blood samples were collected in dry, clean, screw capped heparin tubes and divided into two parts. The first part of blood was used to determine blood hemoglobin [28] as well as blood and liver reduced glutathione (GSH) [29], super oxide dismutase (SOD) [30] and catalase (CAT) [31]. The second part was separated by centrifugation at 2500r.p.m for 15 minutes and used for subsequent biochemical analysis, plasma glucose [32], insulin [33], alanine aminotransferase(ALT), aspartate aminotransferse (AST) [34], lactate dehydrogenase (LDH) [35], lipid profile [36-39], tumor nicroses factor-alpha (TNF-α) [40], nitric oxide (NO) [41] and thiobarbaturic acid reactive substances (TBARs) [42] as well as liver total protein [43] using commercially available kits (Asan and Youngdong Pharmaceutical Co., Korea).
2.4 Statistical analysis
All the grouped data were statistically evaluated with SPSS/11 software [44]. Hypothesis testing methods included one way analysis of variance (ANOVA) followed by least significant difference (LSD) test. P values of less than 0.05 were considered to indicate
statistical significance. All the results were expressed as mean ± SD for eight separate determinations.
3. RESULTS AND DISCUSSION
Table 1 Body weight was determined once every 2 weeks. The body weight of the regular fed rats gradually increased as the rats grew during the 8-week trial (Table 1). During the 8 weeks of treatment, the weight of the HFD group increased significantly from the first week until the end of treatment when compared with the control group. Rats receiving Probucol (100mg/kg. b.w.) underwent a 24.57%, respectively loss in weight relative to HFD group of rats after 8 weeks (p< 0.01). However, metformin500mg/kg bw. showed a significant decrease in body weight by 25.43% when compared to the high fat diet control group (p< 0.01). Plasma insulin and glucose was determined after 8 weeks and was compared between groups in table 2. The HFD increased insulin and glucose levels by 1.5 and 1.58 folds, respectively when compared with group of rats feed regular diet. Rats receiving probucol (100mg/kg.b.w.) and metformin 500mg/kg bw. showed significant decreased insulin and glucose levels relative to HFD group of rats after 8 weeks (p< 0.01). Table 3 revealed a significant elevation in plasma cholesterol, triacylglycerols and low density lipoprotein (LDL) as well as significant reduction in high density lipoprotein (HDL) (p<0.01) in the second group which represents HFD group of rats compared with control group. The administration of probucol (100mg/kg.b.w.) and metformin 500mg/kg bw. showed significant decreased in cholesterol, triacyl-glycerols and low density lipoprotein (LDL) as well as significant elevation of high density lipoprotein (HDL) levels relative to HFD group of rats after 8 weeks (p< 0.01).
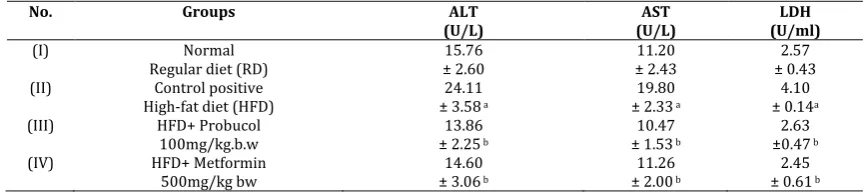
Table 4 revealed a significant elevation in plasma alanine aminotransferase (ALT), aspartate aminotransferase (AST) and lactate dehydrogenase (LDH) activities (p<0.01) in the second group which represents HFD group of rats compared with control group. The administration of probucol (100mg/kg.b.w.) and metformin 500mg/kg bw. showed significant decreased in ALT, AST and LDH activities relative to HFD group of rats after 8 weeks (p< 0.01).
group which represents HFD group of rats compared with control group. The administration of probucol (100mg/kg.b.w.) and metformin 500mg/kg bw. did not change in blood hemoglobin and liver protein relative to HFD group of rats after 8 weeks. Table 7 revealed a significant elevation in plasma tumor necrosis factor-alpha (TNF-α) and nitric oxide (NO) levels (p<0.01) in
the second group which represents HFD group of rats compared with control group. The administration of probucol (100mg/kg.b.w.) and metformin 500mg/kg bw. showed significant decreased in TNF-α and NO activities relative to HFD group of rats after 8 weeks (p< 0.01).
Table 1. Effect of probucol administration on decrease the body weight in rats
No. Groups Number of weeks
Body weight of rats(g)
0 2 4 6 8
(I) Normal
Regular diet (RD) ±10.60 156.5 157.64 ±7.40 160.10 ±8.20 162.50 ±14.35 168.40 ±9.50 (II) Control positive
High-fat diet (HFD) 159.20 ±10.47 ±12.90165.75 a
174.25 ±15.25 a
182.60 ±10.80a
215.30 ±14.55 a (IV) HFD+ Probucol
100mg/kg.b.w. 155.86 ±8.50 ± 1400156.39 b
159.62 ±15.80b
165.24 ±11.20b
162.40 ±12.95b (V) HFD+ Metformin
500mg/kg bw 153.11 ±9.76 ±13.43152.68 bc
155.00 ±12.80b
158.42 ±9.57b
160.74 ±14.38b
Body weight of rats consuming regular diet, high fat diet, high fat diet plus probucol 100 mg/kg.b.w. or fed with high fat diet plus 500 mg/kg of metformin during the 8-week period. Values are given as mean ± SD for groups of eight animals each. Significantly different from control group
at p< 0.01. a: significant from normal control; b: significant from HFD supplement group; c: significant from probucol (100mg/kg.b.w.).
Table 2. Effect of probucol on plasma insulin and glucose in rats.
No. Groups Plasma insulin
(mmol/L) Plasma glucose (mg/dl)
(I) Normal
Regular diet (RD) 92.56± 4.65 105.53± 7.43 (II) Control positive
High-fat diet (HFD) 140.73 ± 5.25
a 166.80 ± 9.24a
(III) HFD+ Probucol
100mg/kg.b.w 93.48 ± 5.36
ab 117.7 ± 10.48 ab
(V) HFD+ Metformin
500mg/kg bw 92.64 ± 6.29
ab 110.84 ± 8.66 ab
Values are given as mean ± SD for groups of eight animals each. Significantly different from control group at p< 0.01. a: significant from normal control; b: significant from HFD supplement group; c: significant from probucol (100mg/kg.b.w.).
Table 3. Effect of probucol on plasma triglycerides (TG), total Cholesterol (TC), HDL-cholesterol (HDL-C) and LDL- cholesterol (LDL-C) in rats
No. Groups TG
(mg/dl)
TC (mg/dl/L) HDL-C
(mg/dl)
LDL-C (mg/dl)
(I) Normal
Regular diet (RD) 83.48 ±6.79 97.71 ±6.38 25.48 ±4.80 55.54 ±3.78 (II) Control positive
High-fat diet (HFD) 110.07 ±7.59a
148.70 ±10.64 a
15.23 ±3.27 a
110.98 ±8.32 a (III) HFD+ Probucol
100mg/kg.b.w ±6.1987.53 b
105.86 ±8.76 b
27.66 ±4.50 b
60.7 ±4.76 b (IV) HFD+ Metformin
500mg/kg bw ±5.8882.90 b
100.65 ±7.31 b
24.64 ±5.08 b
59.43 ± 5.82 b
Values are given as mean ± SD for groups of eight animals each. Significantly different from control group at p< 0.01. a: significant from normal control; b: significant from HFD supplement group; c: significant from probucol (100mg/kg.b.w.). LDL-C (mmol/L) = TC-HDL-[TG / 5]
Table 4. Effect of probucol plasma Alanine aminotransferase (ALT), Aspartate aminotransferase (AST) and Lactate dehydrogenase (LDH) activities in rats
Values are given as mean ± SD for groups of eight animals each. Significantly different from control group at p< 0.01. a: significant from normal control; b: significant from HFD supplement group; c: significant from probucol (100mg/kg.b.w.).
No. Groups ALT
(U/L) (U/L) AST (U/ml) LDH
(I) Normal
Regular diet (RD) ± 2.60 15.76 ± 2.43 11.20 ± 0.43 2.57 (II) Control positive
High-fat diet (HFD) ± 3.5824.11 a
19.80 ± 2.33 a
4.10 ± 0.14a (III) HFD+ Probucol
100mg/kg.b.w ± 2.2513.86 b
10.47 ± 1.53 b
2.63 ±0.47 b (IV) HFD+ Metformin
500mg/kg bw ± 3.0614.60 b
11.26 ± 2.00 b
Table 5. Effect of probucol on plasma levels of thiobarbituric acid reactive substances (TBARS), blood hemoglobin and reduced Glutathione (GSH) as well as superoxide dismutase (SOD) and catalase (CAT) activities in rats
Values are given as mean ± SD for groups of eight animals each. Significantly different from control group at p< 0.01. a: significant from normal control; b: significant from HFD supplement group; c: significant from probucol (100mg/kg.b.w.).
Table 6. Effect of probucol on liver levels of thiobarbituric acid reactive substances (TBARS), reduced Glutathione (GSH) and protein as well as superoxide dismutase (SOD) and catalase (CAT) activities in rats
Values are given as mean ± SD for groups of eight animals each. Significantly different from control group at p< 0.01. a: significant from normal control; b: significant from HFD supplement group; c: significant from probucol (100mg/kg.b.w.).
Table 7. Effect of probucol on plasma levels of tumor necrosis factor-alpha (TNF-α) and nitric oxide (NO) in rats
Values are given as mean ± SD for groups of eight animals each. Significantly different from control group at p< 0.01. a: significant from normal control; b: significant from HFD supplement group; c: significant from probucol (100mg/kg.b.w.).
The present study demonstrated that the powerful hypolipidemic effect of probucol could only partially be compensated for by increasing the cholesterol content of the diet of the treatment group and reducing it in the control group. A similar overall exposure to cholesterol in all experimental groups was therefore achieved by extending the treatment period of the probucol groups. This led to a much longer intervention period in some of the probucol-treated groups, in particular the high probucol group of rats. Also, lowered fat accumulation, clarifying that the tested compounds suppresses TG, TC, HDL-C and LDL-C. Most of the reduction in plasma cholesterol occurred in the fraction of LDL-C, because of apo-B containing lipoprotein fractions are through to be responsible for cholesterol deposition [45]. Moreover, dietary supplementation of probucol decreased the plasma cholesterol, triacylglycerols and LDL levels in rats and increase in HDL-C [6].
Obesity is the most common nutritional disorder in the developed world and it is considered a risk factor associated with the development of major human diseases, including cardiovascular disease, diabetes, and cancer. A daily consumption of diets high in fat tends to promote obesity.
Increased intake of high caloric (energy and fat) food promotes body fat storage and greater body weight and adiposity in humans [46] and animals [47]. Over-the-counter remedies based on nutritional supplements are extremely popular, especially with respect to obesity and body composition. Inhibition of the digestion and absorption of dietary fat has been used as targets in obesity treatment [48]. The anti-obesity effects of probucol (100 mg/kg.b.w) was investigated using obese diabetic rats fed high-fat diet as a model of obese type-II diabetes. When fed a high-fat diet, rats develop obesity and type-II diabetes by 12-weeks old [49], and
No. Groups TBARS
(n mol /L) (mg %) GSH (U/g Hb) SOD (U/g Hb) CAT Hb%
(I) Normal
Regular diet (RD) ± 15.86 395.11 ± 5.08 39.50 ± 0.50 2.12 ± 7.60 72.36 ± 1.33 12.50 (II) Control positive
High-fat diet (HFD) ± 15.25460.46 a
22.17 ± 3.11 a
1.35 ± 0.43 a
47.16 ± 3.85a
13.10 ± 1.74 (III) HFD+ Probucol
100mg/kg.b.w ± 17.00372.82 b
33.05 ± 3.97 b
2.28 ±0.65 b
68.20 ±5.25 b
12.66 ±1.53 b (IV) HFD+ Metformin
500mg/kg bw ± 21.46360.64 b
35.48 ± 4.26 b
2.10 ± 0.35 b
62.83 ± 4.08 b
12.42 ± 1.36 b
No. Groups TBARS
(n mol /mg protein)
GSH (mg/mg protein)
SOD (U/mg protein)
CAT (U/mg. protein)
Protein (mg/g liver
tissue)
(I) Normal
Regular diet (RD) ± 0.06 0.26 ± 0.47 11.82 ± 3.32 32.46 ± 0.65 2.90 ± 7.08 60.56 (II) Control positive
High-fat diet (HFD) ± 0.030.41 a
6.86 ± 0.79 a
18.12 ± 3.26 a
1.49 ± 0.28 a
54.76 ± 5.10 a (III) HFD+ Probucol
100mg/kg.b.w ± 0.040.16 b
10.88 ± 0.54 b
31.94 ±2.98 b
2.44 ±0.38 b
56.44 ±4.65 b (IV) HFD+ Metformin
500mg/kg bw
0.25 ± 0.06 bc
9.81 ± 0.73 b
29.18 ± 4.22 b
2.54 ± 0.55 b
55.28 ± 3.47 b
No. Groups TNF-α
(µU/ml) ( µU/ml ) NO
(I) Normal
Regular diet (RD) ± 13.73 194.81 ± 2.65 22.52 (II) Control positive
High-fat diet (HFD) ± 14.80272.54 a
35.83 ± 4.11 a (III) HFD+ Probucol
100mg/kg.b.w
184.03 ± 11.56 b
22.69 ± 3.26 b (IV) HFD+ Metformin
500mg/kg bw ± 15.32170.62 b
these rats are thus widely used for research into obesity and diabetes [50]. In the present study, high-fat diet was administered to 8-week-old to induce severe obesity and diabetes and the effects of probucol were evaluated. High-fat diet is widely used in studies on obesity and diabetes [51]. Probucol was found to significantly suppress increases in body weight, showing anti-obesity actions (Table 1). Plasma glucose and insulin levels were significantly higher for the high-fat diet group than for the regular diet group, and severe type II diabetes was induced. Probucol suppressed these increases in plasma glucose and insulin levels. These findings clarify that probucol suppresses obesity and diabetes caused by a high-fat diet. Obesity is caused by low energy expenditure and increased fatty acid synthesis from carbohydrates and fat intake by organs. Probucol was found to significantly suppress increases in plasma lipids content, showing anti-obesity actions (Table 3). High-fat diet also increased liver High-fat accumulation and induced fatty liver, but probucol administration lowered fat accumulation, clarifying that probucol suppresses TG, TC, HDL-C and LDL-C (Table 3). The elevation of TG, TC and LDL-C up on high fat diet feeding is not surprising and is in agreement with several studies [52]. The results showed that upon administration probucol for 8 weeks significantly decreased the plasma TG, TC and LDL-C. Most of the reduction in plasma cholesterol occurred in the fraction of LDL. Because of apo B containing lipoprotein fractions are through to be responsible for cholesterol deposition in atherosclerotic plaques [53], a reduction in LDL would be advantageous clinically extract had an improving effect on the hypercholesterolemia induced by a high fat diet.
This assumption is supported by three mechanisms;
the first is indicated that probucol successfully decreased the intestinal cholesterol absorption in situ [54]. The second mechanism indicated that the hypolipidemic activity of probucol treatments may also be mediated via inactivation of hepatic HMG-CoA reductase, a key enzyme, in cholesterol synthesis. In concurrence with this attribution, Raz et al. [55] state that inhibitors of hepatic HMG-CoA reductase are well established drugs for the treatment of hypercholesterolemia and decrease the incidence of dyslipidemia in diabetic subjects. This also coincides well with the work of Jung et al. [56], who state that polyphenols decrease liver HMG-CoA reductase activity in type 2 diabetic rats. Moreover, polyphenols has been reported to lower hepatic and blood cholesterol levels, as stated by Park et al. [57]. Taken together, it can be concluded that the ameliorative effect of probucol on plasma lipids variables may be attributed to their insulin releasing capacity and insulin binding affinity and decreasing intestinal cholesterol absorption and activity of hepatic HMG-CoA reductase. In the third
mechanism, amelioration of the glycemic, lipidemic and antioxidant states of diabetic rats in response to treatment with probucol may also be attributed to the increased expression of PPARγ. The effect of PPARγ on
lipid and glucose control may be explained according to Lee et al. [58], Staels and Fruchart [59], Feige et al. [60] and Lefebvre et al. [61], who state that PPARγ promotes pre-adipocyte differentiation, stimulates the storage of fatty acids (FAs) in adipocytes and enhances insulin sensitivity. The action of PPARγ on insulin sensitivity results from its ability to channel FAs into adipose tissue, thus decreasing plasma FA concentration and alleviating lipotoxicity in skeletal muscle, liver and pancreas. Also, PPARγ activation has been reported to improve insulin resistance by lowering the hepatic triglyceride content [62, 63], activating hepatic glucokinase expression [64] and exhibiting an antiatherogenic effect synergistic with an HMG-CoA reductase inhibitory effect in rabbits [65]. In addition, PPARγ can affect insulin sensitivity by regulating adipocyte hormones, cytokines and proteins that are involved in insulin resistance. Indeed, PPARγ down regulates the expression of genes encoding resistin and TNFα, whereas it induces adiponectin expression, which increases FA oxidation by activation of the AMP-activated protein kinase pathway [66, 67]. Probucol may be influence glucose metabolism by several mechanisms, such as inhibition of carbohydrate digestion and glucose absorption in the intestine, stimulation of insulin secretion from the pancreatic β-cell, modulation of glucose release from liver, activation of insulin receptors and glucose uptake in the insulin-sensitive tissues, and modulation of hepatic glucose output. The present study suggests that probucol may act on liver to increase energy expenditure related fatty liver degradation. Furthermore, probucol may decrease mRNA expression of acetyl-CoA carboxylase (ACC) and fatty acid synthase (FAS)], the rate-limiting enzymes of fatty acid synthesis in the liver, and mRNA expression of [sterol regulatory element-binding protein (SREBP)-1c [68], which controls the expression of these enzymes [69]. These findings indicate that the anti-obesity actions of probucol are may be due to increased expression of energy expenditure-related genes in liver and decreased fatty acid synthesis and fat intake in the liver. On the other hand, Insulin resistance can be generated by decreased adiponectin secretion and decreased TNF-α secretion [52]. Tables 4-7 illustrate the elevation ALT, AST, LDH, TBARS, TNF-α and NO as well as significant depletion of GSH, SOD and CAT levels in group II rats are a clear manifestation of excessive formation of free radical and activation of lipid peroxidation. The significantly reduced the levels of TBARS, in rats administered with probucolalong with HFD.
The direct scavenging action of probucol on hydroxyl radicals, O2·–, and 1,1-diphenyl-2-picrylhydrazyl
(DPPH) radicals was examined by electron spin resonance (ESR) spectrometry [72]. Probucol scavenged DPPH radical dose dependently but showed no effect on hydroxyl radicals or on superoxide generated by Fenton reaction and by the hypoxanthine–xanthine oxidase system. From a pharmacological aspect, probucol is a lipophilic antioxidant; thus one of the antioxidative properties of probucol plays a role in an aprotic system similar to the lipophilic domain of the liposomal membrane. To clarify the reactivity of probucol with O2·– in the
lipophilic phase, we studied the mechanism of redox reactions of probucol with O2·– in acetonitrile.
Electrochemical techniques are useful for investigating electron-transfer reactions. The electrochemical behavior appears to be a good model for biological oxidation of pharmacologically active substances.
Glutathione, an endogenous antioxidant defense, is found in liver at high concentration. It plays a central role in the defense against free radicals, peroxides and a wide range of xenobiotics and carcinogens [72]. Tables 5&6 demonstrates the levels of oxidative stress biomarkers GSH, SOD and CAT in HFD rats. The significant fall in the levels of tissues oxidative stress biomarkers were observed in high fat diet rats (group II) as compared to the control rats (group I). Administration of probucol along with HFD rats substantially enhanced the levels of these enzymes when compared with HFD rats (group II). The present results also coincides with Hiramatsu et al. [73], Hussein and Abdel-Gawad [53], Abou Ghalia and Fouad [74], Zhao et al., [75] and Hussein and Farghaly [76], who proved that the antioxidant activity of plants containing polyphenols using different mechanisms. The probucol used in the present study acted on fatty liver and was shown to possess obesity and anti-diabetic actions. While many studies have described plant extracts exhibiting antioxidant and anti-diabetic actions, to the best of our knowledge.
In conclusion, the present study showed that the effects of anti-obesity, anti-diabetic and anti-oxidative activities of probucol depend on its structure properties and presence of m-hydroxyl group.
5. REFERENCES
1. Fried M, Hainer V, Basdevant A, Buchwald H, Dietel M, et al. (2008) [Interdisciplinary European guidelines on surgery for severe obesity]. Rozhl Chir 87: 468-476.
2. Yalniz M, Bahcecioglu IH, Kuzu N, Poyrazoglu OK, Bulmus O, et al. (2007) Preventive role of genistein in an experimental non-alcoholic steatohepatitis model. J Gastroenterol Hepatol 22: 2009-2014.
3. Pagotto U, Vanuzzo D, Vicennati V, Pasquali R (2008) [Pharmacological therapy of obesity]. G Ital Cardiol (Rome) 9: 83S-93S.
4. Artham SM, Lavie CJ, Milani RV, Ventura HO (2008) The obesity paradox: impact of obesity on the prevalence and prognosis of cardiovascular diseases. Postgrad Med 120: 34-41.
5. Haberland ME, Fong D, Cheng L. (1988). Malondialdehyde-altered protein occurs in atheroma of Watanabe heritable hyperlipidemic rabbits. Science. 241:215–218.
6. Palinski W, Rosenfeld ME, Ylä-Herttuala S, et al., (1989) . Low density lipoprotein undergoes oxidative modification in vivo. Proc. Natl. Acad. Sci. USA. 86: 1372–1376.
7. Ylä-Herttuala S, Palinski W, Rosenfeld M E, et al., (1989). Evidence for the presence of oxidatively modified low density lipoprotein in atherosclerotic lesions of rabbit and man. J. Clin. Invest. 84: 1086–1095.
8. Boyd HC, Gown AM, Wolfbauer G, Chait A. (1989). Direct evidence for a protein recognized by a monoclonal antibody against oxidatively modified LDL in atherosclerotic lesions from a Watanabe Heritable Hyperlipidemic rabbit. Am. J. Pathol. 135: 815–826.
9. Rosenfeld ME, Palinski W, Ylä-Herttuala S, et al., (1990). Distribution of oxidation-specific lipid-protein adducts and apolipoprotein B in atherosclerotic lesions of varying severity from WHHL rabbits. Arteriosclerosis. 10: 336–349.
10.Hammer A, Kager G, Dohr G, et al., (1995). Generation, characterization, and histochemical application of monoclonal antibodies selectively recognizing oxidatively modified apoB-containing serum lipoproteins. Arterioscler. Thromb. Vasc. Biol. 15: 704–713.
11.Kita T, Nagano Y, Yokode M, et al., (1987). Probucol prevents the progression of atherosclerosis in Watanabe heritable hyperlipidemic rabbit, an animal model for familial hypercholesterolemia. Proc. Natl. Acad. Sci. USA. 84: 5928– 5931.
12.Carew TE, Schwenke DC,Steinberg D. (1987). Antiatherogenic effect of probucol unrelated to its hypocholesterolemic effect: evidence that antioxidants in vivo can selectively inhibit low density lipoprotein degradation in macrophage-rich fatty streaks slowing the progression of atherosclerosis in the WHHL rabbit. Proc. Natl. Acad. Sci. USA. 84: 7725–7729. 13.Björkhem I, Henriksson-Freyschuss A, Breuer O, et al.,
(1991). The antioxidant butylated hydroxytoluene protects against atherosclerosis. Arterioscler. Thromb. 11: 15–22. 14.Sparrow CP, Doebber TW, Olszewski J, (1992). Low density
lipoprotein is protected from oxidation and the progression of atherosclerosis is slowed in cholesterol-fed rabbits by the antioxidant N,N′′-diphenyl-phenylenediamine. J. Clin. Invest. 89: 1885–1891.
15.Parker RA, Sabrah T, Cap M, (1995). Relation of vascular oxidative stress, α-tocopherol, and hypercholesterolemia to early atherosclerosis in hamsters. Arterioscler. Thromb. Vasc. Biol. 15: 349–358.
16.Sasahara M, Raines E, Chait A, Carew TE, (1994). Inhibition of hypercholesterolemia-induced atherosclerosis in Macaca
nemestrina by probucol. I. Is the extent of atherosclerosis
related to resistance of LDL to oxidation? J. Clin. Invest. 94: 155–164.
17.Chang MY, Sasahara M, Chait A, (1995). Inhibition of hypercholesterolemia-induced atherosclerosis in the nonhuman primate by probucol: II. Cellular composition and proliferation. Arterioscler. Thromb. Vasc. Biol. 15: 1631– 1640.
18.Akeson AL, Woods CW, Mosher LB. (1991). Inhibition of IL-1 beta expression in THP-1 cells by probucol and tocopherol. Atherosclerosis. 86: 261–270.
19.Fruebis J, Gonzales V, Silvestre M, et al., (1997). Effect of probucol treatment on gene expression of VCAM-1, MCP-1 and M-CSF in the aortic wall of LDL receptor-deficient rabbits during early atherogenesis. Arterioscler. Thromb. Vasc. Biol. 17: 1289–1302.
20.Tomikawa M, Nakayasu T, Tawara K, et al., (1981) . Effect of probucol on serum lipoprotein levels in normal and dyslipoproteinemic mice. Atherosclerosis. 40: 101-113. 21.Kuzuya M, Naito M, Funaki C, etal., (1991). Probucol prevents
oxidative injury to endothelial cells. J Lipid Res. 32: 197-204. 22.Miettinen TA, Huttunen JK, Strandberg T, et al., (1981). Lowered HDL choleserol and incidence of ischaemic heart disease. Lancet 29: 478.
rabbit aortic endothelium. Arterioscler. Thromb. 13: 197– 204.
24.Gong Y, Lii W, Li Y, Yang S, Sheng Li, Yang N, Shan H, Xue H, Liu W, Yang B, Dong D and Li B. (2009) Probucol attenuates atrial autonomic remodeling in a canine model of atrial fibrillation produced by prolonged atrial pacing. Chin Med J 122(1):74-82.
25.Lee A and Morley JE.(1998). Metformin decreases food consumption and induces weight loss in subjects with obesity with type II noninsulindependent diabetes. Obes Res 6:47-53.
26.Dwivedi C, Muller LA, Goet-Parten DE, Kasperson K, Mistry VV. (2003). Chemopreventive effects of dietary mustard oil on colon tumor development. Cancer Lett .196:29–34. 27.NRC (1995): Nutrient Requirement for laboratory animals.
Fourth revised edition .national Academy Press Washington , D.C; National Research Council.
28.Assinewe VA, Baum BR, Gagnon D, Arnason JT (2003). Phytochemistry of Wild Populations of Panax quinquefolius L. (North American Ginseng). J Agric Food Chem,51: 4549-4553.
29. Van Kampen, E.J. and Zijlstra, W.G. (1961). Standardization of hemoglobinometry.II. The hemiglobin-cyanide method. Clin. Chim. Acta, 6:538- 44.
30.Chanarin I. Text book of Laboratory Haematology: An Account of Laboratory techniques, Churchill Livingstone, New York PP. 1989; 107.
31.Marklund S, Marklund D. ( 1974): Involvement of the superoxide anion radical in the autoxidation of pyrogallol and a convenient assay for superoxide dismutase. Eur. J. Biochem., 47:469.
32.Sinha, AK. Colorimetric assay of catalase. J.Anal Biochem. 1972; 47 (2): 389-94.
33.32.Trinder P. (1969). Determination of glucose in blood using glucose oxidase with an alternative oxygen acceptor. Ann. Clin. Biochem., 6, 24-32.
34.Finlay JWA, Dillard RF.(2007). Appropriate Calibration Curve Fitting in Ligand Binding Assays. AAPS Journal., 9(2): E260-E267.
35.Reitman S and Frankel S. (1957). A colorimetric method for the determination of serum oxaloacetic acid and glutamic pyruvic transaminases. Am. j. Clin. Pathol, 28: 56 – 63. 36.Buhl SN and Jackson KY. (1978). Optimal conditions and
comparison of lactate dehydrogenase catalysis of the lactate to pyruvate to lactate reactions in human serum at 25, 30 and 37 0C. Clin. Chem.; 2415: 828.
37.Allain CC, Poon LS, Chan CS, Richmond W, Fu PC.(1974). Enzymatic determination of total serum cholesterol. Clin Chem, 4: 470-475.
38.Fossati P, Prencipe L.(1982). Serum triacylglycerols determined calorimetrically with an enzyme that produces hydrogen peroxide. Clin Chem, 1: 2077-2080.
39.Burnstein M, Selvenick HR, Morfin R. (1970). Rapid method for isolation of lipoprotein from human serum with polyanions. J Lipid Res,11: 583- 395.
40.Falholt K, Falholt W, Lund B. (1973). An easy colorimetric method for routine determination of free fatty acids in plasma. Clin Chim Acta, 46: 105–111.
41.Beyaert, R. and Fiers, W. (1998). Tumor Necrosis Factor and Lymphotoxin. In Cytokines, A.R.M.-S. a. R. Thorpe, eds. Academic Press, San Diego, p. 335-360.
42.Miranda, K.M.; Espey, M.G.; Wink. D.A. (2001). A rapid, simple spectrophotometric method for simultaneous detection of nitrate and nitrite. Nitric Oxide. 5: 62-71.
43.Nichans WH, Samulelson B. (1968): Formation of malondialdehyde from phospholipid arachidonate during microsomal lipid peroxidation. Eur J Biochem, 6: 126-30. 44. Weichselbaum, T.E. (1946): An accurate and rapid method
for the determination of proteins in small amounts of blood, serum and plasma. Am. J. Clin. Pathol. 16: 40-49.
45.SPSS. (SPSS 15, Inc., Chicago, IL, USA).2012.
46.Schaefer EJ, Asztalos BF (2006) Cholesteryl ester transfer protein inhibition, high-density lipoprotein metabolism and heart disease risk reduction. Curr Opin Lipidol 17: 394-398. 47.Bray GA, Lovejoy JC, Smith SR, et al., (2002)The influence of
different fats and fatty acids on obesity, insulin resistance and inflammation. J Nutr. 132: 2488–2491.
48.Estadella D, Oyama LM, Damaso AR, et al., (2004). Effect of palatable hyperlipidic diet on lipid metabolism of sedentary and exercised rats. J. Nutrition. 20: 218–224.
49.Weigle DS. (2003). Pharmacological therapy of obesity: past, present, and future. J Clin Endocrin & Metab. 88(6): 2462– 2469.
50.Hayashi K, Ito M. (2002). Antidiabetic action of low molecular weight chitosan in genetically obese diabetic KKAy mice. Biol
Pharm Bull. 25: 188–192.
51.Tsuchida A, Yamauchi T, Takekawa S, et al., (2005). Peroxisome proliferator-activated receptor (PPAR)α activation increases adiponectin receptors and reduces obesity-related inflammation in adipose tissue: comparison of activation of PPAR α, PPARγ, and their combination.
Diabetes.54: 3358–3370.
52.Hildebrandt AL, Kelly-Sullivan DM, Black SC. (2003). Antiobesity effects of chronic cannabinoid CB1 receptor antagonist treatment in diet induced obese mice. Eur J
Pharmacol. 462: 125–32.
53.Hussein MA, Abdel-Gawad SM. (2010). Protective effect of
Jasonia montana against ethinylestradiol induced cholestasis
in rats. Saudi Pharmaceutical Journal. 2010; 18: 35-45. 54.Schaefer E, Asztalos B. (2006). Cholesteryl ester transfer
protein inhibition, high-density lipoprotein metabolism and heart disease risk reduction. Curr. Opin. Lipidol. 17: 394-398. 55.Crozier A, Jaganath IB, Clifford MN. (2009). Dietary
phenolics: Chemistry, bioavailability and effects on health.
Nat. Prod. Rep. 26: 1001–1043.
56.Raz I, Eldor R, Cernea S, Shafrir E. (2005). Diabetes, insulin resistance, derangements in lipid metabolism. Cure through intervention in fat transport and storage. Diabetes Metab Res Rev. 21:3-14.
57.Jung UJ, Lee MK, Park YB. (2006). Effect of citrus favonoids on lipid metabolism and glucose-regulating enzyme mRNA levels in type-2 diabetic mice. Int J Biochem Cell Biol. 38:1134-1145.
58.Park SY, Bok SH, Jeon SM, et al., (2002). Effect of rutin and tannic acid supplements on cholesterol metabolism in rats.
Nutr Res. 22:283-295.
59.Lee CH, Olson P, Evans RM. (2003). Minireview: lipid metabolism, metabolic diseases, and peroxisome proliferator-activated receptors. Endocrinology. 144:2201-2207.
60.Staels B, Fruchart JC. (2005). Therapeutic roles of peroxisome proliferator-activated receptor agonists.
Diabetes. 54:2460-2470.
61.Feige JN, Gelman L, Michalik L, et al., (2006). From molecular action to physiological outputs: peroxisome proliferator-activated receptors are nuclear receptors at the crossroads of key cellular functions. Prog Lipid Res. 45:120-159.
62.Lefebvre P, Chinetti G, Fruchart JC, et al., (2006). Sorting out the roles of PPAR alpha in energy metabolism and vascular homeostasis. J Clin Invest. 116:571-580.
63.Fulgencio JP, Kohl C, Girard J, et al., (1995). Troglitazone inhibits fatty acid oxidation and esterification, and gluconeogenesis in isolated hepatocytes from starved rats.
Diabetes. 45:1556-1562.
64.Yamauchi T, Kamon J, Waki H,et al., (2001). The mechanisms by which both heterozygous peroxisome proliferatoractivated receptor gamma (PPARγ) deficiency and PPARγ agonist improve insulin resistance. J Biol Chem. 276:41245-41254.
65.Kim SY, Kim HI, Park SK, et al., (2004). Liver glucokinase can be activated by peroxisome proliferator-activated receptor-γ.
Diabetes. 53:S66-S70.
66.Shiomi M, Ito T, Tsukada T, et al., (1999). Combination treatment with troglitazone, an insulin action enhancer, and pravastatin, an inhibitor of HMG-CoA reductase, shows a synergistic effect on atherosclerosis in WHHL rabbits.
Atherosclerosis 142:345-353.
67.Hevener AL, He W, Barak Y, et al., (2003). Muscle-specific PPARγ deletion causes insulin resistance. Nat Med. 9:1491-1497.
69.Kim JK, Fillmore JJ, Chen Y, et al., (2001). Tissue-specific overexpression of lipoprotein lipase causes tissue-specific insulin resistance. Proc Natl Acad Sci. 98: 7522–7527. 70.Guillou H, Martin PG, Pineau T. (2008). Transcriptional
regulation of hepatic fatty acid metabolism. Subcell Bioche. 49: 3–47.
71.Carew ET, Schwenke CD, Steinberg D. (1987). Proc. Natl. Acad. Sci. U.S.A., 84, 7725-7729.
72. Noguchi N, Niki E. (2000). Free Radical Biol. Med., 28, 1538—1546.
73.Hiramatsu M, Liu J, Edamatsu R. (1994). Free Radical Biol. Med., 16, 201-206.
74.Abou Ghalia AH, Fouad IM. (2000). Glutathione and its metabolizing enzymes in patients with different beningn and malignant diseases. Clin. Biochem.33: 657-662.
75.Zhao B, Li X, He R, et al., (1989). Scavenging effect of extracts of green tea and natural antioxidants on active oxygen radicals. Cell Biophys. 14: 175–85.
76.Hussein MA, Farghaly HS. (2010). Protective Effects of
Jasonia montana Against Lipid Peroxidation in Liver and
Kidney of Iron-overloaded Rats. Australian Journal of Basic
and Applied Sciences. 4: 2004-2012.
*****
© 2016; AIZEON Publishers; All Rights Reserved