ABSTRACT
CANTOR BARREIRO, FELIX ROBERTO. Characterization of Advanced High-Oleic ‘Bailey’ Derivative Breeding Lines and the Normal-Oleic Cultivar ‘Bailey’. (Under the direction of Dr. Thomas G. Isleib).
brightness (Hunter L score, P = 0.56), sound splits (P = 0.053), total-SMK (P = 0.134), other kernels (P = 0.716), jumbo-to-fancy ratio (P = 0.731), yield (kg ha-1, P = 0.908) and crop value ($ ha-1, P = 0.576). Variation among high-oleic lines was not observed for leaf spot, TSW and Sclerotinia blight incidence.
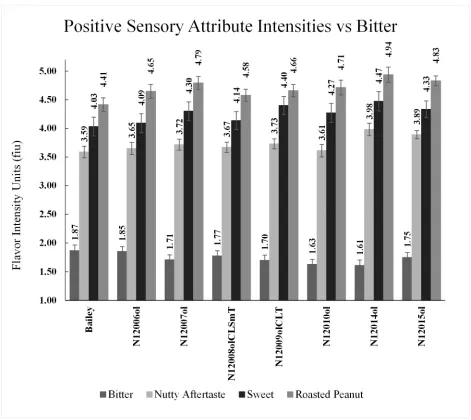
Flavor has been identified by processors of peanuts as the pre-eminent trait of importance in marketing finished product. It is important that the flavor profiles of new releases meet or exceed those of the cultivars they are intended to replace. The third objective was to evaluate the flavor profile of the high-oleic Bailey’s and compare the results with Bailey itself. One of the high-oleic lines scored significantly greater than Bailey for roasted peanut [N12014ol 4.94 vs 4.41 flavor intensity units (fiu), P=.013]. All of the rest were numerically but not statistically greater. With respect to the sweet attribute, two lines were statistically superior to Bailey (N12014ol, 4.47 vs 4.03 fiu, P=.012 and N12009olCLT, 4.40 vs 4.03 fiu, P=.03). One line was superior to Bailey for nutty aftertaste (N12014ol, 3.98 vs 3.59 fiu, P=.041). These results are considered a positive improvement. N12014ol scored lower than Bailey in some of the attributes generally thought to be negative including under-roast (1.37 vs 1.90 fiu, P=.002) and stale/cardboard (1.34 vs 1.79 fiu, P=.001). No
differences among high-oleics for bitter aftertaste and over roast were observed. Moreover, none of the high-oleics was different from Bailey for wood/hull/skins attribute, associated with peanut skins and phenolic compounds. The effect of the intensity of the off flavors of the high-oleic lines was in a positive direction compared to Bailey. One line had
© Copyright 2018 Félix Roberto Cantor Barreiro
Characterization of Advanced High-Oleic ‘Bailey’ Derivative Breeding Lines and the Normal-Oleic Cultivar ‘Bailey’.
by
Félix Roberto Cantor Barreiro
A thesis submitted to the Graduate Faculty of North Carolina State University
in partial fulfillment of the requirements for the degree of
Master of Science
Crop Science
Raleigh, North Carolina 2018
APPROVED BY:
_______________________________ _______________________________
Dr. Jonathan Duggins Dr. MaryAnne Drake
_______________________________ Dr. Thomas G. Isleib
ii
DEDICATION
This thesis is dedicated to every member in my family. To my parents Roberto and Consuelo.
To my sisters, Margarita, Consuelo, Cleotilde and Maria.
To my grandfather Felícito de Jesus Barreiro and his wife Amelia. To my parents in law Tobi and Anne.
To my beloved and beautiful wife Caroline Svensson-Cantor. To my daughter to be (expecting her in March 2018) Olivia Cantor.
iii
BIOGRAPHY
iv
ACKNOWLEDGMENTS
v
TABLE OF CONTENTS
LIST OF TABLES ... vii
LIST OF FIGURES ... viii
Chapter I Literature Review... 1
INTRODUCTION ... 2
ORIGIN OF PEANUT ... 3
CHARACTERISTICS AND CULTURAL PRACTICES ... 4
MARKET TYPES ... 5
ECONOMIC IMPORTANCE... 6
PEANUT COMPOSITION ... 7
Lipids. ... 7
CULTIVAR DEVELOPMENT (IMPROVEMENT) ... 9
Yield. ... 10
Grade. ... 10
Diseases. ... 11
Official evaluation. ... 12
REFERENCES ... 14
Chapter II Agronomic Performance Assessment ... 19
ABSTRACT ... 20
INTRODUCTION ... 22
The Bailey cultivar. ... 22
MATERIALS AND METHODS ... 23
Germplasm (Experimental Lines). ... 23
Description of disease selection tests and evaluation of BC3F2:4 and BC3F4:6 families. .. 25
Leaf spot. ... 26
Cylindrocladium black rot (CBR) and Sclerotinia blight (SB). ... 26
Tomato spotted wilt (TSW). ... 26
Statistical Analysis for DST series. ... 27
Description of disease advanced tests and evaluation of BC3F6 Bailey high-oleic lines. 27 Yield. ... 28
Grade. ... 28
vi
RESULTS AND DISCUSSION ... 30
Agronomic Performance: Disease Reactions. ... 30
Yield and Grade ... 31
CONCLUSION ... 32
REFERENCES ... 35
Chapter III Flavor Assessment... 46
ABSTRACT ... 47
INTRODUCTION ... 49
Flavor. ... 49
MATERIALS AND METHODS ... 51
Germplasm... 51
Peanut Roasting and Grinding. ... 51
Sensory Analysis. ... 52
Statistical Analysis. ... 52
RESULTS AND DISCUSSION ... 54
CONCLUSION ... 56
REFERENCES ... 58
vii
LIST OF TABLES
Chapter II: Agronomic Performance Assessment
Table 2.1. Disease reaction of Bailey and backcross high-oleic derivatives to Leaf
Spots, TSW and SB. ... 38 Table 2.2. Covariance parameter estimates and significance for traits of pod
characteristics and yield. ... 39 Table 2.3. Comparison of Bailey and backcross high-oleic derivative lines of graded
pod characteristics and yield. ... 40 Table 2.4. Comparison of Bailey and backcross high-oleic derivative lines of seed
characteristics and crop value. ... 42 Chapter III: Flavor Assessment
Table3.1. Covariance parameter estimates and significance of four generally critical attribute intensities. ... 61 Table3.2. Mean of some critical sensory attribute intensity scores with standard error
of Bailey and backcross high-oleic lines. ... 62 Table3.3. Mean of generally negative sensory attribute intensity scores with standard
error of Bailey and backcross high-oleic lines. ... 63 Appendix
viii
LIST OF FIGURES
Chapter II: Agronomic Performance Assessment
Figure 2.1. Distribution of disease reaction means and standard errors of leaf spot (A), Sclerotinia blight (B), and tomato spotted wilt (C). *Tomato spotted wilt is the corrected scale transformation (square root of proportion of
symptomatic plants). ... 44 Figure 2.2. Distribution of crop value and yield for Bailey and the high-oleic lines. No
differences detected at the 5% significance level. ... 45 Chapter III: Flavor Assessment
Figure 3.1. Comparison of adjusted means and one standard error for three critical
1
2
INTRODUCTION
3
ORIGIN OF PEANUT
The cultigen, A. hypogaea, is a species belonging to the genus Arachis of the
Leguminosae (or Fabaceae) family that is the third largest family of the flowering plants. It is comprised of over 600 genera and 20,000 species with extraordinary diversity (Doyle, 2004). Its range of distribution goes from the alpine and artic regions to the equatorial tropics, and three subfamilies have been classified: the Mimosoideae, the Papilionoideae and the Caesalpinoideae. The genus Arachis belongs to the clade Pterocarpus of the
aeschynomenoid-dalbergioid group, one of the four lineages derived from the Papilionoideae subfamily (Lavin et al., 2001). The genus Arachis is composed of about 80 species,
4
section Arachis, also derived from the two wild diploids described above. Further, they suggest that these two wild ancestors, A. duranensis and A. ipaensis were themselves cultivated and domesticated close to the sandbanks of Río Seco in the Salta Province in Argentina and Villa Montes city in the south of Bolivia respectively.
CHARACTERISTICS AND CULTURAL PRACTICES
5
development, although it varies depending on the cultivar, environment and their interaction. It is a common practice in the U.S.A. that the fruits are harvested when about 70% of them are mature. Although globally a high proportion of the crop is used for oil extraction, the primary use in North America is as a food source. Generally it is monocropped.
Mechanization for land preparation, planting, disease control, digging, picking and
harvesting is utilized in developed countries in contrast to intensive hand labor in developing ones. Sandy soils are preferred rather than other types due to the relative ease of harvesting and cleaner pods obtained for the in-shell market.
MARKET TYPES
6
Runner type cultivars occupy about 80% of the country’s acreage with 14 cultivars in the certified seed production. Almost all runner types are used to produce peanut butter. Virginia-type cultivars are grown mainly in the VC area for gourmet markets and direct human consumption. This market type accounts for about 15% of the country’s acreage with 10 cultivars in the certified seed production. Spanish and Valencia types together produce about 5% of the total production.
ECONOMIC IMPORTANCE
Peanut production in the U.S.A. is concentrated in three geographical major regions: the Southeast, the Southwest and the Virginia-Carolina areas. In 2016, the total U.S.
7
PEANUT COMPOSITION
The approximate composition of peanuts (all types) is 49.2 g (100 g)-1 oil, 25.8 g (100 g)-1 protein, 16.1 g (100 g)-1 carbohydrates, 8.5 g (100 g)-1 dietary fiber, 6.5 g (100 g)-1
moisture, 4.7 g (100 g)-1 sugars, and 2.3 g (100 g)-1 ash (data from USDA National Nutrient Database for Standard Reference, 2015). It is worth mention that values for specific varieties or cultivars may vary depending of the market type, genotype and environment and their interaction, storage conditions, processing, and others. Lipids are the predominant component, approximately 49.2 g (100 g)-1 of seed dry weight. Previous studies have
determined the lipid composition of Spanish and Valencia botanical varieties and they found that the average oil content ranged from 47.1 to 54.6 g (100 g)-1 and 45.2 to 46.4 g (100 g)-1 respectively (Bishi et al., 2013, Sundaram et al., 2010). Pattee and coworkers (1983) studied the chemical composition of legume lipids and determined that the Virginia-type peanuts contained approximately 47.6 g (100g)-1 of total lipids. This is an important implication when considering flavor and the association of lipids with shelf life and the development of undesirable aromas and flavors of peanut products due to lipid oxidation during storage.
Lipids.
8
Carrín and Carelli, 2010; Isleib et al., 2006). The three major species present in peanuts are: oleic, linoleic (unsaturated FAs) and palmitic (saturated FA). Oleic and linoleic FAs in “normal” peanut oil comprise together from 80 to 85% of the total lipid composition (Isleib and Copeland, 2015), the remaining 15 to 20% is comprised mainly of palmitic FA (ca. 10%) and the remainder, other FAs (Ahmed and Young, 1982). In “high-oleic” peanuts, lipid composition may vary, the ratio between oleic to linoleic ranges from 10:1 to 30:1 while in normal peanuts this ratio is lower (Isleib and Copeland, 2015).
The “high-oleic” acid trait has been associated to the improvement of the shelf life and the reduced of rancidity of peanut products. It was first discovered in the late 1980’s by Norden and colleagues from the Univ. of Florida (Norden et al., 1987) and patented in 2000 (patents US 6121472A / US 6063984A) in which the researchers discovered a high-oleic mutant with approximately 80% oleic fatty acid and 3% linoleic. Later, in 2002 Andersen and Gorbet concluded that the contents of these two fatty acids were negatively correlated and nearly linear. Research has been conducted to study flavor stability of high-oleic peanuts (Mugendi et al., 1998), improving the shelf life of roasted and salted in-shell peanuts
9
CULTIVAR DEVELOPMENT (IMPROVEMENT)
Although the origin of the vast majority of germplasm utilized for cultivar
development or improvement of the crop in the U.S.A. is unknown, it is clear that they have played a key role to the economy, as well as has the collection of foreign germplasm
introduced into the U.S. known as “plant introductions” or “PIs”. Isleib and colleagues (2001) estimated the economic impact of these materials in more than $200 million annually for the U.S. peanut industry, with all certainty, that impact has increased during the last 16 years. Plant breeding has contributed to fulfilment of the human demands on the peanut crop, especially food security (productivity, pest resistance, environmental exposure
tolerance for growers), safety (resistance to toxigenic fungi), processor quality (uniformity of seed size and shape, favorable shelling and blanching characteristics), and consumer quality (nutritional benefits, texture, color, aroma and, very importantly, flavor) (Norden et al., Chapter 4 In Pattee and Young (Eds.), 1982; Fehr, 1993). Different breeding methods or systems have been applied to the improvement of the crop regarding the demands mentioned above. Norden and colleagues in Pattee and Young’s 1982 monograph, described the
procedures of methods utilized at the time, and progress obtained by the application of these methods: hybridization and mutation (to obtain genetic variability); mass/pure-line selection, bulk population, modified pedigree and pedigree, and backcross methods of breeding just to mention some. The need to continue the fulfilment of the demands mention above have become the objectives to accomplished of almost every peanut breeding program in the U.S.A. North Carolina State University (N.C. State Univ.) is responsible for providing Virginia-type peanut cultivars to the VC production area with high-yielding, disease
10
in the market is dependent on its appeal to seedsmen, growers, shellers, processors and last but not least the consumer. The method of the peanut breeding program at N.C. State Univ. for cultivar development primarily is the pedigree selection. However, some populations are subject to a combination of pedigree and modified pedigree selection, early generation testing, single seed descent (with use of an off-season nursery) and backcross methodology (Acquaah, 2007).
Yield.
Production per unit of land area, yield, is an important trait and one of the ways farmers can minimize the high costs of production every season. Because hybridization is the primary source of obtaining genetically variable populations on which selection will be conducted to achieve high-yielding materials, one has to intermate the best cultivars and breeding lines among themselves. Yield is a polygenically controlled trait that is highly influenced by environmental factors or variation due to genotype-by-environment interaction that makes it difficult to identify progeny with yield potential. The peanut breeding program at N.C. State Univ. relies on early selection for relatively high heritable traits such as plant type, pod, seed size and seed shape (Isleib et al., 2016; Sikinarum et al., 2007), to narrow the population down to the ones with the Virginia market type and screen for yield and other traits when the populations are in advanced inbred generation, e.g., F6 generation.
Grade.
11
buyers, and are the parameters that determine the suitability of peanuts as whole in-shell or shell edible kernels, oil extraction and milling processes. All of this facilitates trade and avoid misunderstandings during purchase and sale. A description of procedures that standardize the different classifications of peanut stocks by the Federal State Inspection Service (FSIS), supervised by the USDA can be found in Davison et al., Chapter 15, in Pattee and Young (Eds.) 1982, and the Farmers Stock Trading Rules from the American Peanut Shellers Association, 2016.
Diseases.
Susceptibility to pathogens, namely fungi, nematodes, bacteria and viruses are the main causes in reduced plant reproduction, development and quality that result in
significantly reduced yields. The use of pesticides greatly improves the tolerance of cultivars when exposed to these pathogens. However, every year the cost of pesticide use has
increased, and growers are concerned about excess application of chemical disease controls. The most viable alternative to use of such chemicals is the use of germplasm sources that provide genetic host-plant resistance in new cultivars being developed (Norden et al., in Pattee and Young (Eds.), 1982; Fehr, 1993; Stalker, 1997; Isleib et al., 2001; Singh and Nigam, 2016). Use of disease resistant cultivars should result in the minimal use of
12
(SB) caused by S. minor Jagger, and tomato spotted wilt (TSW) caused by the Tomato spotted wilt tospovirus.
Official evaluation.
13
14
REFERENCES
Acquaah, G. 2007. Principles of plant genetics and breeding. ISBN 10:1-4051-3646-4. Blackwell Publishing Ltd. MA, USA.
Ahmed, E.M., and C.T. Young. 1982. Composition, quality, and flavor of peanuts. In Pattee, H.E., and C.T. Young (eds.). Peanut Sci. and Technology. p. 655-688. Am. Peanut Res. Educ. Soc. Yoakum, TX.
Akhtar, S., N. Khalid, I. Ahmed, A. Shahzad, and H. Suleria. 2014. Physicochemical
characteristics, functional properties, and nutritional benefits of peanut oil: a review. Crit. Rev. Food Sci. Nutr. 54: 1562-1575. [doi:10.1080/10408398.2011.644353]. American Peanut Council. About peanuts: the peanut industry, peanut types and production.
Available from: https://www.peanutsusa.com/about-peanuts/the-peanut-industry3/9-peanut-types-and-production.html. (Accessed May 2016).
Andersen, P.C., and D.W. Gorbet. 2002. Influence of year and planting date on fatty acid chemistry of high oleic acid and normal peanut genotypes. J. Agric. Food Chem. 50: 1298-1305.
Bishi, S.K., L. Kumar, M.C. Dagla, M.K. Mahatma, A.L. Rathnakumar, H.B. Lalwani, and J.B. Misra. 2013. Characterization of Spanish peanut germplasm (Arachis hypogaea L.) for sugar profiling and oil quality. Ind. Crops Prod. 51: 46–50.
[doi:http://dx.doi.org/10.1016/j.indcrop.2013.08.050].
Carrín, M.E., and A.A. Carelli. 2010. Peanut oil, compositional data: A review. Eur. J. Lipid Sci. Technol. 112: 697-707. [doi: 10.1002/ejlt.200900176].
Dean, L.L., and J.P. Davis. 2016. Peanut composition, flavor and nutrition, p. 289-346. In Stalker, H.T., and R.F. Wilson (eds.). Peanuts, genetics, processing, and utilization. AOCS Press. Elsevier Publ. Inc. Amsterdam, Netherlands.
15
Dillehay, T.D., J. Rossen, T.C. Andres, and D.E. Williams. 2007. Preceramic adoption of peanut, squash, and cotton in northern Peru. Science 316: 1890-1893. [doi: http://science.sciencemag.org/content/316/5833/1890].
Doyle, J.J. 2004. Legume phylogeny: Context for the family, major groups, and the relationships of crop and model species, p. 30-59. In Stalker, H.T., Brummer, E.C., and R.F. Wilson (eds). Legume Crop Genomics. AOCS Press. Champaign, Ill. [https://doi.org/10.1201/9781439822265.ch1].
Fehr, W.R. 1993. Principles of cultivar development. Vol. 1. Macmillan Publ. Co., NY, USA. ISBN 0-07-020345-8.
Gabriele, M., L. Chalup, G. Robledo, and G. Seijo. 2012. Genetic and geographic origin of domesticated peanut as evidenced by 5S rDNA and chloroplast DNA sequences. Plant Syst. Evol. 298:1151-1165. [doi: 10.1007/s00606-012-0627-3].
Isleib, T.G., and S.C. Copeland. 2015. Personal communication. Isleib, T.G., and S.C. Copeland. 2016. Personal communication.
Isleib, T.G., C.C. Holbrook, and W. Gorbet. 2001. Use of plant introductions in peanut cultivar development. Peanut Sci. 28:96-113. [doi: https://doi.org/10.3146/i0095-3679-28-2-11].
Isleib, T.G., P.W. Rice, R.W. Mozingo II, R.W. Mozingo, J.E. Bailey, and H.E. Pattee. Registration of ‘Perry’ peanut. 2003. Crop Sci. 43:739-740.
[doi:10.2135/cropsci2003.7390].
Isleib, T.G., S.R. Milla-Lewis, H.E. Pattee, S.C. Copeland, M.C. Zuleta, B.B. Shew, J.E. Hollowell, T.H. Sanders, L.O. Dean, K.W. Hendrix, M. Balota, and J.W. Chapin. 2011. Registration of ‘Bailey’ peanut. J. Plant Reg. 5: 27-39.
[doi:10.3198/jpr2009.12.0742crc].
Johnsen, P.B., G.V. Civille, J.R. Vercellotti, T.H. Sanders, and C.A. Dus. 1988.
16
Jordan, D.L., R.L Brandenburg, A.B. Brown, S.G. Bullen, G.T. Roberson, and B. Shew. 2015. Peanut Information. North Carolina Cooperative Extension, Coll. of Agric. & Life Sci. N.C. State Univ. 167 p.
Kochert, G., H.T. Stalker, M. Gimenes, L. Galgaro, C.R. Lopes, and K. Moore. 1996. RFLP and cytogenetic evidence on the origin and evolution of allotetraploid domesticated peanut, Arachis hypogaea (Leguminosae). Am. J. Bot. 83:1282–1291. [doi:
10.2307/2446112].
Krapovickas, A., and W.C. Gregory. 2007. Taxonomy of the genus Arachis (Leguminosae). Translated by D.E. Williams and C.E. Simpson. Bonplandia (Suppl.) 16: 1-205. Lavin, M., R.T. Pennington, B.B. Klitgaard, J.I. Sprent, H.C. De Lima, and P.E. Gasson.
2001. The Dalbergioid legumes (Fabaceae): delimitation of a pantropical monophyletic clade. Am. J. Bot. 88: 503-533.
Linnaeus, von C. 1753. Species Plantarum. Laurentii Salviae, Holmiae. Tomus II. 741 p. Marzolo, G. Peanuts. Ag. Marketing Resource Center. Available from:
http://www.agmrc.org/commodities-products/nuts/peanut-profile/ (Accessed May 2016).
Matlock, R.S. 1968. Research on peanut quality. Proc. Fifth Nat. Peanut Res. Conf., Norfolk, VA, p. 41-54. [available: apresinc.com/publications/]
Mozingo, R.W., S.F. O’Keefe, T.H. Sanders, and K.W. Hendrix. 2004. Improving shelf life of roasted and salted in-shell peanuts using high-oleic fatty acid chemistry. Peanut Sci. 31: 40-45. [doi: http://dx.doi.org/10.3146/pnut.31.1.0009].
Norden, A.J., D.W. Gorbet, D.A. Knauft, and C.T. Young. 1987. Variability in oil quality among peanut genotypes in the Florida USA breeding program. Peanut Sci. 14, 7-11. Norden, A.J., O.D. Smith, and D.W. Gorbet. 1982. Breeding of the cultivated peanut.
Chapter four, p. 95-122. In Pattee H.E. and C.T. Young (eds.). Peanut Science and Technology. Am. Peanut Res. Educ. Soc. Yoakum, TX. Available from:
17
Ouppadissakoon, C., and C.T. Young. 1984. Modeling of roasted peanut flavor for some Virginia-type peanuts from amino acid and sugar contents. J. Food Sci. 49: 52-58. [doi:10.1111/j.1365-2621.1984.tb13667.x].
Sikinarum, J., P. Jaisil, S. Jogloy, B. Toomsan, T. Kermala, T., and A. Patanothai. 2007. Heritability and correlation for nitrogen (N2) fixation and related traits in peanut (Arachis hypogaea L.). Pakistan J. Biol. Sci. 10:1956-1962.
[doi:10.3923/pjbs.2007.1956.1962].
Stalker, H.T. Peanut (Arachis hypogaea L.). 1997. Field Crops Research 53: 205-217. [doi:10.1016/S0378-4290(97)00032-4].
Stalker, H.T., and R.F. Wilson (eds.). 2016. Peanuts, genetics, processing, and utilization. AOCS Press. Elsevier Publ. Inc. Amsterdam, Netherlands. ISBN 978-1-63067-038-2.
Stalker, H.T., E.C. Brummer, and R.F. Wilson. 2004. Legume phylogeny: context for the family, major groups, and the relationships of crop and model species, p. 30-59). In: Wilson, R. F., H.T. Stalker, and E.C. Brummer (eds), Legume Crop Genomics. AOCS Press. Champaign, Ill. [https://doi.org/10.1201/9781439822265.ch1]. Sundaram, J., C.V. Kandala, R.A. Holser, C.L. Butts, and W.R. Windham. 2010.
Determination of in-shell peanut oil and fatty acid composition using near-infrared reflectance spectroscopy. J. Am. Oil Chem. Soc. 87: 1103–1114.
[doi:10.1007/s11746-010-1589-7].
United States Department of Agriculture (USDAa). Foreign Agricultural Service. Available from: https://apps.fas.usda.gov/PSDOnline/Circulars/2017/05/production.pdf
(Accessed May 2017).
United States Department of Agriculture (USDAb). Foreign Agricultural Service. Available from: https://apps.fas.usda.gov/PSDOnline/Circulars/2017/05/Oilseeds.pdf (Accessed May 2017).
18
Wynne, J.C., R.W. Mozingo, and D.A. Emery. 1986. Registration of ‘NC 9’ peanut. Crop Sci. 26: 197. [doi:10.2135/cropsci1986.0011183X002600010050x].
19
Chapter II
20
ABSTRACT
21
22
INTRODUCTION
The Bailey cultivar.
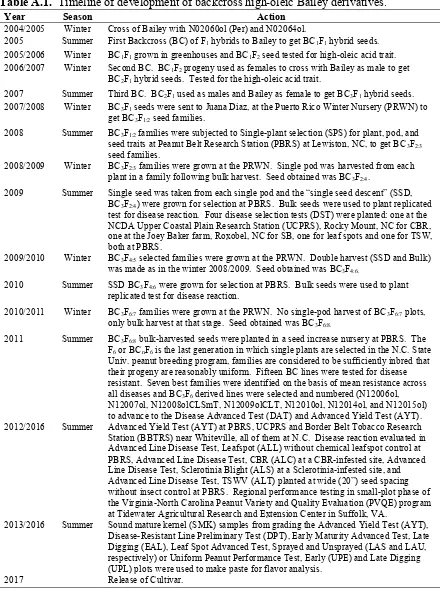
In 1998, the peanut breeding program initiated a series of crosses to emphasize the incorporation of disease resistance to its new cultivar releases, and addition to improved pod and seed characteristics. An accelerated winter nursery located in Puerto Rico known as the “Puerto Rico Winter Nursery” or “PRWN”, helped to achieve two life cycles per calendar year to produce enough seeds of progenies to be tested for diseases and to selection for resistance in North Carolina. The Bailey peanut cultivar (Isleib et al., 2011) was the first release in 2008 from the first cycle of this accelerated program and had partial resistance to four diseases that occurred regularly in the VC area including: leaf spots caused by
Cercospora arachidicola Hori (early leaf spot) and Cercosporidium personatum (Berk. & M.A. Curtis) Deighton (late leaf spot), Cylindrocladium black rot (CBR) caused by C. parasiticum (Berk. & M.A. Curtis) Deighton, Sclerotinia blight (SB) caused by S. minor Jagger, and tomato spotted wilt (TSW) caused by Tomato spotted wilt tospovirus (Isleib et al., 2011). Bailey has become very popular in the VC area and along with peanut cultivar Sugg (the second release from the accelerated program) accounted in 2011 about 47% of the certified acreage, 60% in 2012, and approximately 74% of the total acreage in the VC area in 2015 (data obtained from the N.C. Crop Improvement Assoc.). Shellers have expressed concern that Bailey’s pod and seed sizes are not larger than two formerly widely grown cultivars ‘NC-V 11’ and ‘VA 98R’ (Wynne et al., 1991 and Mozingo et al., 2000,
23
into Bailey. Fifteen of these backcross derivatives were tested for disease resistance in 2011, assigned accession numbers, and entered into yield testing in 2012. Seven of the lines were retained for further testing. The objectives of this research were (1) to characterize the performance of high-oleic experimental Bailey derivative lines and compare those
performances with the recurrent parent Bailey cultivar, and (2) to identify the best(s) high-oleic Bailey derivative in terms of agronomic traits: yield, grade and disease resistance.
MATERIALS AND METHODS
Germplasm (Experimental Lines).
A backcrossing program was undertaken to develop a high-oleic version of Bailey. In the winter of 2004-2005, Bailey was crossed as a female to high-oleic breeding line
24
subjected to single-plant selection at the NCDA Peanut Belt Research Station (PBRS) in the summer of 2008. BC3F2:3 families from selected plants were grown at the PRWN in the winter of 2008-2009, and a single pod was harvested from each plant in a family before harvesting the rest of the family in bulk. A single seed was taken from each single pod, and the “single-seed descent” (SSD) seeds were used to plant a BC3F2:4 selection nursery plot at PBRS for each family, and bulk-harvested seeds were used to plant replicated tests for disease reaction in North Carolina in the spring of 2009. Four disease selection tests (DST) were planted: one at the NCDA Upper Coastal Plain Research Station (UCPRS) near Rocky Mount, NC, in Edgecombe Co. for CBR, one at the Joey Baker farm near Roxobel, NC, in Bertie Co. for SB, one for leaf spots and one for TSW, both at PBRS. Each test included 69 selected BC3F2:4 families as well as families from the two previous cycles of the program as well as a set of cultivars and disease check germplasms, there were 196 total test entries and a 14x14 simple square lattice designs were used for all four tests. After evaluation of disease reaction, single-plant selection was practiced within the selected families in the BC3F2:4 single-seed descent nursery at PBRS. There were 27 selected BC3F4:5 families, they were grown at the PRWN in the winter of 2009-2010. Again double harvest was made: single-pod-per-plant harvest first, bulk harvest second. The BC3F4:6 SSD seeds were planted in the spring of 2010 in a selection nursery plots at PBRS and also planted for evaluation in the four disease trials using the bulk-harvested seed. Plot configurations were the same as in the previous year, with the difference that there were a total of 182 entries arranged in 14x13 double rectangular lattice designs. After disease evaluation, superior families were
25
in the winter of 2010-2011. There was no single-pod harvest of BC3F6:7 plots, only bulk harvest at that stage. The BC3F6:8 bulk-harvested seeds were planted in a seed increase nursery at PBRS in the spring of 2011, as were the four disease trials. Plot configurations were the same as in the previous year. The F6 or BCnF6 is the last generation in which single plants are selected in the N.C. State Univ. peanut breeding program, families are considered to be sufficiently inbred that their progeny are reasonably uniform. There were a total of 225 entries arranged in a 15x15 simple square lattice designs. The seven best families were identified on the basis of mean resistance across all diseases and BC3F6 derived lines were selected and numbered (N12006ol, N12007ol, N12008olCLSmT, N12009olCLT, N12010ol, N12014ol, and N12015ol) to advance to the Disease Advanced Test (DAT) and Advanced Yield Trial (AYT) series starting in 2012. Data from the North Carolina trials were collected and stored in databases maintained by the program. All seven lines were tested in the multi-state Peanut Variety and Quality Evaluation (PVQE) program (2014 to 2016), coordinated by Dr. Maria Balota of Virginia Tech’s Tidewater Agricultural Research and Extension Center (AREC) in Suffolk, VA (Balota et al., 2016, 2017). The databases maintain information of the different tests in which lines were included since 2012.
Description of disease selection tests and evaluation of BC3F2:4 and BC3F4:6 families.
26 Leaf spot.
For the leaf spot test, plots consisted of single rows 7.3 m in length spaced 91 cm apart with seeds planted 25 cm apart. No leaf spot fungicide was applied to the plots, allowing the disease to infest the test. Prior to harvest, defoliation ratings were made on a 1-to-9 proportional scale with a score of 1 denoting no defoliation, a score of 5 approximately 50% defoliation, and a score of 9 complete defoliation, usually accompanied by death of the plants.
Cylindrocladium black rot (CBR) and Sclerotinia blight (SB).
For the CBR and SB tests, plots were single rows 3.7 m in length with 25 cm seed spacing. No metam sodium fumigant was applied to the CBR test before planting. No fluazinam or boscalid fungicide was applied to the SB test to control the disease. Stand counts were made four to five weeks after planting, and symptomatic plants were counted for each plot. Counts were converted to a proportion of plants present for analysis of variance.
Tomato spotted wilt (TSW).
27 Statistical Analysis for DST series.
Lines from the BC3F2:4 families were included in 196 entries arranged in a 14x14 simple square lattice, BC3F4:6 in 182 entries arranged in a 14x13 rectangular lattice and BC3F6:8 families in 225 entries arranged in a 15x15 simple square lattice designs all with two replications for the four tests. The lines were structured in blocks, and blocks were randomly assigned within the lattices. Data were analyzed using the general linear models procedure (PROC GLM) of the SAS® statistical software package (SAS® Inst., Cary, NC). Predicted means (“least squares means” or “LSMEANS” in SAS® jargon) for the four diseases were converted to a zero-to-one scale, with zero assigned to the worst line in the test and one to the best. These transformed scores were then averaged and the best 20% in the group of families were identified.
Description of disease advanced tests and evaluation of BC3F6 Bailey high-oleic
lines.
28 Yield.
All seven lines were included in the Advanced Yield Test (AYT) series in which yield and grade were measured from the sprayed two-rep tests at three locations per year: PBRS at Lewiston, UCPRS at Rocky Mount, and the Border Belt Tobacco Research Station (BBTRS) near Whiteville, all of them in N.C. In the AYT series, there were numerous entries, so two-rep lattice designs were used, square or rectangular depending on the number of entries in a given year. Plot size was two 7.3 m rows at 91 cm spacing with seeds spaced 25 cm apart within rows. Recommended cultural practices were used for this test series including application of chemicals to control diseases when possible. Yield was also measured from the Disease Advanced tests for leaf spots. Yield was measured at harvest from each plot and converted to kg ha-1 for statistical analysis.
Grade.
29
Statistical Analysis for Diseases, Yield and Grade.
Databases maintained by the breeding program were subset to include data on individual plot values for Bailey and the breeding lines N12006ol, N12007ol,
N12008olCLSmT, N12009olCLT, N12010ol, N12014ol, and N12015ol. Databases
included: agronomic trials (yield and grade), disease trials (leaf spots, CBR, SB, TSW), and flavor evaluations. Because the objective of this research was to identified overall
differences among Bailey and its high-oleic derivatives, the data obtained were highly unbalanced for years and replications within the tests for the eight germplasms. Each of the traits was analyzed using the mixed models procedure (PROC MIXED) using SAS® Ver. 9.4 software (SAS® Inst., Cary NC) as a randomized complete block design. The analysis was performed considering germplasm as the only fixed effect. The effects of years, locations, tests and reps were considered to be random. Stand count was used as a covariate for yield and value per hectare. For each trait, model residual plots were used to check for normality. Only TSW required transformation of the values by taking the square root of the total
30
effects were considered significant if the adjusted probability of the difference was less than or equal to 0.05, and the best line(s) was identified.
RESULTS AND DISCUSSION
Agronomic Performance: Disease Reactions.
31
methodology applied for the introgression of the high-oleic trait to improve the fatty acid profile of Bailey appears to have no effect on its resistance as the results obtained suggest (Fig. 2.1).
Yield and Grade
32
sum of TSMK and OK, was a special case that presented a significant effect for germplasm. A multiple comparison correction indicated that none of the lines was different from Bailey. Neither was any one different from the others. We accounted for that there was probably a difference between two means, as is the assumption of Fisher’s protected least square difference or LSD reflected by the significant effect of germplasm (P = 0.0465). However, Einot and Gabriel (1975) suggested that Fisher’s assumption does not simultaneously control the overall or experimentwise error rate, that in our case was control at the 5% significance level. When we looked at the unadjusted probabilities, five pairs of means were found to be different, but after the Tukey-Kramer correction, none of them was. The average weighted mean of the Hunter L score of pod brightness for jumbo and fancy was not different (P = 0.560), nor was the jumbo to fancy ratio (P = 0.731) (Table 2.4).
CONCLUSION
In developing backcross high-oleic Bailey derivatives, it appears that there are some lines with good characteristics to be considered for a suitable replacement of the widely grown cultivar Bailey. Overall, none of the lines performed worse than Bailey, but clearly a few agronomic traits were identified that could be primary reasons to consider whether or not a line was sufficiently superior to meet the needs of farmers, industry and consumers.
33
no direct comparison to be made of performances in greenhouses versus real experimental fields where the cultivars are intended to be grown, the analysis could provide insights of the reaction of the high-oleic lines to CBR. Even though line N12009olCLT was not
significantly different in percent content of jumbo pods compared to Bailey (P = 0.067), the significantly higher content of super extra-large kernels can play in its favor, due to the desire of the processing industry for gourmet products that can be made from super extra-large kernels. Additionally. the fact that N12014ol has significantly higher seed weight than Bailey but not higher content of jumbo pods compared with N12007ol, we have speculated that there is the possibility that N12014ol has thinner pods and resources of nutrients can be translocating to the cotyledons of seeds increasing their weight. This speculation can be of interest for future research. Thinner pods could present a disadvantage in the sense that they can be broken more easily during transport from farms to shelling or processing facilities taking into consideration not excessive dryness of the pods. N12007ol could have thicker pods. However, we did not study thickness of the pods and this reasoning can be of interest for future research, to study if there exists any association between pod thickness and seed weight. On the other hand, the in-shell market demands high content of jumbo pod and brightness, Balota et al., (2014) determined that Bailey had great brightness but low content of jumbo pod compared to cultivars NC 12C and Gregory. These results indicate that line N12007ol not only possessed higher content of jumbo pods but also it was not different in regard to brightness measured by Hunter L score color value. This characteristic is
34
35
REFERENCES
Acquaah, G. 2007. Principles of plant genetics and breeding. ISBN 10:1-4051-3646-4. Blackwell Publishing Ltd. MA, USA.
Balota, M., T.G. Isleib, and J.W. Chapin. 2014. Description and performance of the Virginia market type peanut cultivars. Virginia Cooperative Extension, Virginia Tech. Publication 432-201. Accessed online: October 2017 in
https://pubs.ext.vt.edu/content/dam/pubs_ext_vt_edu/432/432-201/432-201_pdf.pdf Balota, M., T.G. Isleib, J. Oakes , and D. Anco. 2016. Peanut Variety and Quality
Evaluation results, 2016. I. Agronomic and grade data. Va. Polytechnic Inst. State Univ. / Va. Agric. Exp. Sta. / Tidewater Agric. Res. Ext. Ctr. Inf. Ser. No. 510, 42 p. Balota, M., T.G. Isleib, J. Oakes , and D. Anco. 2017. Peanut Variety and Quality
Evaluation results, 2016. I. Quality data. Va. Polytechnic Inst. State Univ. / Va. Agric. Exp. Sta. / Tidewater Agric. Res. Ext. Ctr. Inf. Ser. No. 511, 45 p.
Bishi, S.K., L. Kumar, M.C. Dagla, M.K. Mahatma, A.L. Rathnakumar, H.B. Lalwani, and J.B. Misra. 2013. Characterization of Spanish peanut germplasm (Arachis hypogaea L.) for sugar profiling and oil quality. Ind. Crops Prod. 51: 46–50.
[doi:http://dx.doi.org/10.1016/j.indcrop.2013.08.050].
Cowart, D., S. Powell., M. Locke., R. Starling., and J. Takash.. 2016. Raw peanut
processing. In Peanuts, genetics, processing, and utilization. Stalker, H.T., and R.F. Wilson (eds.). AOCS Press. Elsevier Publ. Inc. Amsterdam, Netherlands. ISBN 978-1-63067-038-2.
Einot, I. and Gabriel, K. R. 1975. A study of the powers of several methods of multiple comparisons. J. Am.Statistical Ass. Vol. 70, 351a, 1975. [doi:
https://doi.org/10.1080/01621459.1975.10482474].
36
Isleib, T.G., C.C. Holbrook, and W. Gorbet. 2001. Use of plant introductions in peanut cultivar development. Peanut Sci. 28:96-113. [doi: https://doi.org/10.3146/i0095-3679-28-2-11].
Isleib, T.G., P.W. Rice, R.W. Mozingo II, R.W. Mozingo, J.E. Bailey, and H.E. Pattee. Registration of ‘Perry’ peanut. 2003. Crop Sci. 43:739-740.
[doi:10.2135/cropsci2003.7390].
Isleib, T.G., S.R. Milla-Lewis, H.E. Pattee, S.C. Copeland, M.C. Zuleta, B.B. Shew, J.E. Hollowell, T.H. Sanders, L.O. Dean, K.W. Hendrix, M. Balota, and J.W. Chapin. 2011. Registration of ‘Bailey’ peanut. J. Plant Reg. 5: 27-39.
[doi:10.3198/jpr2009.12.0742crc].
Jordan, D.L., R.L Brandenburg, A.B. Brown, S.G. Bullen, G.T. Roberson, and B. Shew. 2015. Peanut Information. North Carolina Cooperative Extension, Coll. of Agric. & Life Sci. N.C. State Univ. 167 p.
Kramer, C.Y. 1956. Extension of multiple range tests to group means with unequal numbers of replications. Biometrics, 12: 307–310. [doi: 10.2307/3001469].
Marzolo, G. Peanuts. Ag. Marketing Resource Center. Available from:
http://www.agmrc.org/commodities-products/nuts/peanut-profile/ (Accessed May 2016).
Mozingo, R.W., T.A. Coffelt, and T.G. Isleib. 2000. Registration of ‘VA 98R’ peanut. Crop Sci. 40: 1202-1203. [doi:10.2135/cropsci2000.0051rcv].
Norden, A.J., O.D. Smith, and D.W. Gorbet. 1982. Breeding of the cultivated peanut. Chapter four, p. 95-122. In Pattee H.E. and C.T. Young (eds.). Peanut Science and Technology. Am. Peanut Res. Educ. Soc. Yoakum, TX. Available from:
https://apresinc.com/publications/peanut-science-and-technology/peanut-science-and-technology-table-of-contents/.
37
Pattee, H.E., F.G. Giesbrecht, and R.W. Mozingo. 1993. A note on broad-sense heritability of selected sensory descriptors in Virginia-type Arachis hypogaea L. Peanut Sci. 1993, 20: 24-26.
Sikinarum, J., P. Jaisil, S. Jogloy, B. Toomsan, T. Kermala, T., and A. Patanothai. 2007. Heritability and correlation for nitrogen (N2) fixation and related traits in peanut (Arachis hypogaea L.). Pakistan J. Biol. Sci. 10:1956-1962.
[doi:10.3923/pjbs.2007.1956.1962].
Stalker, H.T. Peanut (Arachis hypogaea L.). 1997. Field Crops Research 53: 205-217. [doi:10.1016/S0378-4290(97)00032-4].
Stalker, H.T., and R.F. Wilson (eds.). 2016. Peanuts, genetics, processing, and utilization. AOCS Press. Elsevier Publ. Inc. Amsterdam, Netherlands. ISBN 978-1-63067-038-2.
Wynne, J.C., T.A. Coffelt, R.W. Mozingo, and W.F. Anderson. 1991. Registration of ‘NC-V11’ peanut. Crop Sci. 31:484-485.
Wynne, J.C., R.W. Mozingo, and D.A. Emery. 1979. Registration of NC 7 peanut (Reg. No. 22). Crop Sci. 19: 563. [doi:10.2135/cropsci1979.0011183X001900040037x]. Wynne, J.C., R.W. Mozingo, and D.A. Emery. 1986. Registration of ‘NC 9’ peanut. Crop
Sci. 26: 197. [doi:10.2135/cropsci1986.0011183X002600010050x].
38
Table 2.1. Disease reaction of Bailey and backcross high-oleic derivatives to Leaf Spots, TSW and SB.
Germplasm Leaf Spot
‡ Tomato Spotted Wilt‡ Sclerotinia Blight‡
Defoliation*NS %NS Corrected
Incidence*NS IncidenceNS IncidenceNS
N12015ol 4.35±0.81 0.42±0.10 0.40±0.07 0.16 0.50±0.09
N12014ol 5.10±0.81 0.51±0.10 0.36±0.07 0.13 0.69±0.09
N12010ol 4.36±0.78 0.42±0.10 0.42±0.07 0.18 0.50±0.09
N12009olCLT 4.52±0.82 0.44±0.10 0.29±0.06 0.09 0.42±0.08
N12008olCLSmT 3.99±0.78 0.37±0.10 0.36±0.06 0.13 0.55±0.08
N12007ol 3.86±0.78 0.36±0.10 0.43±0.07 0.19 0.53±0.09
N12006ol 3.69±0.78 0.34±0.10 0.34±0.07 0.12 0.51±0.09
Bailey 4.02±0.74 0.38±0.09 0.38±0.05 0.15 0.62±0.06
Mean 4.24 0.40 0.37 0.14 0.54
‡ Leaf spot reaction measured in plots with no chemical control of leafspot. SB
measured in separate trials conducted in naturally infested fields with no application
of boscalid [2-chloro-N-(4′-chlorobiphenyl-2-yl) nicotinamide], and with any plant
expressing symptoms of the specific disease counted as a “dead or diseased” plant. TSW incidence measured in trials conducted with wide (51 cm) seed spacing, with
no chemical control of thrips (Frankliniella fusca Hinds) at any time during the
growing season.
* Defoliation score: 1 = none to 9 = complete. Corrected incidence: square root of original incidence.
NS Denotes traits for which germplasm means were not found to differ (P≤0.05) by
F-test. Means and one standard error are reported.
39
Table 2.2. Covariance parameter estimates and significance for traits of pod characteristics and yield.
Parameter
Pod Trait
Content Brightness
Jumbo Fancy Farmer Stock Fancy Pods Jumbo Fancy Yield
──────────────── % ──────────────── ─────── Hunter L ────── Kg ha
-1
Year 93.26±79.54NS ─ 313.86±235.79† 12.65±12.12NS ─ 293284±309377NS
Location ─ ─ ─ ─ ─ ─
Year×Location ─ 74.05±58.95NS ─ ─ 17.93±8.40* ─
Test(Year×Location) 52.67±23.98* 45.06±37.61NS 50.44±24.41* 12.58±5.66* 2.86±2.22† 374496±169625*
Rep(Year×Loc×Test) 1.76±2.92NS 2.36±2.52NS 5.63±5.28NS 1.23±0.88† 0.25±0.29NS ─
Year×Loc×Test(Year×Loc) ─ ─ ─ ─ ─ ─
Germplasm×Year ─ ─ ─ ─ 0.48±0.31† ─
Germplasm×Loc ─ ─ ─ ─ ─ ─
Germplasm×Year×Loc 3.07±4.48NS 6.84±3.75* ─ ─ ─ 82445±45666*
Germplasm×Test(Year×Loc) ─ ─ ─ ─ ─ ─
Residual 44.49±5.96** 33.33±4.32** 69.86±7.03** 6.90±0.76** 3.37±0.37** 423761±51243**
** P≤0.01 * P≤0.05 † P≤0.1
40
Table 2.3. Comparison of Bailey and backcross high-oleic derivative lines of graded pod characteristics and yield.
Germplasm of 100 PodsWeight NS Foreign MaterialNS Jumbo Pod Content Fancy Pod Content
g ───────────────────% ─────────────────
N12015ol 232.13±10.10 1.29±0.69 22.71±4.88ab 40.33±3.22ab
N12014ol 246.31±10.10 1.29±0.69 24.68±4.88ab 40.79±3.22ab
N12010ol 243.27±10.05 1.21±0.68 21.49±4.86ab 42.85±3.21a
N12009olCLT 246.63±10.04 1.32±0.68 25.10±4.86ab 43.03±3.21a
N12008olCLSmT 242.34±10.01 1.13±0.68 23.14±4.85ab 40.05±3.20ab
N12007ol 246.80±10.05 1.08±0.68 25.87±4.86a 41.75±3.21a
N12006ol 236.63±10.22 1.16±0.69 24.99±4.90ab 40.35±3.26ab
Bailey 235.30±09.95 1.74±0.68 19.61±4.84b 35.27±3.19b
Mean 241.18 1.28 23.45 40.56
a,b Germplasm trait means followed by the same letter in the same column are not different (P≤0.05) by Tukey Kramer adjustment.
41
Table 2.3. Continued.
Germplasm
Farmer Stock Fancy Pods
Jumbo Pod
Brightness BrightnessFancy Pod NS
Jumbo to Fancy Ratio
contentNS Pod Yield
NS
Content Weighted Average pod BrightnessNS
% ────────────── L ────────────── Kg ha-1
N12015ol 63.27±8.28a 45.22±1.44 41.92±1.91ab 45.00±1.33 0.59±0.12 4218±361
N12014ol 65.96±8.28a 44.75±1.44 43.18±1.90a 45.17±1.35 0.63±0.12 4160±361
N12010ol 64.84±8.27a 45.15±1.44 42.43±1.90ab 45.67±1.34 0.52±0.12 4100±359
N12009olCLT 68.56±8.27a 44.65±1.44 42.58±1.89ab 45.16±1.33 0.62±0.12 3955±359
N12008olCLSmT 63.71±8.26a 44.52±1.44 41.63±1.89ab 45.56±1.34 0.63±0.12 4208±357
N12007ol 68.03±8.27a 44.79±1.44 42.41±1.89ab 45.83±1.34 0.65±0.12 4151±359
N12006ol 65.77±8.30a 44.73±1.45 42.44±1.92ab 45.23±1.34 0.61±0.12 4285±366
Bailey 55.75±8.25b 45.10±1.44 40.83±1.89b 45.74±1.34 0.58±0.12 4057±355
Mean 64.48 44.86 42.18 45.42 0.60 4142
a,b Germplasm trait means followed by the same letter in the same column are not different (P≤0.05) by Tukey Kramer adjustment.
42
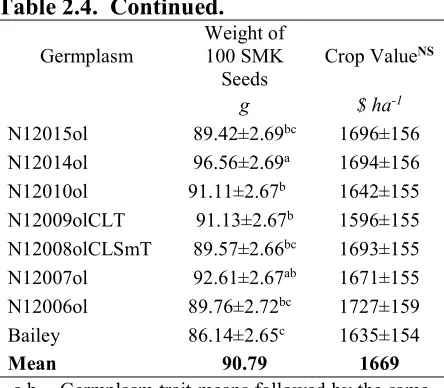
Table 2.4. Comparison of Bailey and backcross high-oleic derivative lines of seed characteristics and crop value.
Germplasm
Loose Shelled
KernelsNS
Super
Extra-Large kernels Extra-Large Kernels
Sound Mature
KernelsNS
Sounds
SplitsNS
Total Sound Mature Kernels
NS
Other
KernelsNS ContentMeat NS
─────────────────────────────────── % ───────────────────────────────────
N12015ol 0.57±0.12 7.60±2.27d 36.58±2.99d 66.68±1.67 3.89±0.94 70.63±0.84
1.95±0.29 72.55±0.55
N12014ol 0.38±0.12 14.43±2.27ab 46.52±2.99a 66.94±1.67 4.17±0.94 71.31±0.84 1.78±0.29 73.07±0.55
N12010ol 0.39±0.12 13.77±2.27b 44.41±2.98ab 66.08±1.66 4.20±0.93 70.39±0.84 1.70±0.28 72.05±0.55
N12009olCLT 0.56±0.12 17.02±2.27a 46.62±2.98a 65.92±1.66 4.59±0.93 70.61±0.83 1.75±0.28 72.34±0.55
N12008olCLSmT 0.67±0.12 15.26±2.26ab 44.23±2.97ab 65.95±1.66 4.40±0.93 70.58±0.83 1.83±0.28 72.39±0.55
N12007ol 0.52±0.12 15.92±2.27ab 46.90±2.98a 65.75±1.66 4.46±0.93 70.41±0.84 1.86±0.28 72.22±0.55
N12006ol 0.58±0.13 13.85±2.29b 41.44±3.00bc 66.77±1.67 4.04±0.94 70.93±0.85 1.66±0.29 72.55±0.56
Bailey 0.58±0.12 10.70±2.26c 39.33±2.97cd 66.98±1.66 4.13±0.93 71.16±0.83 1.81±0.28 72.93±0.54
Mean 0.53 13.57 43.25 66.39 4.23 70.75 1.79 72.51
43
Table 2.4. Continued.
Germplasm Weight of 100 SMK
Seeds
Crop ValueNS
g $ ha-1
N12015ol 89.42±2.69bc 1696±156
N12014ol 96.56±2.69a 1694±156
N12010ol 91.11±2.67b 1642±155
N12009olCLT 91.13±2.67b 1596±155
N12008olCLSmT 89.57±2.66bc 1693±155
N12007ol 92.61±2.67ab 1671±155
N12006ol 89.76±2.72bc 1727±159
Bailey 86.14±2.65c 1635±154
Mean 90.79 1669
a,b Germplasm trait means followed by the same letter in the same column are not different (P≤0.05) by Tukey-Kramer adjustment NS Denotes traits for which germplasm means
44
Figure 2.1. Distribution of disease reaction means and standard errors of leaf spot (A), Sclerotinia blight (B), and tomato spotted wilt (C). *Tomato spotted wilt is the corrected scale transformation (square root of proportion of symptomatic plants). 0.0 0.1 0.2 0.3 0.4 0.5 0.6 0.7 0.8 N 1 2 0 1 5 o l N 1 2 0 1 4 o l N 1 2 0 1 0 o l N 1 2 0 0 9 o lC L T N 1 2 0 0 8 o lC L S m T N 1 2 0 0 7 o l N 1 2 0 0 6 o l B a il e y C an no py A ff ec te d (% ) Leaf Spot
F = 2.21 P = 0.06
A 0.0 0.1 0.2 0.3 0.4 0.5 0.6 0.7 0.8 N 1 2 0 1 5 o l N 1 2 0 1 4 o l N 1 2 0 1 0 o l N 1 2 0 0 9 o lC L T N 1 2 0 0 8 o lC L S m T N 1 2 0 0 7 o l N 1 2 0 0 6 o l B a il e y In ci de nc e Sclerotinia Blight
F = 1.56 p = 0.158
B 0.0 0.1 0.2 0.3 0.4 0.5 0.6 0.7 0.8 N 1 2 0 1 5 o l N 1 2 0 1 4 o l N 1 2 0 1 0 o l N 1 2 0 0 9 o lC L T N 1 2 0 0 8 o lC L S m
T N12
0 0 7 o l N 1 2 0 0 6 o l B a il e y C or re ct ed In ci de nc e*
Tomato Spotted Wilt
F = 0.83 P = 0.5721
45
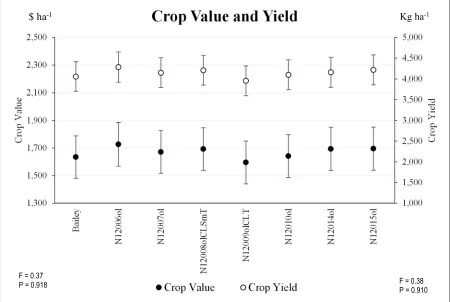
Figure 2.2. Distribution of crop value and yield for Bailey and the high-oleic lines. No differences detected at the 5% significance level.
1,000 1,500 2,000 2,500 3,000 3,500 4,000 4,500 5,000 1,300 1,500 1,700 1,900 2,100 2,300 2,500 B ai le y N 12 00 6o l N 12 00 7o l N 12 00 8o lC L S m T N 12 00 9o lC L T N 12 01 0o l N 12 01 4o l N 12 01 5o l C ro p Y ie ld C ro p V al ue
Crop Value and Yield
Crop Value Crop Yield
$ ha-1 Kg ha-1
F = 0.37
P = 0.918 F = 0.38
46
47
ABSTRACT
type peanut (Arachis hypogaea L.) cultivars are grown in the Virginia-Carolina “VC” area comprising Va., N.C., and S.C. for gourmet markets and direct human consumption. Flavor has been identified by processors of Virginia- and runner-type peanuts as the pre-eminent trait of importance in marketing finished products. Flavor was measured for the popular normal-oleic cultivar ‘Bailey’ and seven backcross-derived high-oleic lines (N12006ol, N12007ol, N12008olCLSmT, N12009olCLT, N12010ol, N12014ol, and N12015ol). The samples came from nine different trials from 2012 to 2015 conducted entirely on the coastal plain of N.C., and they were processed and submitted to a trained descriptive sensory panelin the Sensory Service Center at N.C. State Univ. from 2013 to 2016. The data were analyzed using a mixed models procedure. One of the high oleic lines scored significantly higher than Bailey for roasted peanut (N12014ol 4.94 vs 4.41 flavor intensity units or “fiu”, P=.013). Although the other six high-oleic lines were not statistically different from Bailey, all of them were numerically higher. With respect to the sweet
attribute, two lines were statistically superior to Bailey (N12014ol 4.47 vs 4.03 fiu, P=.012 and N12009olCLT 4.40 vs 4.03 fiu, P=.03). One line was superior to Bailey for nutty aftertaste (N12014ol 3.98 vs 3.59 fiu, P=.041). These results represented a positive
48
49
INTRODUCTION
Flavor.
Different methods of sensory evaluation exist within the sensory science discipline. These methods can be applied to a wide array of products, and comprise a variety of
powerful tools to evaluate the perceived responses of the human senses (hearing, sight, smell, taste, and touch) to a product, such as foods or materials. Flavor is a very complex
characteristic of foods. In general, flavor is a combination of taste, smell, and an interaction between volatiles and the trigeminal nerve, one of the twelve cranial nerves, that connects mucous membranes of the eyes, nose and mouth (Walker, 1990). Descriptive sensory analyses are broad in product evaluation due to the various characters or qualitative aspects of a specific product such as aroma, texture, appearance, flavor and others that can be measured or quantified (Lawless and Heymann, 2010). Historically, there has been a wide array of sensory descriptive techniques developed to objectively evaluate and described food products, an extensive description of some of them such as the Flavor Profile®, Texture Profile Method, Quantitative Descriptive AnalysisTM, the SpectrumTM method (Murray et al., 2001, Lawless and Heymann, 2010, Meilgaard et al., 2006). Because of the complex
chemical basis of roasted peanuts, flavor evaluation has been done by the application of discriminative and descriptive sensory methods, through the use of a highly trained
50
meaning of the concept words of the lexicon to create a frame of reference for the panel as a group (Murray et al., 2001) to operate as a tuned instrument, further, the individual panelists function as an individual sensor of a machine (Drake, 2007). Drake and Civille (2003) and Lawless and Civille (2013) give a detailed review and process on how to develop lexicons. The assessment of flavor in the peanut industry has evolved since the early 1950s, Picket and Holley (1952), Matlock (1968) implemented the Critical Laboratory Evaluation Roast
(CLER) method that later in 1971 was officially adopted by APREA, the American Peanut Research and Education Association, Inc. now APRES, the American Peanut Research and Education Society. Improvement continued with the development of the first peanut flavor lexicon by Oupadissakoon and Young (1984) based on the Flavor Profile method. Johnsen et al., (1988) overcame the deficiencies of the lexicon of Oupadissakoon and Young and
51
MATERIALS AND METHODS
Germplasm.
The full description of germplasm developments was presented in Chapter II.
Peanut Roasting and Grinding.
52
(lower score), then the second set of eight subsamples was roasted, adjusting the roast duration upward or downward as indicated.
Sensory Analysis.
Paste samples were submitted to the sensory trained panel in the Dept. of Food, Bioprocessing, and Nutritional Sciences at N.C. State Univ. under the direction of Dr. MaryAnne Drake. Samples were stored at -10°C prior to tasting. Before each session of evaluation, the samples were thawed before tasting. Samples were assigned to each panel session (12 or 13 samples each) and the order of tasting samples within sessions was randomly assigned. Assignment of samples to sessions was performed to minimize the standard error of a difference between two breeding line means measured in a given “tasting” year. All of the panelists tasted each roasted paste sample independently and assigned a whole-number score to it for intensities of a number of sensory attributes: roasted peanut, over-roast (also called “dark roast”), under-roast (also called “raw beany”), sweet,
woody/hulls/skins, fruity/fermented, painty/rancid, stale/cardboard, moldy, petroleum, bitter, tongue/throat burn, astringent mouth feel, nutty aftertaste, and bitter aftertaste
(Ouppadissakoon and Young, 1984; Johnsen et al., 1988). All intensities were expressed on a 14-point scale from 1 (not perceptible) to 14 (most intense) for each panelist. The sample values averaged across panelists were added to the database of N.C. State Univ. flavor data. For this test, the raw data were extracted from the database to conduct the analysis.
Statistical Analysis.
53
N12008olCLSmT, N12009olCLT, N12010ol, N12014ol, and N12015ol. Because the objective of this research was to identify overall differences between Bailey and its high-oleic derivatives, the data obtained were highly unbalanced for years and replications of the eight germplasms. Each of the traits was analyzed using the mixed models procedure (PROC MIXED) using SAS Ver. 9.4 software (SAS Inst., Cary NC). The analysis was performed considering germplasm and panelist as fixed factors. The effects of years, locations, tests and samples were considered random. Roasted color (linear and quadratic effects) and fruity/fermented score were examined as potential covariates for roasted peanut, sweet, bitter and under roast attributes (Pattee et al., 1991, 1997; Pattee and Giesbrecht, 1994). For each attribute, model residual plots were used to check for normality. The initial model included the two fixed-effect design factors germplasm and panelists while and all the remaining factors and their interactions were considered random. When any effect was not estimable by the model it was removed manually from the model. Significance of effects was tested by constructing Satterthwaite F ratios. When all effects were estimable, among the information criteria statistics, the Akaike Information Criterion, corrected (AICc) was considered to decide if an effect should be removed from or kept in the model. When a final model was determined, modeling of a covariance structure was determined (Littell et al., 1997), and Bailey was contrasted with the average mean of the high-oleic lines, and if a significant difference was detected, variation among the high-oleic lines and Bailey was tested
54
RESULTS AND DISCUSSION
During the roasting of peanuts hundreds of different volatile compounds are
generated that are carried by water vapor, thus, peanuts dehydrate and generate pigmentation by different chemical reactions like Maillard, protein denaturation, sugar caramelization and lipid oxidation. These volatiles and pigments largely define peanut flavor through a very complex chemical process (Davis and Dean, 2016). Because the molecular basis of peanut profile flavor is far from certain, the following results are not based on a biochemical essay but on scores assigned by a trained descriptive sensory panel.
The high-oleic lines were BC3F6 derived lines, and they were expected to have recovered over 90% of the genome of their recurrent parent (Fehr, 1993), which in this case was Bailey, and one would expect to see similar responses. Variation among germplasms for the sensory attributes was assessed taking into account the assumption that score intensities within a specific germplasm sample are more correlated than others from another germplasm. In this study, effects associated with germplasm and panelists were structured (Table 3.1). Because multiple evaluations were assessed from a particular peanut paste sample, modeling a covariance structure is important for the correct analysis (Littell et al., 1997). Nevertheless, the goal of the introgression of the high-oleic trait is at least to recover a better line or be equal or similar in performance compared to Bailey. The group of backcross-derived high-oleic lines are not significantly different than Bailey for roasted peanut attribute, with exception of line N12014ol (P = 0.013, Table 3.2, Fig. 3.1). Even though not all of them were significantly higher than Bailey for roasted peanut score, all mean scores were
55
better than the recurrent parent. Pattee and co-workers (1993), determined that the minimum difference, detectable by panelists with direct comparison for roasted peanut flavor is 0.5 flavor intensity units (fiu). The only line that surpassed this value was N12014ol (Table 3.2). Even though the remaining lines were not statistically different than Bailey, and the
56
for the off-flavor over-roast, painty, moldy (Table 3.3). Other attributes, petroleum and astringent did not differ between Bailey and high-oleic lines. However, although these differences were not significant it is worth mentioning that N12014ol always scored numerically better than Bailey with exception in the over-roast attribute.
CONCLUSION
In general terms, it is evident that the high oleic lines were not significantly worse than Bailey in performance for all attributes. However, one line, N12014ol was clearly superior for the most critical important attributes roasted peanut, sweet, nutty and bitter. Furthermore, N12014ol was superior to Bailey for two negative attributes, stale/cardboard often associated with lipid oxidation and under-roast attribute. However, no significant differences were observed for the painty attribute that is sometimes associated with the instability of oil of immature peanuts (Sanders et al., 1989). Because N12014ol was superior to Bailey for the critical attributes, we concluded that the painty attribute was masked by them and the panelists could not detect any significant difference. On the basis of these results, incorporation of the high-oleic acid trait in N12014ol could be the baseline to
57
58
REFERENCES
Charalambous, G. (ed.). 1992. Off-flavors in foods and beverages. Elsevier Sci. Publ. B.V. Amsterdam, Netherlands.
Davis, J.P., K.M. Price, L.L. Dean, D.S. Sweigart, J.M. Cottonaro, and T.H. Sanders. 2016. Peanut oil stability and physical properties across a range of industrially relevant oleic acid/linoleic acid ratios. Peanut Sci. 43: 1-11. [doi: 10.3146/PS14-17.1].
Dean, L.L., and J.P. Davis. 2016. Peanut composition, flavor and nutrition, p. 289-346. In Stalker, H.T., and R.F. Wilson (eds.). Peanuts, genetics, processing, and utilization. AOCS Press. Elsevier Publ. Inc. Amsterdam, Netherlands.
Dean, L.L., K.W. Hendrix, C.C. Holbrook, and T. H. Sanders. 2009. Content of some nutrients in the core of the core of the peanut germplasm collection. Peanut Sci. 36: 104-120. [https://doi.org/10.3146/PS07-103.1].
Drake, M.A. 2007. Invited review: sensory analysis of dairy foods. J. Dairy Sci., 90: 4925-4937. [doi:10.3468/jds.2007-0332].
Drake, M.A., and G.V. Civille. 2003. Flavor lexicons. Comp. Rev. Food Sci. and Food Safety, 2: 33-40. [doi:10.1111/j.1541-4337.2003.tb00013.x]
Fehr, W.R. 1993. Principles of cultivar development. Vol. 1. Macmillan Publ. Co., NY, USA. ISBN 0-07-020345-8.
Isleib, T.G., H.E. Pattee, T.H. Sanders, K.W. Hendrix, and L.O. Dean. 2006. Compositional and sensory comparisons between normal- and high-oleic peanuts. J. Agric. Food Chem. 54:1759-1763. [doi:10.1021/jf052353t].
Johnsen, P.B., G.V. Civille, J.R. Vercellotti, T.H. Sanders, and C.A. Dus. 1988.
Development of a lexicon for the description of peanut flavor. J Sens. Studies, 3: 9-17. [doi:10.1111/j.1745-459X.1988.tb00426.x].
Lawless, L.J.R., and G.V. Civille. 2013. Developing lexicons: a review. J. Sens. Stud. 28: 270-281. [doi:10.1111/joss.12050].
Lawless, H.T., and H. Heymann. 2010. Sensory evaluation of food: principles and
59
Littell, R.C., Henry, P.R., and C.B. Ammerman. 1997. Statistical analysis of repeated measures data using SAS procedures. J. Anim. Sci. 76: 1216-1231.
Meilgaard, M., C.V. Civille, and B.T. Carr. 2006. Sensory evaluation techniques. Fourth Edition, CRC Press. Boca Raton, FL.
Mozingo, R.W., S.F. O’Keefe, T.H. Sanders, and K.W. Hendrix. 2004. Improving shelf life of roasted and salted in-shell peanuts using high-oleic fatty acid chemistry. Peanut Sci. 31: 40-45. [doi: http://dx.doi.org/10.3146/pnut.31.1.0009].
Mugendi, J., C. Sims, D. Gorbet, and S. O’Keefe. 1998. Flavor stability of high-oleic peanuts stored at low humidity. J. Am. Oil Chem. Soc. 75, 21–25.
[doi:10.1007/s11746-998-0004-0].
Murray, J.M., C.M. Delahunty, and I.A. Baxter. 2001. Descriptive sensory analysis: past, present and future. Food Res. Int. Vol. 34, 06:461-471. [doi:
https://doi.org/10.1016/S0963-9969(01)00070-9]
Ory, R.L., K.L. Crippen, and N.V. Lovegren. 1992. Off-flavors in peanuts and peanut products. In Charalambous, G. (ed.). Off-flavors in foods and beverages. Elsevier Sci. Publ. B.V. Amsterdam, Netherlands.
Ouppadissakoon, C., and C.T. Young. 1984. Modeling of roasted peanut flavor for some Virginia-type peanuts from amino acid and sugar contents. J. Food Sci. 49: 52-58. [doi:10.1111/j.1365-2621.1984.tb13667.x].
Pattee, H.E. (ed.). 1985. Evaluation of quality of fruits and vegetables. Springer
Science+Business Media, NY. ISBN 978-1-4612-9588-4. [doi:10.1007/978-1-4613-2549-9]
Pattee, H.E., and C.T. Young (eds.). 1982. Peanut Science and Technology. Am. Peanut Res. Educ. Soc. Yoakum, TX.
60
Pattee, H.E., D.K. Salunkhe, S.K. Sathe, N.R. Reddy, and L.O. Robert. 1983. Legume lipids. CRC Crit. Rev. Food Sci. Nutr. 17: 97-139.
[doi:10.1080/10408398209527345].
Pattee, H.E., F.G. Giesbrecht, and C.T. Young. 1991. Comparison of peanut butter color determination by CIELAB L* and Hunter color-difference methods and the
relationship of roasted peanut color to roasted peanut flavor response. J. Agric. Food Chem. 39: 519-523
Pattee, H.E., F.G. Giesbrecht, and R.W. Mozingo. 1993. A note on broad-sense heritability of selected sensory descriptors in Virginia-type Arachis hypogaea L. Peanut Sci. 1993, 20: 24-26.
Pattee, H.E., and F.G. Giesbrecht. 1994. Adjusting roasted peanut attribute scores for fruity attribute and non-optimum CIELAB L* values. J. Sensory Stud. 9: 353-363.
Pattee, H.E., T.G. Isleib, and F. G. Giesbrecht. 1997. Genotype-by environment interaction in sweet and bitter sensory attributes of peanut. Peanut Sci. 24: 117-123.
Pattee, H.E., T.G. Isleib, D.W. Gorbet, K.M. Moore, Y. Lopez, M.R. Baring, and C.E. Simpson. 2002. Effect of the high-oleic trait on roasted peanut flavor in backcross-derived breeding lines. J. Agric. Food Chem. 50:7362-7362.
Sanders, T.H., Vercellotti, J.R., Crippen, K.L., and Civille, G.V. 1989. Effect of maturity on roast color and descriptive flavor of peanuts. J. Food Sci. 54: 475.
Walker, H.K. 1990. Cranial nerve V: the trigeminal nerve, p. 328-321). In Walker, H.K., Hall, W.D., and J.W. Hurst (eds). Clinical Methods: The History, Physical, and Laboratory Examinations, 3rd Edition. Boston: Butterworths, Bostom, Mass. Available from: http://www.ncbi.nlm.nih.gov/books/NBK384/.