Charge and the dry-strength performance of polyampholytes. Part 3. Streaming potential analysis
21
0
0
Full text
(2) 1. Introduction In Part 1 of this series [1] it was shown that treatment of a bleached kraft fiber slurry with amphoteric terpolymers resulted in greater dry-strength, compared with treatment of the same fiber slurry with the respective (simple) polyelectrolytes having a single charge. Also it was reported that addition of low amounts of polyaluminum chloride (PAC) was generally beneficial to the performance of the polyampholytes as dry-strength agents. By contrast, such treatment reduced the dry-strength when used in conjunction with simple polyelectrolytes of either sign of charge. It was proposed that a subtle balance of complexation phenomena, hydrodynamic size, and effective electrokinetic charge might account for some of these observations. In the present article we report results of complementary experiments with a model substrate consisting of non-porous glass microfibers that help to explain these effects. In comparison to cellulosic surfaces, glass is expected to have a geometrically simpler surface, possibly facilitating interpretation of the results, because the possibility of polyelectrolytes penetrating into the porous structure in fibers is avoided. Furthermore, silica (and mica) are well-known substrates frequently used in studies of polyelectrolyte adsorption [2-5]. They also have been used as models to understand adsorption behaviors onto fibers, as well as of interactions between polymer-covered surfaces [6-7]. Streaming potential (SP) measurements provide a powerful tool with which to study electrokinetic effects of polymer adsorption onto particles or fibers in aqueous suspension. Relative to some other kinds of electrokinetic measurements, SP tests in fiber suspensions are quick and direct, being based on signals that originate at the surfaces of the filterable solids [8-11]. When applying such tests to the case of. 2.
(3) polyampholyte molecules adsorbing onto cellulosic surfaces, various issues ought to be considered: If the adsorbing polyelectrolyte has near-equal numbers of positive and negative groups, can it still be effective in altering the measured streaming potential of the solids? Will coverage of the solid surfaces by polyampholytes tend to drive the streaming potential toward lower absolute values? Is it possible to detect evidence of molecular rearrangement, with time, so that segments having higher density of positive groups eventually are enriched at the polyampholyte-substrate interface? Despite the fact that aluminum compounds are widely used in combination with polyampholytes for enhancing the dry strength of paper and to promote dewatering during the forming process [12-14], little is known about how the presence of aluminum compounds affects the electrokinetic effects resulting from polyampholyte treatment of fibers in suspension. Therefore, the synergistic effects of PAC with polyampholytes were also investigated. Based on past work [15-17] it is reasonable to expect that adsorbed high-mass polymers will have a dominant effect on the electrokinetic properties of suspended particles or fibers. Such a dominant influence is consistent with the high affinity of many high molecular mass water-soluble polymers with surfaces, over a wide range of conditions [18-19]. Because ion-containing polymers of high molecular mass adsorb in the form of trains and, most importantly, with loops and tails projecting outwards from the surfaces [2-3], their effect on the electrostatic potential at the plane of shear (zeta potential) can be quite large as compared not only with the original, uncovered surfaces but also to the case of lower molecular weight polymers [16-17]. Past studies have. 3.
(4) suggested that treatment levels in the range of 1%, based on solid mass, may be sufficient to completely obscure the original electrokinetic nature of suspended solids [20-22]. Figure 1 gives a schematic representation of how a high-mass polyampholyte might be expected to rearrange after it is adsorbed on a substrate having a negative charge. Even if the ordering of monomer groups along the macromolecular chain is completely random, one still can expect there to be segments that happen to be enriched in either positive or negative charged groups [23-24]. Any differences in the reactivities of monomeric groups with each other or with contrasting monomeric groups will favor further enrichment of charged groups within different segments [25]. While there is a need for methods capable of detecting non-uniform distributions of charged groups within charged polymers, it is reasonable to look for evidence of such distributions by practical experiments. Thus, in Fig. 1, one can expect segments rich in positively charged ionic groups to orient themselves to be close to a substrate of opposite charge [26-27]. As shown in the figure, such reconformation can be expected to result in a gradual depletion of positive groups, on average, on segments that are extending away from the surface. If the model shown in Fig. 1 is valid, then one ought to expect a decay in streaming potential to less positive or more negative values, relative to the initial SP values achieved following treatment of the negative surfaces with polyampholyte molecules.. 4.
(5) Polyampholyte in solution. Initial adsorbed conformation. Conformation after rearrangement. Adsorption. Negatively Charged Substrate. Time. Time. Fig. 1. Schematic representation of expected conformational changes following adsorption of a high-mass, linear polyampholyte in which the distribution of charged groups is segregated. 2. Experimental Experiments were conducted in deionized water prepared with an ion-exchange system from Pureflow, Inc. The poly-aluminum chloride (PAC) was Compozil Eka ATC 8210 from Eka Chemicals, Paper Chemicals Div. The product was added on an asreceived basis. Other inorganic chemicals all were of reagent grade.. 2.1 Polymer Preparation and Characterization The compositions of polyampholyte and simple polyelectrolyte samples synthesized for this study are shown in Table 1. The preparation and analysis of samples A through D, F, and G were described in Part 1 of this series [1]. Preparation and analysis of polyampholyte samples H-1 and H-2 likewise were described elsewhere [28]. Briefly stated, both of these sets of research materials were prepared by free-radical polymerization, using ammonium persulfate as a radical initiator. Reactions were carried out at 60 oC with stirring under a nitrogen atmosphere. 5.
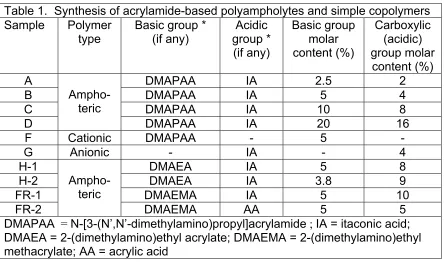
(6) Polyampholytes FR-1 and FR-2 were prepared in our laboratories by free-radical polymerization with the monomer compositions shown in Table 1. The monomers were first dissolved in 100ml deionized water in a three-necked flask equipped with a reflux condenser and a bubble sparger, which was used to inject argon at room temperature for 60 min. After adding ammonium persulfate, the reaction was allowed to proceed at 85oC for one hour. After cooling, the viscous polymer solution was precipitated in excess methanol. The polymer was collected by filtration and dried under vacuum at 40oC for 2 days. The chemical structures and charge densities of the polymers obtained were confirmed using NMR in D2O solution. Table 1. Synthesis of acrylamide-based polyampholytes and simple copolymers Sample Polymer Basic group * Acidic Basic group Carboxylic type (if any) group * molar (acidic) (if any) content (%) group molar content (%) A DMAPAA IA 2.5 2 AmphoB DMAPAA IA 5 4 teric C DMAPAA IA 10 8 D DMAPAA IA 20 16 F Cationic DMAPAA 5 G Anionic IA 4 H-1 DMAEA IA 5 8 AmphoH-2 DMAEA IA 3.8 9 teric FR-1 DMAEMA IA 5 10 FR-2 DMAEMA AA 5 5 DMAPAA = N-[3-(N’,N’-dimethylamino)propyl]acrylamide ; IA = itaconic acid; DMAEA = 2-(dimethylamino)ethyl acrylate; DMAEMA = 2-(dimethylamino)ethyl methacrylate; AA = acrylic acid 2.2 Streaming Potential Tests Streaming potential experiments, to determine the effects of polyampholytes on the electrokinetic nature of the fiber surfaces, were carried out with the SPJ device described elsewhere [29]. Briefly stated, 7.5g of fibers and a certain amount of. 6.
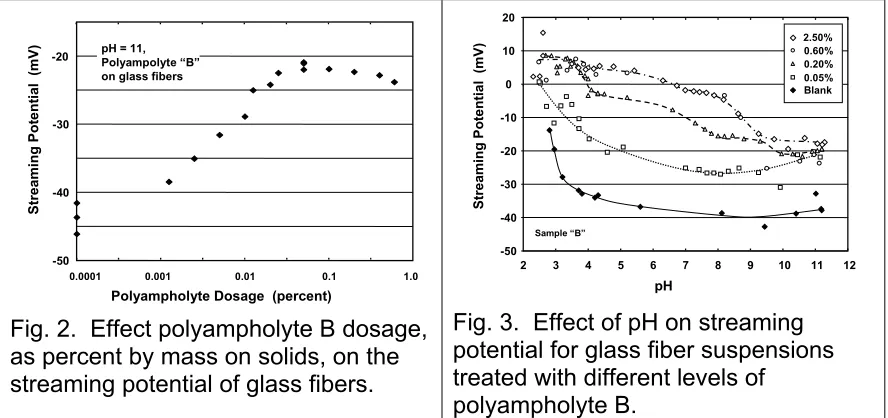
(7) polyampholyte solution (0.1%) were added to 750ml water with background electrolyte. The pH was adjusted with dilute solutions of HCl or NaOH. The background electrolyte, except where noted otherwise, was sodium bicarbonate (10-4 M) (to stabilize the pH near to the neutral point) and sodium sulfate to achieve an electrical conductivity of 1000 µS/cm (23 oC). “Salt-free” conditions were similarly prepared, but without sodium sulfate. Streaming potentials were evaluated with an applied pressure of 207 kPa. To avoid complications involving the nanoporous nature of cellulosic fibers, all of the streaming potential reported here were obtained with suspensions of glass microfibers, product C-50-R from Lauscha Fibre International of Sommerville, SC. The fibers had a nominal thickness of about 4 µm and were 4 mm in length. Though such fibers have a negative surface charge, as do cellulosic fibers, the surfaces are not fibrillated and the fines content in aqueous suspension is negligible. Previous work showed advantages of using such fibers to study the mode of action of dual-polymer dry-strength systems [30]. 3. Results and Discussion 3.1 Effect of Polyampholytes on Streaming Potential of Glass Fibers Figure 2 shows the results of an initial test carried out to determine the range of treatment levels over which one of the polyampholytes (B) had significant effects on streaming potential. As shown, the untreated fibers at pH=11 had a negative charge, which is consistent with previous findings [30-31]. Addition of a solution of the moderately low-charge polyampholyte B yielded significant changes in SP over the dosage range 0.001 to about 0.03%, based on the dry mass of fibers. As noted before, the charge density and structure of this polymer was confirmed by NMR analysis (see Table. 7.
(8) 1). Further increases in treatment yielded little further change, which suggests a saturated condition of the surfaces [32]. The results in Fig. 2 reveal how adsorption of a net-negative polyampholyte at high pH, where fibers also have a net-negative charge, may actually reduce the absolute value of streaming potential (SP). The reduction in the absolute value of SP was achieved despite the fact that negative carboxylate groups are expected to dominate the charged nature of the polyampholyte, for instance at pH=11. The effect on SP is tentatively attributed to the coverage of the substrate by polymer segments that have a lower net charge density, compared to that of glass, and also due to the presence of tails and loops of polymer extending outwards from the substrate into the solution phase [1617]. Figure 3 shows how polyampholyte treatment at different levels affected the SP of glass fibers at different values of pH. Results for the “blank” confirm the expectation that the glass surfaces in aqueous solution is strongly negative above a pH of about 3. As the pH is decreased below 3, the remaining silanol groups are expected to become protonated, achieving neutrality at about 2.5 [31]. The family of curves corresponding to treatment with the moderately low-charge polyampholyte B shows a progressive shift in SP values with increasing dosage. It appears that a treatment level of 0.6%, based on fiber mass, was enough to achieve a limiting value. At intermediate pH values the addition of polyampholyte tended to neutralize the apparent charge of the surfaces, achieving near-zero value of SP at high levels of treatment. The addition of polyampholyte under acidic conditions showed greater effectiveness for neutralization of. 8.
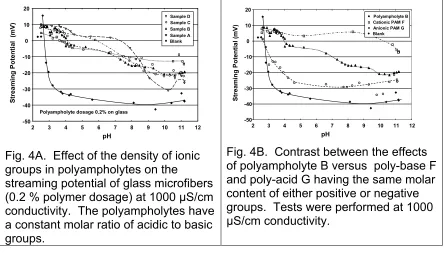
(9) the surface charge of the oppositely charged fiber, which is attributed to a stronger electrostatic attraction. Previous work has shown various instances in which drainage, retention, sizing, or dry-strength results were maximized when the zeta potential of the fiber furnish was near to zero, due to adjustments in the amounts of added chemicals [33-37]. The present results suggest that the reported effectiveness of polyampholytes as dewatering aids [12,38-40] also may be associated with their tendency to reduce absolute values of the zeta potential in the papermaking systems to which they are added.. -20. pH = 11, Polyampolyte “B” on glass fibers. Streaming Potential (mV). Streaming Potential (mV). 20. -30. -40. 2.50% 0.60% 0.20% 0.05% Blank. 10 0 -10 -20 -30 -40 Sample “B”. -50. -50 0.0001. 0.001. 0.01. 0.1. 2. 1.0. 3. 4. 5. 6. 7. 8. 9. 10. 11. 12. pH. Polyampholyte Dosage (percent). Fig. 3. Effect of pH on streaming potential for glass fiber suspensions treated with different levels of polyampholyte B.. Fig. 2. Effect polyampholyte B dosage, as percent by mass on solids, on the streaming potential of glass fibers.. Figure 4 shows a series of results all obtained at the treatment level of 0.2% polymer, based on the mass of glass microfibers. Results for polyampholyte samples of increasing charge density are shown in Fig. 4A. Despite an eight-fold increase in charge density, based on monomeric groups within the series of polyampholytes A through D, it is clear that all of the polyampholytes produced similar changes in the streaming potential of the glass microfibers. Nevertheless, the highest-charge polyampholyte, sample D, yielded SP values that were more positive below pH=8 and more negative above ca.. 9.
(10) pH=9, compared to the lesser-charged polyampholytes. The opposite was true for polyampholyte A, the lowest-charge polyampholyte, still noting that the ratio of basic to acidic groups on this series of polyampholytes was held constant. Part B of Fig. 4 shows comparative results for polyampholyte sample B and the single polyelectrolytes having the same molar proportions of either acidic or basic functional groups. In contrast to treatment with the polyampholyte, the cationic and anionic polyelectrolytes (F and G, respectively) yielded streaming potential values that were almost independent of pH in the range of about 5 to 9. Thus, sample F, the cationic copolymer, yielded positive SP values at pH values below about 10. At yet higher pH it is expected that most of the tertiary amine groups are not charged. The anionic polyelectrolyte G yielded SP values less negative than that of the untreated glass. Again, the most likely explanation is that polymer segments extending outwards from the glass surface tend to dominate the electrokinetic properties, at least partly obscuring the original electrokinetic nature of the bare substrate.. 20 Sample D Sample C Sample B Sample A Blank. 10 0. Streaming Potential (mV). Streaming Potential (mV). 20. -10 -20 -30 -40. Polyampholyte B Cationic PAM F Anionic PAM G Blank. 10 0 -10 -20 -30 -40. Polyampholyte dosage 0.2% on glass. -50. 2. 3. 4. 5. 6. 7. 8. 9. 10. 11. -50 2. 12. Fig. 4A. Effect of the density of ionic groups in polyampholytes on the streaming potential of glass microfibers (0.2 % polymer dosage) at 1000 µS/cm conductivity. The polyampholytes have a constant molar ratio of acidic to basic groups.. 3. 4. 5. 6. 7. 8. 9. 10. 11. 12. pH. pH. Fig. 4B. Contrast between the effects of polyampholyte B versus poly-base F and poly-acid G having the same molar content of either positive or negative groups. Tests were performed at 1000 µS/cm conductivity.. 10.
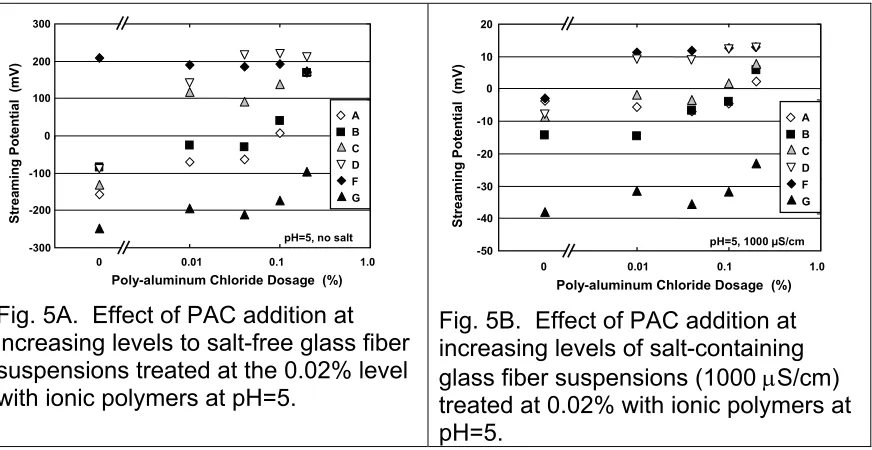
(11) 3.2 Synergistic Effects of PAC and Polyampholytes The effects on streaming potential of the addition of PAC are illustrated in Fig. 5 for pH=5, considering the same polymer solutions discussed before. As a generalization, the streaming potentials in the presence of polyampholyte solutions were affected to a greater extent by the PAC addition, compared to those obtained in the presence of simple polyelectrolyte solutions. Thus, in Fig. 5A, increasing PAC addition caused a change from negative to positive streaming potential for systems treated with polyampholytes A through D. At pH=5 the polyampholytes of higher density of ionic groups (increasing by factors of 2 in the order A through D) tended to start out with less negative streaming potentials and end up at higher positive streaming potentials, even exceeding the streaming potential resulting from the addition of the cationic polyelectrolyte. By contrast, the system with the cationic polyelectrolyte, sample F, appeared unaffected by PAC addition. The system involving sample G, the anionic polyelectrolyte, became somewhat less negative with increasing addition of PAC, but the net sign of potential remained negative. Results in Fig. 5B pertain to tests carried out with sufficient sodium sulfate so that the conductivity was 1000 µS/cm. The screening effect of the added salt is evident in the much smaller range of values on the vertical axis scale. Though the results generally are consistent with the same explanations given in the previous paragraph, there is one puzzling feature. That is, at zero PAC addition the system treated with the cationic polyelectrolyte F had a negative value of streaming potential. The best explanation for this observation is that aluminum species were able to interact with silanol groups at uncovered areas on the fiber surfaces, making the system more positive. This. 11.
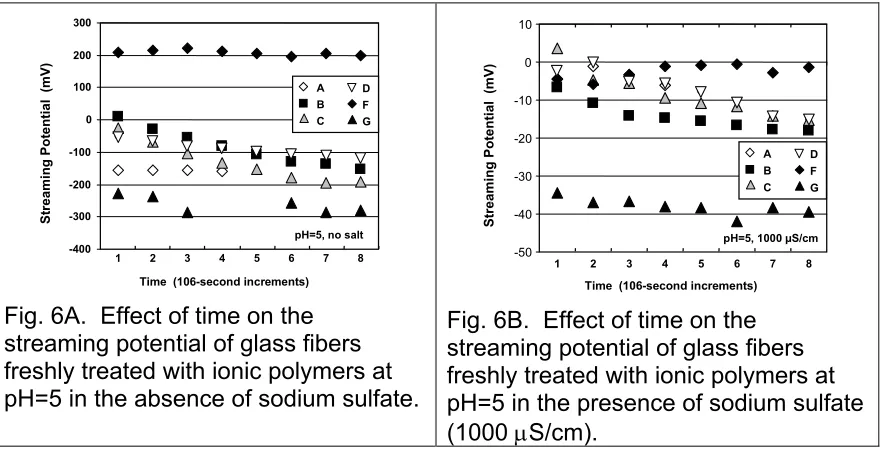
(12) interpretation is consistent with supplementary tests carried out with glass fibers and PAC addition in the absence of organic polymers. Results similar to those shown in Fig. 5 also were obtained in solutions having a pH of 4. Briefly stated, the effects due to PAC addition were less important at the lower pH. A likely explanation is that there aluminum species have a lower tendency to. 300. 20. 200. 10. Streaming Potential (mV). Streaming Potential (mV). polymerize and adsorb onto fiber surfaces at the lower pH value [41-44].. 100 A B. 0. C D. -100. F G. -200. 0 A. -10. B C. -20. D F. -30. G -40. pH=5, no salt. -300 0. 0.01. 0.1. 0. Poly-aluminum Chloride Dosage (%). Fig. 5A. Effect of PAC addition at increasing levels to salt-free glass fiber suspensions treated at the 0.02% level with ionic polymers at pH=5.. pH=5, 1000 µS/cm. -50. 1.0. 0.01. 0.1. 1.0. Poly-aluminum Chloride Dosage (%). Fig. 5B. Effect of PAC addition at increasing levels of salt-containing glass fiber suspensions (1000 µS/cm) treated at 0.02% with ionic polymers at pH=5.. Results shown in Fig. 6 help to answer one of the questions that was raised in the introduction, namely, whether there is evidence of molecular rearrangement following initial adsorption of polyampholytes onto fibers. As shown in Fig. 6A, the streaming potentials of systems treated with polyampholyte B through D in the absence of salt all showed decays of streaming potential toward more negative values with increasing time. Such results are consistent with a rearrangement favoring more of the cationic ionic groups facing the fiber surfaces. Such a rearrangement is expected to result in a disproportionate density of negatively charged macromolecular groups facing outwards,. 12.
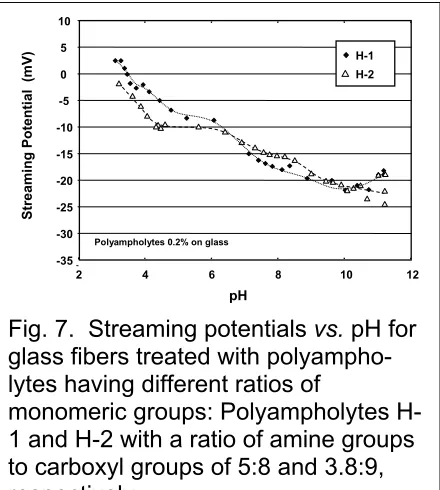
(13) consistent with the experimental results. No significant decay in streaming potential was observable in the case of the cationic polyelectrolyte F, or the lowest-charge polyampholyte A. Results in Fig. 6B show the same general trends in the case of tests carried out in the presence of sodium sulfate.. 300. 10. 100 0. A. D. B. F. C. G. Streaming Potential (mV). Streaming Potential (mV). 200. -100 -200 -300. 0 -10 -20 -30. 1. 2. 3. 4. 5. 6. 7. F. C. G. pH=5, 1000 µS/cm. -50. 8. Time (106-second increments). Fig. 6A. Effect of time on the streaming potential of glass fibers freshly treated with ionic polymers at pH=5 in the absence of sodium sulfate.. D. B. -40. pH=5, no salt -400. A. 1. 2. 3. 4. 5. 6. 7. 8. Time (106-second increments). Fig. 6B. Effect of time on the streaming potential of glass fibers freshly treated with ionic polymers at pH=5 in the presence of sodium sulfate (1000 µS/cm).. Figure 7 shows results of a follow-up test in which the ratio of acidic to basic groups (polyampholytes H-1 and H-2) was varied. The molar compositions of these polyampholytes are shown in Table 1. Polyampholyte H-1 with a ratio of 5 amine groups to 8 carboxyl groups was compared with polyampholyte H-2 with a ratio of 3.8 amine groups to 9 carboxyl groups. As shown, the largest differences in charge effects were encountered at relatively low pH. Thus, below about pH=6, the sample that was richer in amine groups yielded SP values that were less negative.. 13.
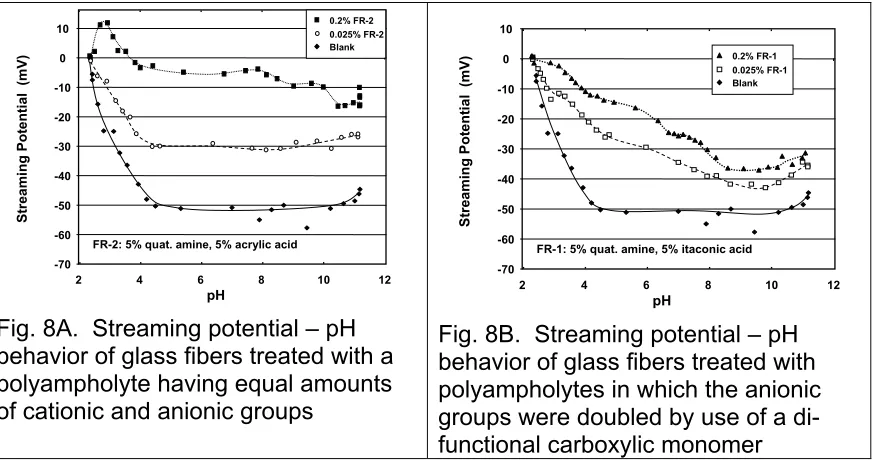
(14) Streaming Potential (mV). 10 5. H-1 H-2. 0 -5 -10 -15 -20 -25 -30. Polyampholytes 0.2% on glass. -35 2. 4. 6. 8. 10. 12. pH. Fig. 7. Streaming potentials vs. pH for glass fibers treated with polyampholytes having different ratios of monomeric groups: Polyampholytes H1 and H-2 with a ratio of amine groups to carboxyl groups of 5:8 and 3.8:9, respectively. In a further confirmation of the explained effect of the charge balance, two polyampholyte samples were prepared with the level of tertiary amine groups held constant, but with a two-fold difference in the proportion of carboxyl groups (polyampholyte samples FR-1 and FR-2). As shown in Fig. 8, a doubling of the carboxyl group content so that it was twice the level of amine groups shifted the resulting streaming potentials to lower values, especially at pHs above 6. As in the case of the polyelectrolyte F (see Fig. 3B), the polyampholyte FR-2 yielded SP values that were almost pH-independent in the pH range between about 5 and 9. By contrast, FR-1, the polyampholyte having the high level of carboxyl groups, yielded strongly pH-dependent streaming potential values over the same pH range. To help explain the contrast between results in Figs. 7 and 8, the following hypothesis is offered: It is proposed that the amine groups on the charged polymers need to be present at a certain level in order to achieve efficient adsorption onto a negatively charged substrate. It is further proposed that the resulting streaming potential will be highly dependent on the level of carboxyl groups,. 14.
(15) due to the polarization that occurs when polyampholytes adsorb onto a charged substrate [26-27]. The present results provide only partial support of this hypothesis.. 0.2% FR-2 0.025% FR-2 Blank. 0. 10. Streaming Potential (mV). Streaming Potential (mV). 10. -10 -20 -30 -40 -50 -60. 4. 6. 8. -10 -20 -30 -40 -50 -60. FR-2: 5% quat. amine, 5% acrylic acid. -70 2. 0.2% FR-1 0.025% FR-1 Blank. 0. 10. 12. 2. pH. Fig. 8A. Streaming potential – pH behavior of glass fibers treated with a polyampholyte having equal amounts of cationic and anionic groups. FR-1: 5% quat. amine, 5% itaconic acid. -70 4. 6. 8. 10. 12. pH. Fig. 8B. Streaming potential – pH behavior of glass fibers treated with polyampholytes in which the anionic groups were doubled by use of a difunctional carboxylic monomer. 3.3 Discussion of Glass as a Model Substrate In the Introduction it was noted that the glass fibers employed in the present work were non-porous and of much simpler geometry, relative to typical papermaking fibers, which tend to be both porous and fibrillated. As a consequence, in the present study, one would not expect to observe effects attributable to polymer diffusion below the outermost surfaces of the substrate. In light of these considerations, it is interesting to compare the present results to those obtained in a separate study, in which bleached hardwood kraft fibers were employed as a substrate [45]. At addition levels of 0.08% and 0.2% of polymer, with respect to cellulose, the streaming potential results corresponding to polyampholyte treatments were very similar to those shown in Fig. 4A of the present report. This similarity was observed despite the fact that the streaming potential of the untreated glass substrate was much more negative than the cellulosic fibers, throughout 15.
(16) the range of pH investigated. It is possible that, at the addition levels used, there was sufficient charged polymer present in order to obscure effects that might have arisen due to the porous and fibrillated nature of papermaking fibers. Questions of this nature provide motivation for future research. 4. Conclusions 1. Depending on the details of monomeric composition, adsorption in aqueous suspension of random polyampholytes onto glass microfibers generally resulted in streaming potentials that were less negative or more positive than that of the bare substrate at the given levels of pH, but not as positive as when the fibers were exposed to a cationic polyelectrolyte having similar density of amine groups. This tendency of the polyampholytes to reduce absolute values of streaming potentials is consistent with the fact that gains in dry-strength, fine-particle retention, and the rate of dewatering often are achieved as the electrokinetic potential of furnish solids is reduced towards zero. 2. Polyampholytes having a fixed ratio of basic to acidic groups showed a remarkable degree of similarity, with respect to streaming potentials, despite an eight-fold difference in the overall molar content of charged groups. Subtle trends within the family group included a tendency of the higher-charged polyampholytes to shift the streaming potential to more positive values at low pH and more negative values at pH above the isoelectric point. 3. Addition of polyaluminum chloride (PAC) to polyampholyte-treated glass fiber suspensions had a disproportionately large effect, compared to similar addition to fibers suspensions that had been treated with polyelectrolytes of similar charge. 16.
(17) density and molecular mass. The effect of PAC raising the streaming potential to less negative or more positive values was greatest in the case of polyampholytes having the highest charge density. The effect is attributed to complex formation between aluminum ionic species and carboxylate groups within the polyampholytes. 4. The change with time of the streaming potential of glass microfibers, following their treatment with polyampholytes, supports a hypothesis that the macromolecules rearrange themselves in response to the original net charge of the substrate. An enrichment of cationic groups at the polyampholyte-substrate interface results in a net depletion of cationic groups facing outwards towards the solution phase, consistent with a shift towards less positive or more negative streaming potentials with time. 5. By varying the ratio of basic to acidic groups in polyampholytes it was possible to shift the streaming potential-pH responses in predictable ways. In many, but not all cases, the streaming potentials of fiber systems following treatment with polyampholytes were almost linearly dependent on pH throughout most of the pH range between the pKa values of the acidic groups and the pKb value of the basic group. Though the significance of this finding is not yet fully understood, it is clear that charge ratios can be used as an additional tool for the optimization of these chemicals in papermaking systems. Acknowledgments The authors wish to acknowledge the support of the National Research Initiative of the USDA Cooperative State Research, Education and Extension Service, grant number 2004-35504-14655. In-kind support provided by Harima Chemical Co., Inc. is also gratefully acknowledged for preparation of some of the polyampholytes. References. 17.
(18) 1. J. Song, Y. Wang, M.A. Hubbe, O.J. Rojas, N. Sulić, T. Sezaki, Charge and the drystrength performance of polyampholytes. Part 1. Handsheets and bulk viscosity, J. Pulp Paper Sci. 32 (2006) accepted. 2. O.J. Rojas, P.M. Claesson, D. Muller, R.D. Neuman, The effect of salt concentration on adsorption of low-charge-density polyelectrolytes and interactions between polyelectrolyte-coated surfaces, J. Colloid Interface Sci. 205 (1998) 77-88. 3. O.J. Rojas, M. Ernstsson, R.D. Neuman, P.M. Claesson, Effect of polyelectrolyte charge density on the adsorption and desorption behavior on mica, Langmuir 18 (2002) 1604-1612. 4. S.M. Notley, S. Biggs, V.S.J. Craig, L. Wågberg, Adsorbed layer structure of a weak polyelectrolyte studied by colloidal probe microscopy and QCM-D as a function of pH and ionic strength, Physical Chemistry Chemical Physics. 2004 (6) 2379-2386. 5. P.M Claesson, E. Poptoshev, E. Blomberg, A. Dedinaite, Polyelectrolyte-mediated surface interactions, Advan. Colloid Interface Sci. 2005 (114) 173-187. 6. L. Wågberg, I. Nygren, I., The use of stagnation point adsorption reflectometry to study molecular interactions relevant to papermaking chemistry, Colloids Surf. A: Physicochemical and Engineering Aspects. 1999 (159) 3-15. 7. M. Rundlöf, L. Wågberg, Formation of multilayers on silica surfaces of a cationic polyelectrolyte and dissolved and colloidal substances originating from mechanical wood pulp – Adsorption and influence on adhesion, Colloids Surf. A: Physicochemical and Engineering Aspects. 2004 (237) 33-47. 8. V. Hand, J. Koethe, S. Kuchibhotla, S., W. Scott, An evaluation of two pad-forming paper stock charge analyzers, Proc. Papermakers Conf., TAPPI Press, Atlanta, 1993, 591-598. 9. N.D. Sanders, J.H. Schaeffer, “Comparing papermaking wet-end charge-measuring techniques in kraft and groundwood systems,” Tappi J. 78 (1995) (11) 142-150. 10. M.A. Hubbe, Method and apparatus for measuring an electrical property of papermaking furnish, U.S. Patent 5,936,151, 1999. 11. M.A. Hubbe, F. Wang, Charge-related measurements – A reappraisal. Part 2: Fiberpad streaming potential, Paper Technol. 45 (2004) (9) 27-34. 12. X.-C. Ye, H. Tanaka, M. Sumimoto, Effects of network-type polyacrylamides on the drainage and retention of white straw pulp, Mokuzai Gakkaishi 36 (1990) (1) 64-68. 13. Y. Fukunaga, New application method of dry strength agents by effective utilization of amphoteric polyacrylamide and aluminum sulfate, Proc. Japan TAPPI Ann. Mtg., 1999, pp. 349-357. 14. Y. Yoshimoto, Y. Iwasa, T. Fujiwara, Study of the mechanism of PAMs as paper dry strength agents, Proc. 2004 (71st) Pulp and Paper Research Conf., 2004, pp. 126129. 15. I.S. Jones, A theory of electrophoresis of large colloid particles with adsorbed polyelectrolyte, J. Colloid Interface Sci. 68 (1979) 451-461. 16. R. Varoqui, Effect of polymer adsorption on the electrophoretic mobility of colloids, Nouv. J. Chimie 6 (1982) 187-189. 17. H. Ohshima, Electrophoretic mobility of a polyelectrolyte-adsorbed particle: Effect of segment density distribution, J. Colloid Interface Sci. 185 (1997) 269-273. 18. G.J. Fleer, M.A. Cohen Stuart, J.M.H.M. Scheutjens, T. Cosgrove, B. Vincent, Polymers at Interfaces, Chapman & Hall, London, 1993.. 18.
(19) 19. L. Wågberg, Polyelectrolyte adsorption onto cellulose fibers – A review, Nordic Pulp Paper Res. J. 15 (2000) 586-597. 20. L.S. Sandell, P. Luner, Flocculation of microcrystalline cellulose with cationic ionene polymers, J. Appl. Poly. Sci. 18 (1974) 2075-2083. 21. S. Schwarz, H.-M. Buchhammer, K. Lunkwitz, H.-J. Jacobasch, Polyelectrolyte adsorption on charged surfaces: Study by electrokinetic measurements, Colloids Surf. A 140 (1998) 377-384. 22. F. Wang, M.A. Hubbe, Charge properties of fibers in the paper mill environment. 1. Effect of electrical conductivity, J. Pulp Paper Sci. 28 (2002) 347-353. 23. R. Everaers, A. Johner, J.F. Joanny, Polyampholytes: From single chains to solutions, Macromolecules 30 (1997) 8478-8498. 24. D. Long, A.V. Dobrynin, M. Rubinstein, A. Ajdari, Electrophoresis of polyampholytes, J. Chem. Phys. 108 (1998) 1234-1244. 25. L. Merle, Y. Merle, Synthetic polyampholytes. 2. Sequence distribution in methacrylic acid-(dimethylamino)ethyl methacrylate copolymers by 13C NMR spectroscopy, Macromolecules 15 (1982) 360-366. 26. J. Blaakmeer, M.A. Cohen Stuart, G.J. Fleer, The adsorption of polyampholytes on negatively and positively charged polystyrene latex, J. Colloid Interface Sci. 140 (1990) 314-325. 27. A.V. Dobrynin, M. Rubinstein, J.-F. Joanny, Adsorption of a polyampholyte chain on a charged surface, Macromolecules 30 (1997) 4332-4341. 28. T. Sezaki, M.A. Hubbe, J.A. Heitmann, D.S. Argyropoulos, X. Wang, Colloidal effects of acrylamide polyampholytes. Part 1. Electrokinetic behavior, Colloids Surf. A. 281 (2006) 74-81. 29. F. Wang, M.A. Hubbe, Development and evaluation of an automated streaming potential measurement device, Colloids Surf. A 194 (2001) 221-232. 30. M.A. Hubbe, Dry-strength development by polyelectrolyte complex deposition onto non-bonding glass fibers, J. Pulp Paper Sci. 31 (2005) 159-166. 31. R.K. Iler, The Chemistry of Silica – Solubility, Polymerization, Colloid and Surface Properties, and Biochemistry, Wiley, New York, 1979. 32. M.A. Hubbe, T.L. Jackson, M. Zhang, Fiber surface saturation as a strategy to optimize dual-polymer dry strength treatment, Tappi J. 2 (2003) (11) 7-12. 33. J.F. McKague, D.O. Etter, J.O. Pilgrim, W.H. Griggs, Practical applications of electrokinetics of papermaking, Tappi 57 (1974) (12) 101-103. 34. D. Horn, J. Melzer, The effect of high molecular mass cationic dewatering aids on the electrokinetic properties of pulp fibers, Wochenbl. Papierfabr. 29 (1975) 534541. 35. P.H. Brouwer, The relationship between zeta potential and ionic demand and how it affects wet-end retention, Tappi J. 74 (1991) (1) 170-179. 36. E. Poppel, The role of zeta potential in wet end processes and their optimization by electrokinetic control, Wochenbl. Papierfabr. 120 (1992) 565-571. 37. E. Strazdins, Application of electrokinetics in optimization of wet-end chemistry, in Chan, L.L. ( Ed.), Wet Strength Resins and their Application, TAPPI Press, Atlanta, 1994, pp. 63-83.. 19.
(20) 38. R.T. McQueary, Wet end waxy amphoteric starch impacts drainage, retention and strength, Proc. TAPPI 1990 Papermakers Conf., TAPPI Press, Atlanta, 1990, pp. 137-142. 39. P.C. Dalidowicz, Drainage aids containing bound phosphorus, Proc. TAPPI 2000 Papermakers Conf., TAPPI Press, Atlanta, 2000, pp. 119-123. 40. A. Sato, M. Ogawa, T. Oguni, M. Fujii, Amphoteric PAMs as dry strength resins, Proc. TAPPI 2005 Practical Papermakers Conf., TAPPI Press, Atlanta, 2005, digital document. 41. M.B. Donnan, T.W. Healy, P.F. Nelson, An electrokinetic study of alum coagulation and polymer flocculation of cellulose pulp fines, Colloids Surf. 2 (1981) 133-143. 42. T.R. Arnson, R.A. Stratton, The adsorption of complex aluminum species by cellulosic fibers, Tappi J. 66 (1983) (12) 72-75. 43. E. Strazdins, Theoretical and practical aspects of alum use in papermaking, Nordic Pulp Paper Res. J. 4 (1989) 128-134. 44. L.-O. Öhman, L. Wågberg, K. Malmgren, Å. Tjernström, Adsorption of aluminum (III) on cellulosic fibers in neutral and alkaline solutions – Influence of charge and size of the particles formed, J. Pulp Paper Sci. 23 (1997) J467-J474. 45. Y. Wang, M.A. Hubbe, T. Sezaki, X. Wang, O.J. Rojas, O. J., D.S. Argyropoulos, The role of polyampholyte charge density on its interactions with cellulose, Nordic Pulp Paper Res. J. 21 (2006), accepted for December issue.. 20.
(21) FIGURE CAPTIONS Fig. 1. Schematic representation of expected conformational change following adsorption of a high-mass, linear polyampholyte in which the distribution of charged groups is segregated. Fig. 2. Effect polyampholyte B dosage, as percent by mass on solids, on the streaming potential of glass fibers. Fig. 3. Effect of pH on streaming potential for glass fiber suspensions treated with different levels of polyampholyte B. Fig. 4A. Effect of the density of ionic groups in polyampholytes on the streaming potential of glass microfibers (0.2 % polymer dosage) at 1000 µS/cm conductivity. The polyampholytes have a constant molar ratio of acidic to basic groups. Fig. 4B. Contrast between the effects of polyampholyte B versus poly-base F and polyacid G having the same molar content of either positive or negative groups. Tests were performed at 1000 µS/cm conductivity. Fig. 5A. Effect of PAC addition at increasing levels to salt-free glass fiber suspensions treated at the 0.02% level with ionic polymers at pH=5. Fig. 5B. Effect of PAC addition at increasing levels of salt-containing glass fiber suspensions (1000 S/cm) treated at 0.02% with ionic polymers at pH=5. Fig. 6A. Effect of time on the streaming potential of glass fibers freshly treated with ionic polymers at pH=5 in the absence of sodium sulfate. Fig. 6B. Effect of time on the streaming potential of glass fibers freshly treated with ionic polymers at pH=5 in the presence of sodium sulfate (1000 S/cm). Fig. 7. Streaming potentials vs. pH for glass fibers treated with polyampholytes having different ratios of monomeric groups: Polyampholytes H-1 and H-2 with a ratio of amine groups to carboxyl groups of 5:8 and 3.8:9, respectively. Fig. 8A. Streaming potential – pH behavior of glass fibers treated with a polyampholyte having equal amounts of cationic and anionic groups Fig. 8B. Streaming potential – pH behavior of glass fibers treated with polyampholytes in which the anionic groups were doubled by use of a di-functional carboxylic monomer. 21.
(22)
Figure
+4
Related documents
The aim of this research is to investigate the comfort and safety of a novel device for measuring P-A trunk stiffness in a sample of young adults.. Methods: A sample of young
AIRWAYS ICPs: integrated care pathways for airway diseases; ARIA: Allergic Rhinitis and its Impact on Asthma; COPD: chronic obstructive pulmonary disease; DG: Directorate General;
The anti- oxidant activity was performed by DPPH free radical scavenging method using ascorbic acid as standard and compound IIa, IIc and IId showed significant free
Measuring the Diversity of Automatic Image Descriptions Proceedings of the 27th International Conference on Computational Linguistics, pages 1730?1741 Santa Fe, New Mexico, USA, August
Interestingly, unlike the Gaussian em- beddings, we can also obtain context-specific densities: they encode uncertainty about the sense of a word given its context and correspond to
ings were observed in the renal tissue of the Cis group with significantly increased levels of oxidants and IL-1β, such as wide hemorrhage areas, dilated and congested blood
Assessing the Impact of Biodiversity Conservation in the Management of Maize Stalk Borer (Busseola f
Field experiments were conducted at Ebonyi State University Research Farm during 2009 and 2010 farming seasons to evaluate the effect of intercropping maize with
This work is a review on the current emerging technologies which possess the disruptive ability, which has the potential to change the current technology support
