35
Single Performance Optimization of Micro Metal Injection Molding for
the Highest Green Strength by Using Taguchi Method
M.H.I Ibrahim1,2,* , N. Muhamad2 , A.B Sulong2, K.R. Jamaludin3 , S. Ahmad1, N.H.M Nor2 1Faculty of Mechanical and Manufacturing Engineering, UTHM
2Faculty of Engineering & Built Environment, UKM 3College of Science & Technology, UTM *Corresponding email:[email protected]
Abstract
Micro metal injection molding is drawing attention recently as one the most cost effective processes in powder metallurgy to produce small-scale intricate part and competitive cost for mass production of micro components where it is greatly influenced by injection parameter. Thus, this paper investigated the optimization of highest green strength which plays an important characteristic in determining the successful of micro MIM. Stainless steel SS 316L was used with composite binder, which consists of PEG and PMMA while SA works as a surfactant. Feedstock with 61.5% with several injection parameters were optimized which highly significant through screening experiment such as injection pressure(A), injection temperature(B), mold temperature(C), injection time(D) and holding time(E). Besides that, interaction effects between injection pressure, injection temperature and mold temperature were also considered to optimize in the Taguchi’s orthogonal array. Analysis of variance (ANOVA) in terms of signal-to-noise ratio (S/N-larger is better) for green strength was also presented in this paper. Result shows that interaction between injection temperature and mold temperature (BxC) give highest significant factor followed by interaction between injection pressure and injection temperature (AxB). Single factor that also contributes to significant optimization are mold temperature(C), injection time (D) and injection pressure (A). Overall, this study shows that Taguchi method would be among the best method to solve the problem with minimum number of trials.
36 1. INTRODUCTION
Micro metal injection molding are gaining better potential where currently most of the researchers using this method in producing small scale intricate part with better production cost. During the injection molding process, some of the green part has to be identified in terms of density, strength, defect, etc. If molding process parameters can be adjusted in an intelligent way, the characteristics that needed might be maximize or minimize towards an acceptable way. Some traditional approach does not produce satisfactory results in a wide range of experimental settings as it vary only one factor while others keep fixed. Optimization methods alone or integrated with other methods provide very effective techniques in finding the best process parameters values leading to least warpage, shrinkage, distortion and other defect[1-4].
Nowadays, optimization of the process parameter are gaining much interests among researchers as it can minimize defects, cost and obtain high efficiency in the planning or experiments. Design of Experiment (DOE) technique brings some researchers to identify the quality parameter need to be control for example Ji et al[5] measure the effects of sintering factors on the properties of the sintered parts. Khairur et al[6] has been using classical Design of Experiment technique to study the effects of injection parameters on the green part quality characteristics such as green density, green strength and green defects. Other researchers that using Taguchi as a medium tool to optimize their parameter including Ghani et al[7], Ahmad et al[8], Chen et al[9],Tuncay et al[10] and Oktem et al[11]. This is because from another experiments in another area of study such as plastic molding, metal removal processes, the Taguchi method is recognized as a systematic application of design and analysis of experiments for the purpose of designing and improving product quality. Taguchi’s method is statistically a robust technique and has proven to be reliable [12] where high quality products can be produced in a short period of time and at better cost efficiency.
In this paper, optimization parameter to achieve highest green strength will be investigated using design of experiment (DOE) at which injection molding parameter are optimized using L27 (313) Taguchi orthogonal
array. The injection parameters that will be used are injection pressure, injection temperature, mold temperature, injection time and holding time. Furthermore, interactions between injection pressure, injection temperature and mold temperature will also be investigated. Powder loading will not included in the parameter as 61.5% would be the best based from research done by Ibrahim et al[13,14] using critical powder volume percentage(CPVP) and rheological characteristics. Continuity from this, analysis of variance (ANOVA) will take place to find the significant parameter that contributes to highest green strength. Confirmation test will be done in order to verify within the range of optimum performance calculation.
2. METHODOLOGY 2.1 Material
37
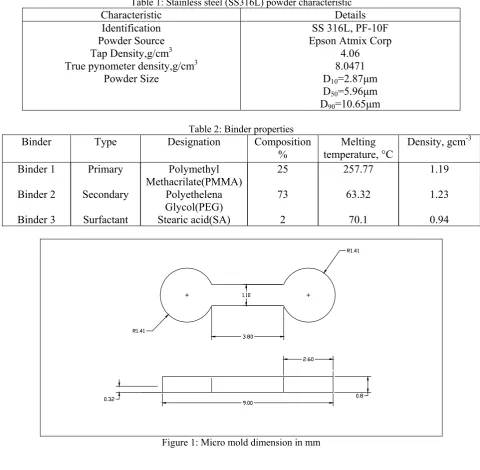
Table 1: Stainless steel (SS316L) powder characteristic
Characteristic Details Identification
Powder Source Tap Density,g/cm3 True pynometer density,g/cm3
Powder Size
SS 316L, PF-10F Epson Atmix Corp
4.06 8.0471 D10=2.87μm
D50=5.96μm
D90=10.65μm
Table 2: Binder properties
Binder Type Designation Composition
%
Melting temperature, °C
Density, gcm-3
Binder 1
Binder 2
Binder 3
Primary
Secondary
Surfactant
Polymethyl Methacrilate(PMMA)
Polyethelena Glycol(PEG) Stearic acid(SA)
25
73
2
257.77
63.32
70.1
1.19
1.23
0.94
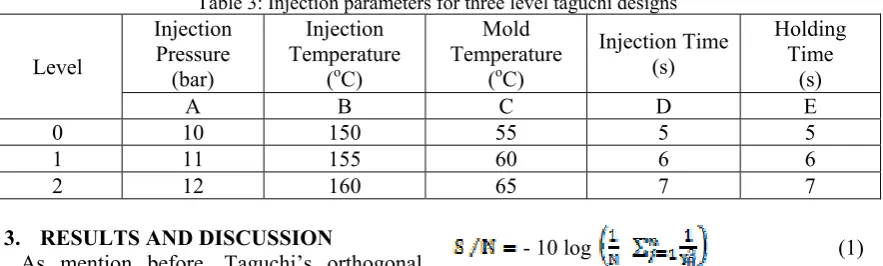
Figure 1: Micro mold dimension in mm
38 2.1 Design of Experiment
For the optimization process, Taguchi’s orthogonal array (statistical method) will be used in order to improve the green strength and the quality of the sample. In this case, the selection of experimental design is the backbone step in the procedure. Three-level designs of experiment with 5 parameters are consider in the injection molding where basically all of them are quite significant through screening test by using classical analysis of variance(ANOVA). The parameters that involved in the design are injection
pressure, injection temperature, mold temperature, injection time and holding time as shown in table 3 below. With total 24 DOF for both single and interactions parameter, L27’s
Taguchi orthogonal array (3 level OA) is the most suitable for design of experiment. L27
means that 27 runs will be conducted with 5 replications at each run in order to guarantee statistical accuracy. Table 4 show Taguchi’s orthogonal array which demonstrates quality characteristic and allocation level of each parameter.
Table 3: Injection parameters for three level taguchi designs
Level
Injection Pressure
(bar)
Injection Temperature
(oC)
Mold Temperature
(oC)
Injection Time (s)
Holding Time
(s)
A B C D E 0 10 150 55 5 5 1 11 155 60 6 6 2 12 160 65 7 7
3. RESULTS AND DISCUSSION
As mention before, Taguchi’s orthogonal array will give much reduced variance for the experiment with optimum settings of control parameters. Thus the marriage of Design of Experiments (DOE) with optimization of control parameters to obtain best results is achieved in the Taguchi Method. "Orthogonal Arrays" (OA) provide a set of well balanced (minimum) experiments and Signal-to-Noise ratios (S/N), which are log functions of desired output, serve as objective functions for optimization, help in data analysis and prediction of optimum results. Two of the applications in which the concept of SN ratio is useful are the improvement of quality via variability reduction and the improvement of measurement based on repetitive data. The SN ratio transforms several repetitions into one value which reflects the amount of variation present and the mean response. In this work, the characteristics needed are “larger the better” in order to optimize the green strength:-
- 10 log (1)
Where n is the total number of replication and Yij is the value of green strength in MPa.
39
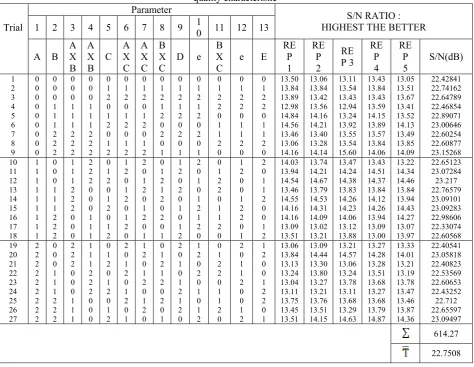
Table 4: Taguchi’s L27(313) orthogonal array demonstrates the value of experimental trials(density) and quality characteristic
Parameter S/N RATIO :
HIGHEST THE BETTER
Trial 1 2 3 4 5 6 7 8 9 10 11 12 13
A B A X B
A X B
C A X C
A X C
B X C
D e B X C
e E REP 1
RE P 2
RE P 3
RE P 4
RE P 5
S/N(dB)
1 0 0 0 0 0 0 0 0 0 0 0 0 0 13.50 13.06 13.11 13.43 13.05 22.42841 2 0 0 0 0 1 1 1 1 1 1 1 1 1 13.84 13.84 13.54 13.84 13.51 22.74162 3 0 0 0 0 2 2 2 2 2 2 2 2 2 13.89 13.42 13.43 13.43 13.67 22.64789 4 0 1 1 1 0 0 0 1 1 1 2 2 2 12.98 13.56 12.94 13.59 13.41 22.46854 5 0 1 1 1 1 1 1 2 2 2 0 0 0 14.84 14.16 13.24 14.15 13.52 22.89071 6 0 1 1 1 2 2 2 0 0 0 1 1 1 14.56 14.21 13.92 13.89 14.13 23.00646 7 0 2 2 2 0 0 0 2 2 2 1 1 1 13.46 13.40 13.55 13.57 13.49 22.60254 8 0 2 2 2 1 1 1 0 0 0 2 2 2 13.06 13.28 13.54 13.84 13.85 22.60877 9 0 2 2 2 2 2 2 1 1 1 0 0 0 14.16 14.14 15.60 14.06 14.09 23.15268 10 1 0 1 2 0 1 2 0 1 2 0 1 2 14.03 13.74 13.47 13.43 13.22 22.65123 11 1 0 1 2 1 2 0 1 2 0 1 2 0 13.94 14.21 14.24 14.51 14.34 23.07284 12 1 0 1 2 2 0 1 2 0 1 2 0 1 14.54 14.67 14.38 14.37 14.46 23.217 13 1 1 2 0 0 1 2 1 2 0 2 0 1 13.46 13.79 13.83 13.84 13.84 22.76579 14 1 1 2 0 1 2 0 2 0 1 0 1 2 14.55 14.53 14.26 14.12 13.94 23.09101 15 1 1 2 0 2 0 1 0 1 2 1 2 0 14.16 14.31 14.23 14.26 14.43 23.09283 16 1 2 0 1 0 1 2 2 0 1 1 2 0 14.16 14.09 14.06 13.94 14.27 22.98606 17 1 2 0 1 1 2 0 0 1 2 2 0 1 13.09 13.02 13.12 13.09 13.07 22.33074 18 1 2 0 1 2 0 1 1 2 0 0 1 2 13.51 13.21 13.88 13.00 13.97 22.60568 19 2 0 2 1 0 2 1 0 2 1 0 2 1 13.06 13.09 13.21 13.27 13.33 22.40541 20 2 0 2 1 1 0 2 1 0 2 1 0 2 13.84 14.44 14.57 14.28 14.01 23.05818 21 2 0 2 1 2 1 0 2 1 0 2 1 0 13.13 13.30 13.06 13.28 13.21 22.40823 22 2 1 0 2 0 2 1 1 0 2 2 1 0 13.24 13.80 13.24 13.51 13.19 22.53569 23 2 1 0 2 1 0 2 2 1 0 0 2 1 13.04 13.27 13.78 13.68 13.78 22.60653 24 2 1 0 2 2 1 0 0 2 1 1 0 2 13.11 13.21 13.11 13.27 13.47 22.43252 25 2 2 1 0 0 2 1 2 1 0 1 0 2 13.75 13.76 13.68 13.68 13.46 22.712 26 2 2 1 0 1 0 2 0 2 1 2 1 0 13.45 13.51 13.29 13.79 13.87 22.65597 27 2 2 1 0 2 1 0 1 0 2 0 2 1 13.51 14.15 14.63 14.87 14.36 23.09497
614.27 22.7508
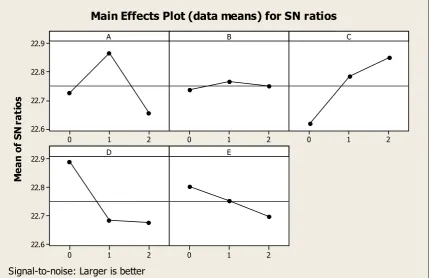
Figure 3 shows the main effects plot(data means) for the S/N ratio where the optimum parameter will be based on the highest peak at each parameter A,B,C,D and E. From the figure, the optimum configuration without considering interaction would be A1 B1 C2 D0
and E0. In other words, it brings to injection
pressure 11bar, injection temperature 155°C;
mold temperature 65°C; injection time 5s; and holding time 5s. The main effects plot is developed from Table 1 above by using the mean of S/N ratio. For example, the optimum parameter for A is at level 1, so the mean S/N value will be calculated from total trial 10 to 18 and then divided by the number of trials as shown below:-
40
M
e
a
n
of S
N
r
a
ti
os
2 1
0 22.9
22.8
22.7
22.6
2 1
0 0 1 2
2 1
0 22.9
22.8
22.7
22.6
2 1
0
A B C
D E
Main Effects Plot (data means) for SN ratios
Signal-to-noise: Larger is better
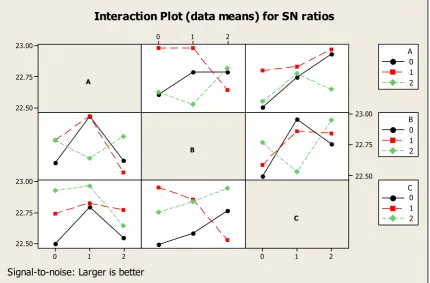
Figure 3: Main effects plot (data means) for S/N ratio However in figure 4, after taking consideration
on the interaction between AxB, AxC and BxC, the optimum configuration has changed or maintained depending on the highest S/N ratio. The S/N ratio of each interaction shown below is come from Figure 4 where it clearly shows that A1B1 and A1C2 were the highest
mean S/N ratio. Thus after considering the interactions of factors A, B and C, the optimum configuration becomes A1 B1 C2 D0
and E0. The optimum configuration hasn’t
changed even with interaction. It happens because these parameters were very significant
41 A
23.00
22.75
22.50
B
C
2 1
0 2
1 0
23.00
22.75
22.50
2 1
0 23.00
22.75
22.50
0 1 2 A
0 1 2 B
0 1 2 C
Interaction Plot (data means) for SN ratios
Signal-to-noise: Larger is better
Figure 4: Interaction plot (data means) for S/N ratio Each of the parameter was analyze using
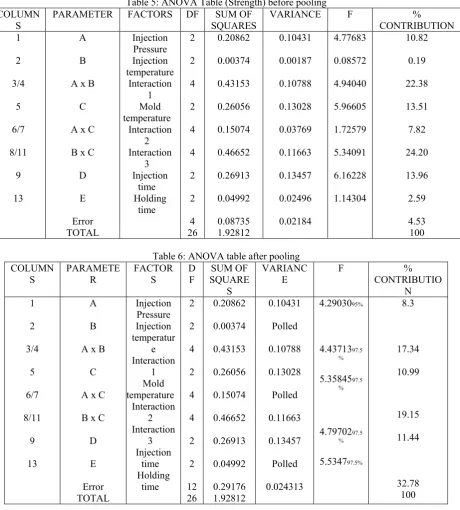
analysis of variance (ANOVA) which is standard statistical technique to provide a measure of confidence. Referring to the name itself, the technique does not analyze the data but rather determines the variance of the data. The confidence is measured from the variance of each parameter. The ANOVA computes quantities such as degree of freedom, sum of squares, variance and percentage of contribution as shown in table 5 below.
As can be seen on the ANOVA table, F-test indicates that some of the parameter doesn’t achieve 90% confident level. For example,
parameter B, AxC and E are less significant and should be pooled. Thus, VB, VAxC and VE
42
Table 5: ANOVA Table (Strength) before pooling COLUMN
S PARAMETER FACTORS DF SUM SQUARES OF VARIANCE F CONTRIBUTION % 1 2 3/4 5 6/7 8/11 9 13 A B A x B
C A x C B x C D E Error TOTAL Injection Pressure Injection temperature Interaction 1 Mold temperature Interaction 2 Interaction 3 Injection time Holding time 2 2 4 2 4 4 2 2 4 26 0.20862 0.00374 0.43153 0.26056 0.15074 0.46652 0.26913 0.04992 0.08735 1.92812 0.10431 0.00187 0.10788 0.13028 0.03769 0.11663 0.13457 0.02496 0.02184 4.77683 0.08572 4.94040 5.96605 1.72579 5.34091 6.16228 1.14304 10.82 0.19 22.38 13.51 7.82 24.20 13.96 2.59 4.53 100 Table 6: ANOVA table after pooling
COLUMN S PARAMETE R FACTOR S D F SUM OF SQUARE S VARIANC E F % CONTRIBUTIO N 1 2 3/4 5 6/7 8/11 9 13 A B A x B
C A x C B x C D E Error TOTAL Injection Pressure Injection temperatur e Interaction 1 Mold temperature Interaction 2 Interaction 3 Injection time Holding time 2 2 4 2 4 4 2 2 12 26 0.20862 0.00374 0.43153 0.26056 0.15074 0.46652 0.26913 0.04992 0.29176 1.92812 0.10431 Polled 0.10788 0.13028 Polled 0.11663 0.13457 Polled 0.024313 4.2903095% 4.4371397.5 % 5.3584597.5 % 4.7970297.5 % 5.534797.5% 8.3 17.34 10.99 19.15 11.44 32.78 100 Continuity from the significant parameter
which are A, AxB, C, BxC and D, the confident interval (C.I) is calculated. C.I represented the variation of the estimated value of the main effect of a factor of the result at the optimum at a confidence level used for the F values. The C.I of estimates of the factor effect shown in Table 7 is calculated with equation below [18]
(2)
Where, Fα (f1, f2) is the variance ratio for
DOF of f1 and f2 at level of significance α. The
confidence level is (1-α), f1 is the DOF of
mean (usually equal to 1) and f2 is the DOF for
the error. Variance for error terms is Ve and
43 Optimum performance calculation is based from significant parameter A, AxB, C, BxC and D. The highest S/N ratio for those parameter are used to estimate the range of optimum performance. However, parameter A1
is eliminated as A1xB1 has higher S/N ratio
compare to B0xC1. Thus B0xC1 is also
eliminated as the calculation only involved one parameter even after considering the interaction.
Table 7: Estimate of performance as the optimum design after pooling. (Characteristics: Larger the Better)
Optimum Performance Calculation:
22.7508 + (22.9832-22.7508) + (22.8509-22.7508) + (22.9575-22.7508) + (22.8918-22.7508) + (22.8681-22.7508) = 23.5483
Current grand average performance 22.7508
Confident interval at the 90% confidence level ±0.20714
Expected result at optimum performance, µ 23.34116 dB < µ < 23.75544 dB Further analysis is to predict the quality
characteristics based from optimum performance calculation. Based from the optimum injection parameter after pooling, the confirmation experiment should be within the range 23.34116 dB and 23.75544 dB. Table 8
below shows the green strength of the green part molded by using the optimum injection parameter which are A1B1, C2 and D0 . The
results from table 8 are acceptable as the S/N ratio just 0.02 dB above the minimum level.
Table 8: Confirmation experiment REP 1 REP
2 REP 3 REP 4 REP 5 REP 6 REP 7 REP 8 REP 9 REP 10 S/N(Larger the better) 15.48 15.19 14.85 14.46 14.68 14.35 14.37 15.49 14.29 14.24 23.36 Note: The holding time is varied at random
4. CONCLUSION
Taguchi’s orthogonal array is designed to improve the quality of products and processes where the performance depends on many factors while analysis of variance (ANOVA) establishes the relative significance to the individual factors and the interaction effects. From ANOVA, the parameters that shows significant are injection pressure (A), mold temperature(C), injection time (D) and the interaction between injection pressure with mold temperature (AxC) and injection temperature and mold temperature (BxC). All these parameters have confident level above 90% by using F-test. The optimum parameter obtain from ANOVA are acceptable where the range of optimum performance between 23.34116 dB and 23.75544. The results meet the requirement when S/N ratio (23.36 dB) from confirmation experiment is within the range and meet 90% confident level.
ACKNOWLEDGMENT
44 REFERENCES
[1] B.H. Lee, B.H. Kim. “Optimization of part wall thickness to reduce warpage of injection molded parts based on The Modified Complex Method.” Polym-Plastic Tech Eng ;34(5);793-811. 1995. [2] M.C. Huang ,C.C. Tai. “The effective
factors in The Warpage Problem of an injection-molded part with a thin shell feature.” J Mater Process Tech;110;1-9, 2001
[3] MSt. Jacques. “Analysis of thermal warpage in injection molded flat parts due to unbalanced cooling.” Polym Eng Sci;22;241-5, 1982
[4] K. Beiter, K. Ishii, L. Hornherger. “Proposed a geometry-based sink index to predict the sink mark depth of injection-molded parts.” ASME-DED;31;111, 1991. [5] C.H. Ji, N.H. Loh, K.A. Khor, S.B Tor.
“Sintering study of 316Lstainless steel metal injection molding parts using Taguchi method: final density.” Materials Science and Engineering A, 311;74-82, 2001.
[6] K.R. Jamaludin, N. Muhamad, M.N. Rahman, S.Y.M. Amin, Murtadhahadi. “Analysis of variance on the metal injection molding parameters using a bimodal particle size distribution feedstock.” Proceeding of International Conference of Mechanical and Manufacturing Engineering 2008.
[7] J.A. Ghani, I.A. Choudhury, H.H. Hassan. “Application of Taguchi method in the optimization of end milling parameters.” J. of Materials Processing Technology 145; 84-92, 2004
[8] S. Ahmad, N. Muhamad, A. Muchtar, J. Sahari ,K.R. Jamaludin, M.H.I Ibrahim, N.H.M. Nor . “Optimisation of processing parameters of titanium foams using Taguchi method for improved electrical conductivity.” Proceeding of International Conference of Sustainable Energy 2009. [9] R.S. Chen, H.H. Lee, C.Y. Yu.
“Application of Taguchi’s method on the optimal process design of an injection molded PC/PBT automobile bumper.” Composite Structures 39;209-214, 1997. [10] E. Tuncay, O. Babur. “Minimization of
warpage and sink index in an injection-molded thermoplastic parts using Taguchi optimization method.” Materials and Design 27;853-861, 2006.
[11] H. Oktem, E. Tuncay, U. Ibrahim. “Application of Taguchi optimization technique in determining plastic injection molding process parameters for a thin shell part.” Materials and Design 28;1271-1278, 2007.
[12] D.C. Montgomery. “Design and analysis of experiments”, 3rd edition,
Wiley, New York, 1991.
[13] M.H.I. Ibrahim, N. Muhamad, A.B. Sulong. “Rheological investigation of water atomized stainless steel powder for micro metal injection molding.” International Journal of Mechanical and Manufacturing Engineering,Vol 4(2009), 1, 1-8.
[14] M.H.I. Ibrahim, N. Muhamad, A.B. Sulong, Murtadhahadi. “Rheological properties of SS316l powder for micro metal injection molding.” Journal of
Applied Technology. 2010. Accepted for
publication
[15] M.H.I. Ibrahim, N. Muhamad, A.B. Sulong, K.R. Jamaludin, N.H.M. Nor, S. Ahmad. “Application of Taguchi method in micro metal injection molding.” Advances in Material & Processing Technology 2009.
[16] M.A. Omar, H.A. Davies. “The influence of PMMA content on the properties of 316L stainless steel MIM compact.” J. of Materials Processing Technology, 113, 471-481, 2001.
[17] G. Taguchi. “Introduction to quality engineering.” New York, USA McGraw-Hill, 1990.