ABSTRACT
DARRAH, JENNA ROSE. Brush Up on Knowledge: Oral Health Behavior is More Important Than You Think (Under the direction of Dr. Douglas J. Gillan).
The goal of this study was to determine the structure of participants’ oral health knowledge by developing Pathfinder networks from their relatedness judgments of oral health concepts. Participants rated the relatedness of thirteen common dental terms in all possible pairs, which was compared to their responses made on an oral health behavior questionnaire. The results from the Pathfinder network analysis revealed a connection between oral health
knowledge and positive oral health behaviors, including flossing and brushing as recommended by dentists. Previous work shows there is a large gap in recommendations by dentists and actual compliance of these behaviors, but the reasoning behind this gap is unclear. This study shows that individuals who have more dental knowledge appear to perform preventative oral health behaviors more regularly, so promoting the importance of regular dental behavior performance to the public may be effective in improving behavior.
Brush Up on Knowledge: Oral Health Behavior is More Important Than You Think
By
Jenna Rose Darrah
A thesis submitted to the Graduate Faculty of North Carolina State University
in partial fulfillment of the requirements for the degree of
Master of Science
Psychology
Raleigh, North Carolina 2018
APPROVED BY:
_______________________________ _______________________________
Jing Feng Christopher B. Mayhorn
_______________________________ Douglas Gillan
BIOGRAPHY
TABLE OF CONTENTS
LIST OF TABLES………..…...….iv
LIST OF FIGURES ………..………...….v
INTRODUCTION………...……….1
METHOD……….3
Design………....…...…3
Participants………...…………....5
Procedure………..…...………....….6
Statistical Analyses………...….7
RESULTS………..…...…….…...10
Central Nodes………..………...11
Coherence………..………….13
Similarity……….…...14
DISCUSSION………..……...15
LIMITATIONS AND FUTURE DIRECTIONS……….…..……17
REFERENCES………..…….18
APPENDIX………...………….….21
LIST OF TABLES
LIST OF FIGURES
Figure 1. Example Pathfinder Network Analysis………...8 Figure 2a. Network representation of oral health concepts for the high overall oral health
behaviors group..………..…………...12 Figure 2b. Network representation of oral health concepts for the medium- high overall oral
health behaviors group.………..……….…..12 Figure 2c. Network representation of oral health concepts for the medium-low overall oral
health behaviors group. ……….………...13 Figure 2d. Network representation of oral health concepts for the low overall oral health
INTRODUCTION
Research on health-relevant behaviors indicate that people fail to comply with health directives at a high rate -- approximately 40% overall, with a rate as high as 70% when the behavior involves changing a person’s lifestyle or modifying existing habits (Martin, Williams, Haskard, & DiMatteo, 2005). Failure to comply creates unintended risks for the well-being of the individual, as well as a massive financial burden on the individual and society as a whole.
Avoidable healthcare costs of between $100 to $300 billion have been attributed to
nonadherence in the U.S. annually, equal to 3 - 10% of the total costs for health care in the U.S. (Iuga & McGuire, 2014).
Very high noncompliance rates can also be observed with dental health. Noncompliance rates worsen markedly with symptom-free patients (Jimmy & Jose, 2011). With regard to preventive dental health, college-age students typically fall into this symptom-free category for gum disease and other oral health issues that do not reveal damage until later on in life. College-age students are a population who runs a high risk of developing gum disease, but do not currently show any symptoms (Becker & Maiman, 1980). Three key attributes influence patient compliance: (1) patients believe they are susceptible to the oral disease, (2) patients believe the risk poses severe consequences to their health, and (3) patients believe treatment will be
low compliance rates, and, therefore, demonstrate that Americans are not practicing preventive behaviors to the degree that they should be. An article in the U.S. News (2016) explains the importance of flossing, because it removes food particles that promote bacteria growth that leads to inflammation and gum disease. These bacteria can build-up, producing plaque, which hardens into tartar. Tartar wears away at gums and bone, and can eventually cause tooth loss. The effects of plaque build-up during a crucial period of developmental growth can result in negative
consequences for those who neglect to perform regular brushing and flossing. Duong Nguyen, a member of the CDC's Epidemic Intelligence Service (EIS), expresses in this article that his study shows that flossing education needs to be increased, and the long run benefits of flossing can prevent tooth decay and loss (U.S. News, 2016). Many studies have demonstrated the importance of complying with periodontal maintenance to improve oral hygiene, reduce the progression of periodontitis, and the enhance the integrity of teeth (Lee, Huang, Sun, & Karimbux, 2015).
Essentially, the take-home message is that practicing preventive behavior now will have a significant impact on future oral health. However, a critical issue in health behavior is getting people to understand and comply with that notion. This statement, taken together with the information presented above, begs the question: Why are there such low adherence rates related to performing simple preventive dental behaviors? Is there a lack of knowledge among the public concerning these oral health behaviors? The previous literature clearly highlights the current lack of adherence rates that starkly contrast with the data on the importance of these behaviors, particularly flossing and brushing.
Nudelman & Ivanova (2018) determined that frequency of performance of health
declarative and procedural, and their rates of compliance with regard to general dental behaviors, such as flossing and brushing. Perhaps there is something about a person’s knowledge and perceived importance of performing dental behaviors that correlates to a better performance rate. Mental models of participants oral health beliefs were constructed using Pathfinder networks to create a representation of individual’s knowledge of dental terms. The advantage of using
Pathfinder networks is that prominent relationships between concepts are extracted (Chen, 1998). These Pathfinder networks were then used to compare to the responses from participants
regarding their perceived importance and overall compliance of the main crucial dental behaviors: Brushing, flossing, using mouthwash, and receiving regular check-ups. The hypothesis underlying this research was that greater knowledge would result in a more highly structured network, because specific concepts would be perceived appropriately as
interconnected, whereas others would only be distantly connected (e.g., Furlough & Gillan, 2018). Dental health is largely influenced by an individual’s personal performance habits, so understanding how to improve those habits is crucial for increasing compliance rates. This understanding of an individual’s knowledge and perceived importance of these behaviors may provide insight about the reasoning behind why some individuals more regularly perform dental behaviors.
METHOD
Design
This study was conducted as a single experiment in a laboratory setting, beginning with a demographics questionnaire and dental knowledge survey, followed by a computer-based
dental knowledge was measured by ratings of relatedness between different pairs of dental terms (see Table 1). Accordingly, the present study was a quasi-experiment in that variables were not manipulated to produce different oral health knowledge, but their existing knowledge was measured. This helped to determine the connections between different dental terms that may indicate relationships that users associate with good dental behaviors and compliance. Demographic Variables
Participants were asked to respond to a demographics questionnaire, responding as they felt comfortable. The variables collected were age, gender, ethnicity, and how many years of college they have completed.
Self-Reported Dental Behaviors
In addition to the demographics questions, participants were asked to self-report the incidence of various dental behaviors that they perform. This included brushing frequency, flossing frequency, and mouthwash frequency, all gauged on a scale from never to twice per day. Additional questions asked were number of cavities the individual has had, which, if any, dental devices that used to have or currently have, how regularly they receive check-ups, and whether there is a history of gum disease in their family. These questions can be found in Appendix A. Concept Ratings
judgments. In order to perform a rating, participants were presented a numerical scale from one, which was “not at all related”, to seven, or “extremely related”.
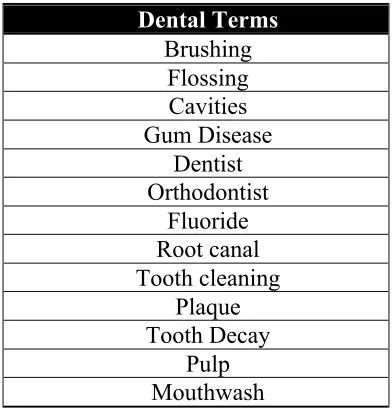
Table 1. List of Dental Terms Used in Relatedness Ratings
Dental Terms Brushing
Flossing Cavities Gum Disease
Dentist Orthodontist
Fluoride Root canal Tooth cleaning
Plaque Tooth Decay
Pulp Mouthwash
Participants
Participants were 50 North Carolina State University students ranging in age from 17 to 29 years old, who were recruited from the North Carolina State University SONA System. This participant pool was recruited from students taking introduction to Psychology courses, and received course research credit for participating. There were no restrictions with regard to ethnicity or race for this study. A G*Power analysis was performed under the assumption of a regression analysis because one of the major analyses is the prediction of oral health behaviors from aspects of the Pathfinder networks. Assuming a medium effect (Cohen’s F=.30), and the α=.05 significance level, it was determined that a sample size of 46 participants were required for
Procedure
Upon arrival in the laboratory, participants were instructed to sit in front of a 27-inch, 2015 model Apple desktop computer, where the entire duration of the experiment took place. They first read and verbally consented to the informed consent form. Participants were then asked to direct their attention to the computer screen, which displayed the questionnaire
regarding their demographic information, as well as the survey questions regarding their dental health behaviors. Once they completed the questionnaire/survey, they continued to the second part of the experiment, in which they were shown two dental-related terms on the computer screen, and were asked to rate the similarity of the two terms on the seven-point scale described above. The pairs of terms for each participant were generated in a random order, so no
participant saw the same sequence of pairs. Once the participant entered the appropriate
relatedness rating, the program automatically moved to the next comparison in which two more terms were generated for comparison. This process was repeated until the program had generated every combination of two terms once, for a total of 78 relatedness ratings.
The study concluded once the participant completed all sets of comparison ratings. The participants were offered to view the matrix representation of their relatedness ratings if they desired. The entire study lasted approximately 20 to 30 minutes.
Collecting Data
represented as nodes, with and relatedness ratings used to determine the links that connect the nodes (Chen, 1998). This collection of nodes and links represent how individuals gauge relationships between concepts (Harary, 1969). The Pathfinder algorithm is based on mathematical graph theory; the algorithm eliminates links that are not on the shortest path between all pairs of nodes in a network consisting of the shortest paths between nodes (see Dearholt & Schvaneveldt, 1990). The algorithm uses two parameters: (1) q, which limits the number of indirect relatedness ratings used in producing a network and varies from 2 to n – 1 (where n is the number of nodes) and (2) r which determines the metric used in computing the path lengths, and varies from 1 to infinity. The minimum span network is produced with q = n – 1 and r = infinity. Pathfinder networks based on concepts have been shown to predict cognitive performance (Cooke, Durso, & Schvaneveldt 1986; Cooke, 1992), to be related to amount of experience with on-line games (Furlough & Gillan, 2018), to aid in the construction of hypertext systems (McDonald, Paap, & McDonald, 1990), to investigate cognitive changes produced by metaphors (Gilman & Gillan, 2001), and to relate to student performance in classes (Goldsmith, Johnson, and Acton, 1991) among a wide variety of other applications of the method.
Statistical Analyses
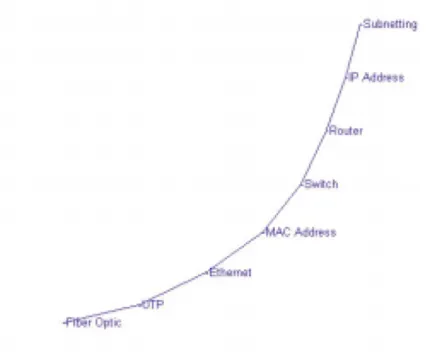
(Stevenson, Shah, & Bish, 2016). An example of a Pathfinder network visual output model can be found in Figure 1.
Figure 1. Example Pathfinder network analysis (DiCerbo, 2007).
The networks from each participant’s relatedness ratings were derived using JPathfinder with the parameters q and r set to n-1 and infinity, respectively, thereby producing the minimal Pathfinder network. In addition to a network for each individual participant, Pathfinder networks were derived that combined the results from participants grouped into different oral health compliance categories.
node, “Ethernet”, toward the center, which has several connections stemming from it. Looking within the network, there may be specific key terms that are at the central nodes, and therefore have more connections among the concepts that need to be present for other nodes to connect. Central nodes are important to determine because, as concepts with many links, they may represent an individual’s perception of the most important concepts in the network.
Participant responses to the questionnaire were categorized into two groups, high and low compliance, for each behavioral question. These questions included frequency of brushing, flossing, and mouthwash. If the participant responded on the upper half of the response options, which included twice daily, once daily, every other day, or a few times per week; they were considered to be in the high compliance group. Responses of less frequency were placed into the low compliance category. For the check-ups questions, responses were placed into the high performance group if they reported regular check-ups every few months, every six months, or once per year. The remaining responses were regarded as low compliance. All participants reported brushing their teeth once or twice daily, and were therefore not classified into a high or low grouping. These splits were made to determine the various differences that existed between high and low compliance of these fundamental dental behaviors.
Pathfinder networks and is based on the proportion of shared links between those two networks (Goldsmith & Davenport, 1990).
Responses from the oral health survey were further analyzed. For the floss, brush, and mouthwash frequency questions, responses were coded from 0 to 7, with 0 representing “never” and 7 representing “twice daily”. The question regarding how often the individual received regular dental check-ups was numbered in a similar manner, from 0 to 4. The reasoning for this categorization was to display and quantify the results in a manner that participants responses could be directly compared. Each participant’s values for the four oral health behaviors were summed producing a total maximum compliance score of 25. Once these values were totaled, participants were separated into quartiles by this overall compliance score, and a Pathfinder network was generated for each quartile. Participants in the low compliance category (n=14) had an overall score from 10 to 13, the next lowest grouping (n=14) was from 14 to 16, third
grouping (n=10) was a score of 17 or 18, and the highest compliance group (n=12) had overall compliance scores ranging from 19 to 22.
RESULTS
Central Nodes
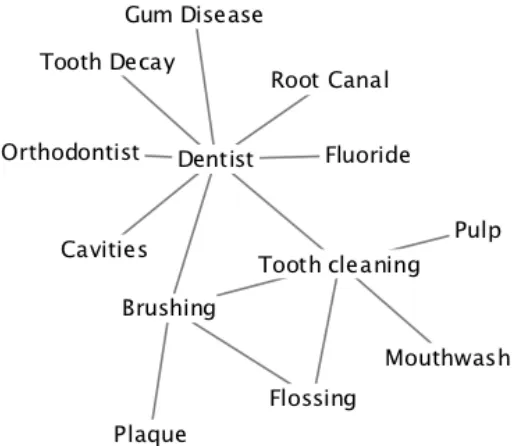
Figure 2a. Network representation of oral health concepts for the high overall oral health behaviors group.
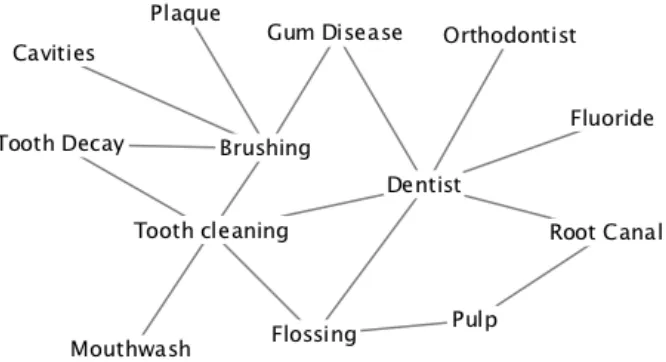
Figure 2c. Network representation of oral health concepts for the medium-low overall oral health behaviors group.
Figure 2d. Network representation of oral health concepts for the low overall oral health behaviors group.
Coherence
coherence rate than its corresponding low compliance group, .672 and .488, respectively. Similar findings were shown for using mouthwash, with the high group showing a coherence rating of .692 and the low group at .432. The two check-up groups had very similar coherence ratings, .565 for high and .612 for low. Brushing was not considered due to the lack of variability in responses.
The overall compliance groups showed consistently increasing coherence with increasing performance. From low to high, the coherence values were .345, .585, .605, and .703,
respectively (see Table 2). A Mann- Whitney U test reveals the high compliance group had a significantly higher coherence than the overall low compliance group (U=39, p=.02).There were no significant differences comparing any other combination of groups.
Table 2. Coherence Ratings Among Each Overall Compliance Behavior Group.
Group Coherence
Low 0.345
Medium Low 0.585
Medium High 0.605
High 0.703
Similarity
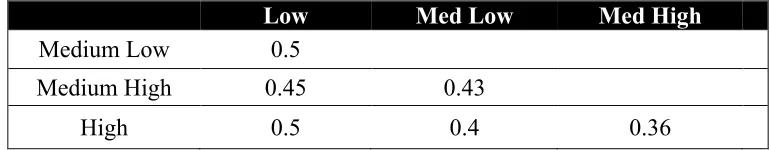
Table 3. Similarity Ratings Among Each Overall Compliance Behavior Group.
Low Med Low Med High
Medium Low 0.5
Medium High 0.45 0.43
High 0.5 0.4 0.36
DISCUSSION
health behavior compliance scores are all compiled into the overall compliance scores, only the overall groupings are discussed below.
The differences within the networks, as well as the differences in coherence among the networks suggest that the different groups based on the oral health behaviors may have different mental models concerning oral health. The coherence values reveal that the higher compliance groups had more uniformity in their relatedness of concepts. The relatively low similarity values determined between the four overall compliance groups uncovers that the groups differ with regard to their network structures, and therefore showed a low correspondence with neighboring networks. Further support for the higher intricacy of the higher compliance groups is shown by the overall mean number of links for each group. There is a clear trend that increasing overall compliance correlates with more links, and therefore a higher level of interconnectedness.
LIMITATIONS AND FUTURE DIRECTIONS
One pertinent limitation is that the population studied included a narrow age range. It may be the case that young adults do not fully value the importance of good oral health because they have yet to experience the effects of prolonged poor oral compliance, such as gum disease and tooth decay. Another limitation was the particular design of this study, because the focus was on conceptual knowledge as opposed to skilled behavior. Although some of the concepts used here are related to procedures (e.g., flossing), this type of analysis doesn’t reveal a person’s knowledge of the performance of that task. The Pathfinder networks derived in this study
REFERENCES
American Dental Association (2012). Glossary of dental clinical and administrative terms. Retrieved from:
https://www.ada.org/en/publications/cdt/glossary-of-dental-clinical-and-administrative-te rms
Becker, M. H., & Maiman, L. A. (1980). Strategies for enhancing patient compliance. Journal of Community Health, 6, 113-135.
Bradley, J. H., Paul, R., & Seeman, E. (2006). Analyzing the structure of expert knowledge. Information & Management, 43, 77–91.
Chen, C. (1998). Generalised similarity analysis and pathfinder network scaling. Interacting with Computers, 10, 107-128.
Cooke, N. J. (1992). Predicting judgment time from measures of psychological proximity. Journal of Experimental Psychology: Learning, Memory, and Cognition, 18, 640-653.
Cooke, N. M., Durso, F. T., & Schvaneveldt, R. W. (1986). Recall and measures of memory organization. Journal of Experimental Psychology: Learning, Memory, and Cognition, 12, 538-549.
Dearholt, D. W., & Schvaneveldt, R. W. (1990). Properties of Pathfinder networks. In R. W. Schvaneveldt (Ed.), Ablex series in computational sciences. Pathfinder associative networks: Studies in knowledge organization (pp. 1-30). Norwood, NJ: Ablex.
DiCerbo, K. E. (2007). Knowledge structures of entering computer networking students and their instructors. Journal of Information Technology Education, 6, 263-277.
Dunlap, J. C., & Grabinger, S. (2001). Using Pathfinder networks to examine structural knowledge. Unpublished. Retrieved from:
https://www.researchgate.net/publication/2409203_Using_Pathfinder_Networks_to_Exa mine_Structural_Knowledge
Furlough, C. S., & Gillan, D. J. (2018). Mental models: Structural differences and the role of experience. Journal of Cognitive Engineering and Decision Making. Retrieved from: http://journals.sagepub.com.prox.lib.ncsu.edu/doi/10.1177/1555343418773236 Gilman, E. M., & Gillan, D. J. (2001). Metaphors as tools for restructuring
knowledge: Metaphor-based learning about computer systems. In Proceedings of the Human Factors and Ergonomics Society 45th Annual Meeting (pp. 612-616). Sage, CA: Los Angeles, CA: SAGE.
(pp. 75-87). Norwood, NJ: Ablex.
Goldsmith, T. E., Johnson, P. J., & Acton, W. H. (1991). Assessing structural knowledge. Journal of Educational Psychology, 83, 88-96.
Guerrero-Bote, V. P., Zapico-Alonso, F., Espinosa-Calvo, M. E., Crisóstomo, R. G., & de Moya-Anegón, F. (2006). Binary pathfinder: An improvement to the pathfinder algorithm. Information Processing & Management, 42, 1484-1490.
Harary, F. (1969). Graph theory. Reading, MA: Addison-Wesley.
How many Americans floss their teeth? U.S. News & World Report. (2016). Retrieved from https://www.usnews.com/news/articles/2016-05-02/how-many-americans-floss-their-teet h
Interlink Inc. (2017). JPathfinder.
Iuga, A. O., & McGuire, M. J. (2014). Adherence and health care costs. Risk Management and Healthcare Policy, 7, 35–44.
JRate. (2006). Retrieved from http://jrate.sourceforge.net/
Jimmy, B., & Jose, J. (2011). Patient medication adherence: Measures in daily practice. Oman Medical Journal, 26, 155–159.
Korda, H., & Itani, Z. (2013). Harnessing social media for health promotion and behavior change. Health Promotion Practice, 14, 15 - 23.
Lee, C. T., Huang, H. Y., Sun, T. C., & Karimbux, N. (2015). Impact of patient compliance on tooth loss during supportive periodontal therapy: A systematic review and meta-analysis. Journal of Dental Research, 94, 777-786.
Luebke, T. E., & Driskell, J. A. (2010). A group of Midwestern university students needs to improve their oral hygiene and sugar/pop consumption habits. Nutrition Research, 30, 27-31.
Martin, L. R., Williams, S. L., Haskard, K. B., & DiMatteo, M. R. (2005). The challenge of patient adherence. Therapeutics and Clinical Risk Management, 1, 189–199.
Meyerhoefer, C. D., Panovska, I., & Manski, R. J. (2016). Projections of dental care use through 2026: Preventive care to increase while treatment will decline. Health Affairs, 35, 2183-2189.
Nudelman, G., & Ivanova, E. (2018). The relationship between frequency of performance and
Quirin, A., Cordón, O., Guerrero-Bote, V. P., Vargas-Quesada, B., & Moya-Anegón, F. (2008). A quick MST-based algorithm to obtain Pathfinder Networks (∞, n − 1). Journal of the American Society for Information Science and Technology, 59, 1912-1924.
Schvaneveldt, R. W., Durso, F. T., & Dearholt, D. W. (1989). Network structures in proximity data. Psychology of Learning and Motivation, 24, 249-284.
Stevenson, J. L., Shah, S., & Bish, J. P. (2016). Use of structural assessment of knowledge for outcomes assessment in the neuroscience classroom. Journal of Undergraduate Neuroscience Education, 15, A38-A43.
Yu, D. M. (2013). Improving compliance. Dimensions of Dental Hygiene, October 2013. Retrieved from:
Appendix A
Demographic Questionnaire and Dental Knowledge Survey
1. How often do you floss? ____ Twice daily
____ Once daily ____ Every other day ____ A few times per week ____ Once per week ____ Once per month ____ Almost never ____ Never
2. How often do you brush your teeth? ____ Twice daily
____ Once daily ____ Every other day ____ A few times per week ____ Once per week ____ Once per month ____ Almost never ____ Never
3. How often do you use mouthwash? ____ Twice daily
____ Once daily ____ Every other day ____ A few times per week ____ Once per week ____ Once per month ____ Almost never ____ Never
4. Do you have a history of cavities? If so, how many? ____ Yes
____ No
Enter number of cavities: ________________
5. Have you ever had or do you currently have a dental device for your mouth (braces, mouth guard, retainer, etc.)? Please specify the device.
____ Used to have ____ Currently have
6. How often do you receive regular dental check-ups? ____ Once every few months
____ Once every 6 months ____ Once per year
____ Every other year
____ Do not receive regular check-ups
7. Do you or does someone in your family have a history of gum disease? Please specify on the line provided.
__________________________________
8. What is your age in years? ________________
9. What is your gender? ____ Female
____ Male
____ Prefer not to answer
10. What is your ethnicity? ____ African American ____ Asian/ Pacific Islander ____ Caucasian
____ Hispanic or Latino ____ Other
11. How many years of college have you completed? ____ Zero ____ One ____ Two ____ Three ____ Four ____ Five ____ Six