Report No. 352
A SYSTEMATIC EVALUATION OF POLYACRYLAMIDE FOR SEDIMENT AND TURBIDITY CONTROL
By
Richard A. McLaughlin
Department of Soil Science
College of Agriculture and Life Sciences North Carolina State University
Raleigh, North Carolina
UNC-WRRI-352
A SYSTEMATIC EVALUATION OF POLYACRYLAMIDE FOR SEDIMENT AND TURBIDITY CONTROL
Richard A. McLaughlin
Department of Soil Science College of Agriculture and Life Sciences
North Carolina State University Raleigh, NC 27695
The research on which this report is based was financed in part by the United States Department of the Interior, Geological Survey, through the Water Resources Research Institute of The University of North Carolina
Contents of the publication do not necessarily reflect the views and policies of the United States Department of the Interior, nor does mention of trade names of commercial products constitute their endorsement by the United States Government.
This report fulfills the requirements for a project completion report of the Water Resources Research Institute of The University of North Carolina. The authors are solely responsible for the content and completeness of the report.
WRRI Project No. 70196 USGS Agreement No. 01HQGR0096
iii
ACKNOWLEDGMENTS
Many individuals were involved in the work conducted for this project. Jamie Stansell, Sara Hayes, Freddie Aldridge, and Wes Childres of the Soil Science Department spent varying amounts of time conducting the field experiments. This involved a lot of time sending muddy water into basins and then having to shovel it back out. Nate Bartholomew conducted most of the laboratory work as part of his Master’s thesis with the help of undergraduate Dawn Deojay. Both are continuing their education at the University of Minnesota and Ohio State University, respectively. Amber Moore, Ph.D. candidate in Soil Science, provided assistance with the statistical analyses and final report preparation.
Primary funding for the project was by the Water Resources Research Institute. Supplemental support was provided by the North Carolina Department of Environment and Natural Resources through their Division of Water Quality 319 Non-Point Source grant program.
v
ABSTRACT
An evaluation of polyacrylamides (PAM) for sediment and turbidity control for construction sites was conducted in both the laboratory and the field. Field tests of PAM logs were conducted to determine the effects of log condition (wet or dry) and water temperature on turbidity
reduction in sediment basins. Basin design features, including baffles and outlet type, were also tested for optimal effectiveness with PAM. An alternative system, involving injecting PAM solution into turbid water flowing to different types of sediment bags, was tested under simulated runoff conditions. Finally, a laboratory screening was conducted for seven PAMs on eight sediment sources from North Carolina Department of Transportation (NC DOT) construction sites around North Carolina. The results indicate that the PAM logs were usually much less effective when initially dry at the start of the 25 min simulated storm event, The turbidity was higher with lower water temperatures, mostly likely due to increased water viscosity as opposed to reduced PAM release from the logs. The optimal basin configuration for maximum turbidity reduction using PAM included porous baffles made of a jute/coir combination. The outlet type did not significantly change the turbidity reduction by PAM. Sediment bags were tested with and without PAM injected as a solution and always had reduced turbidity with PAM. Less porous bag materials had lower turbidity in discharge but also clogged more quickly. For a Piedmont soil, the addition of gypsum generally increased turbidity at low PAM concentrations (< 1 mg L-1) for five PAMs with varying properties. The optimal PAM concentration was usually close to 1 mg L-1 and higher doses tended to increase turbidity, but this effect was dampened when gypsum was added. This combination of effects suggests that the gypsum was competing with suspended sediment for binding sites on the PAM molecules. In contrast,
several Coastal Plain soils responded to PAM only in the presence of gypsum. There was no soil property which correlated with this gypsum response in all soils, but sand content and extractable Fe were the most highly correlated.
vii
TABLE OF CONTENTS
Page
ACKNOWLEDGMENTS ...iii
ABSTRACT... v
LIST OF FIGURES ... ix
LIST OF TABLES ... xi
SUMMARY AND CONCLUSIONS ...xiii
RECOMMENDATIONS ... xv
INTRODUCTION ... 1
MATERIALS and METHODS ... 2
Effects of PAM Condition, Water Temperature, and Basin Design on Turbidity Reduction ... 2
PAM/Electrolyte Interactions ... 8
RESULTS and DISCUSSION ... 10
Effects of PAM Condition, Water Temperature, and Basin Design on Turbidity Reduction ... 10
PAM/Electrolyte Interactions ... 13
Alternative Systems for Sediment and Turbidity Control ... 23
ix
LIST OF FIGURES
Page
Figure 1. Layout of main testing area of SECREF. ... 3
Figure 2. Dam design for the sediment basins ... 4
Figure 3. Hydrograph/sedigraph for the standard medium basin tests ... 5
Figure 4. Particle size distribution for the sediment used in basin experiments... 6
Figure 5. Water flow and sediment added for sediment bag tests ... 7
Figure 6. Soil sample numbers coincide with the North Carolina Department of Transportation Highway Division region. Samples were obtained from construction sites within each Division………... 8
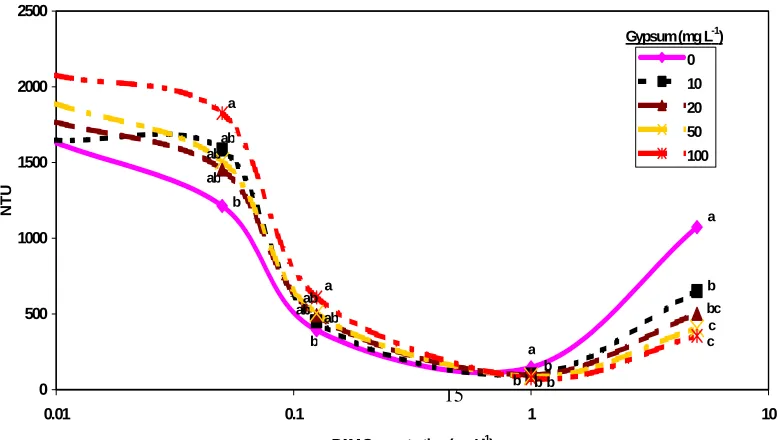
Figure 7. Turbidity reduction as a function of input PAM concentration. Flocculation by Superfloc A110 (18% charge density, 15 Mg mol –1 molecular weight) alone and with gypsum at four different concentrations on soil 8.For each PAM concentration, data points with different letters are significantly different (p = 0.05). Figure shown in linear-log scale. ... 15
Figure 8. Turbidity reduction as a function of input PAM concentration. Flocculation by Chemtall 923VHM (30% charge density, 14-17.5 Mg mol –1 molecular weight) alone and with gypsum at four different concentrations on soil 8.For each PAM concentration, data points with different letters are significantly different (p = 0.05). Figure shown in linear-log scale... 15
Figure 9. Turbidity reduction as a function of input PAM concentration. Flocculation by Ciba Soilfix (30% charge density, 15 Mg mol –1 molecular weight) alone and with gypsum at four different concentrations on soil 8.For each PAM concentration, data points with different letters are significantly different (p = 0.05). Figure shown in linear-log scale. ... 16
Figure 10. Turbidity reduction as a function of input PAM concentration. Flocculation by APS 705 (mixed charge density, mixed molecular weight) alone and with gypsum at four different concentrations on soil 8.For each PAM concentration, data points with different letters are significantly different (p = 0.05). Figure shown in linear-log scale. ... 16
Figure 11. Turbidity reduction as a function of input PAM concentration. Flocculation by APS 706b (block) (mixed charge density, mixed molecular weight) alone and with gypsum at four different concentrations on soil 8.For each PAM concentration, data points with different letters are significantly different (p = 0.05). Figure shown in linear-log scale. ... 17
Figure 12. The effects of gypsum on turbidity reduction by A 100 PAM for soil sample 1 (Coastal Plain)... 19
x
Figure 14. The effects of gypsum on turbidity reduction by the A 100 PAM on soil sample 3 (Coastal Plain). ... 20 Figure 15. The effects of gypsum on turbidity reduction by the A 100 PAM on soil sample 4 (Upper Coastal Plain)... 20 Figure 16. The effects of gypsum on turbidity reduction by the A 100 PAM on soil sample 6 (Upper Coastal Plain). Note that the turbidity scale is logarithmic to better view differences .. 21 Figure 17. The effects of gypsum on turbidity reduction by the A 100 PAM on soil sample 7 (Piedmont). Note that the turbidity scale is logarithmic to better view differences ... 21 Figure 18. The effects of gypsum on turbidity reduction by the A 100 and A 1606 PAMs on soil sample 8 (Piedmont). Note that the turbidity axis is logarithmic to better view differences ... 22 Figure 19. The effects of gypsum on turbidity reduction by the A 100 and A 1606 PAMs on soil sample 14 (Mountain). Note that the turbidity axis is logarithmic to better view differences ...22 Figure 20. Turbidity in water discharged from a standard sediment bag during and after five storm simulations. The fourth and fifth runs were run the day after the previous three... 24 Figure 21. Turbidity in water discharged from a standard sediment bag during five storm
xi
LIST OF TABLES
Page Table 1. Properties of soils used in laboratory evaluations of PAM/electrolyte interactions... 9 Table 2. PAM products tested and their properties... 10 Table 3. The effect of water temperature on the effectiveness of PAM logs in reducing turbidity. Numbers with different capital letters are different between warm and cold at p < 0.05, those with different lower case letters are different at p < 0.10 ... 11 Table 4. The effect of log condition on the effectiveness of PAM logs in reducing turbidity. Numbers with different capital letters are different between warm and cold at p < 0.05... 12 Table 5. The effects of different basin configurations on turbidity under warm conditions and wet PAM logs. Values followed by different letters are significantly different (p < 0.10) ... 12 Table 6. Turbidity in the sediment basin as affected by combinations of treatments for the
xiii
SUMMARY AND CONCLUSIONS
The use of PAM to reduce turbidity has been shown to be effective but the conditions necessary for this to occur on a construction site have not been developed. One of the methods of
introducing PAM into stormwater is by installing a solid block or log of PAM in the ditch or pipe, allowing the moving water to dissolve the PAM. One of the objectives of this project was to determine the optimal conditions for these logs to reduce turbidity in runoff. Tests were conducted under controlled, replicated conditions at the Sediment and Erosion Control Research and Education Facility at the Lake Wheeler Field Laboratory in Raleigh. We determined that it is important that the block remain moist between storm events for the release of PAM in
xv
RECOMMENDATIONS
The use of chemical treatments to assist in settling fine particles that occur in stormwater runoff from construction sites may be the only practical approach to reducing turbidity. PAM has great potential as a safe chemical treatment but there is little information on how to obtain the
maximum benefits from it in the field. The results from this study provide some guidance on specific issues for PAM use:
• PAM logs are much more effective when they are not allowed to dry out between storm events. Dry logs have a lag time between when runoff first immerses them and when they begin to release sufficient PAM for effective turbidity treatment. Specific methods for maintaining logs in a moist condition on construction sites were beyond the scope of this study.
• Turbidity is always higher in colder water regardless of treatment. This may have implications for the potential to achieve turbidity goals during the winter or other times and places where the water temperature is low (<15oC in our tests).
• The inclusion of porous baffles in the basin enhanced the settling process and these should be included as a standard feature. We used a combination of jute and coir, but other materials with similar porosity (5-10%) should work just as well.
• Although the rock dam and skimmer outlets did not have significant differences in turbidity, a surface outlet such as the skimmer would still be recommended as a standard feature in basins. Previous work has shown the skimmer/emergency spillway outlet to have superior sediment retention to the typical rock dam outlet.
• The addition of gypsum as a cation source to bridge the PAM-clay interface can have a positive, neutral, or even negative effect depending on the soil. In several soils it was very effective in improving flocculation with PAM, but this effect will have to be determined for each individual site.
INTRODUCTION
The U.S. Environmental Protection agency has documented that sediment is the major pollutant of streams and rivers in the United States (USEPA, 2000). Sediment impairs 13% of the
assessed streams and contributes to 38% of the water quality problems. The control of erosion is imperative to keeping our farmland productive. More than one-third of the cropland in the U.S. is in danger of having severe erosion, to the point of lost crop productivity (Havlin et al., 1999). In addition to the loss of topsoil, the erosion of soil into surface water leads to sedimentation of streams and eutrophication (McCutchan, 1993). Much of this sediment is due to agriculture, but an increasing amount of sediment, particularly in urbanizing areas, is due to construction
practices. It should be noted that turbidity itself is toxic to aquatic organisms. An increase in turbidity from 6 to 12 NTU can reduce submerged macrophytes, and increases from 12 to 45 NTU can result in up to 5oC increases in temperature in a Piedmont pond (Reed et al., 1983). They suggested that turbidities in excess of 60 NTU could produce fish kills due to the increased temperature and reduction in oxygen.
Most construction sites have some form of sediment trap or basin near the lowest point on the project. The typical design has a volume for sediment storage proportional to the drainage area, a length to width ratio of 2:1, and an outlet constructed of large rocks with a gravel face (NC DENR 1988). Some modifications have been tested to improve on the estimated 40-50% loss of sediment using this design (Line and White 2001). The concept of a floating outlet (skimmer) for sediment basins was developed in Orange County by the former head of the Erosion Control Division, Warren Faircloth. Tests of this product were conducted at Penn State and published in 1997 (Millen et al., 1997). The results of their tests suggested an improvement in sediment retention from 94% with a perforated riser (the standard outlet) to 97% with the skimmer. The addition of baffles made of silt fence within the basin to slow flow to the perforated riser outlet also improved retention but only about half as well as the skimmer. The combination of barriers and a skimmer were no better than the skimmer alone. In all cases, more than 90% of sediment >40 um was retained. It should be noted that a 24-hour dewatering time was used for both outlets, which might explain the high retention levels. The Faircloth skimmer is now a commercial product.
Monitoring of actual skimmer basins in Orange and Wake counties has indicated an average sediment retention of 90%, but turbidity remained an order of magnitude above the 50 NTU standard (McLaughlin, unpublished data). This is considerably more than the 50-70% reported for rock-outlet sediment traps under similar conditions (Line and White, 2001), but a skimmer will not address the turbidity problem alone in most cases.
Thaxton et al (2004) tested porous baffles made of jute and coir and found that they reduced turbulence and velocity, resulting in the capture of considerably more and finer sediment.
2
Basin modifications have been shown to increase sediment capture, but the turbidity caused by suspended clays and fine silts will not be addressed. Chemical treatment to destabilize the suspended materials is one approach to reducing this turbidity. Przepiora et al. (1997, 1998) found that calcium sulfate in the form of moulding plaster could successfully reduce turbidity in sediment basins to meet the 50 NTU requirement in North Carolina, although retention times could be up to two days. The plaster was added to the basins by hand. PAM is a long-chain organic molecule which is used to bind suspended materials into flocs which can either settle or be filtered from the water. Turbidities of less than 10 NTU have been achieved when the runoff was stored and treated with PAM (Minton and Benedict, 1999). They used what was essentially a water treatment plant system, with storage ponds, pumps, and multiple settling basins, which was estimated to cost up to 1.5% of the total construction costs.
PAM is typically purchased as a dry powder. Dry PAM typically has active polymer
concentrations of 75-90%, the remainder being water, processing aids, and buffers (Barvenik, 1994). PAM is most often dissolved in water before application to soil surfaces or in irrigation water. The water must be rapidly agitated for dry granular PAM to be thoroughly dissolved. It is soluble in cold water, and heating does not significantly increase the rate of dissolution
(Montgomery, 1968). Recently, PAM has been manufactured in solid blocks or logs intended to be deployed in ditches or other locations where runoff can dissolve PAM from the log as it moves over it. There are no published reports on the use of these logs or on their efficacy under varying conditions.
As part of an effort to begin to determine how PAM can be most effectively used in North Carolina, we initiated laboratory and field studies to determine how to optimize its use on construction sites. We tested the PAM logs under varying conditions in simulated runoff to determine how to maximize PAM release and subsequent turbidity reduction. We also examined how basin features, including baffles and either rock or surface outlets, to determine the best combination to settle the flocs formed when PAM is added. The potential for PAM to improve turbidity reduction in sediment bags was also determined. Laboratory tests were conducted to determine the potential for gypsum to enhance the PAM flocculation process in soils from across the state.
Materials and Methods
Effects of PAM Condition, Water Temperature, and Basin Design on Turbidity Reduction
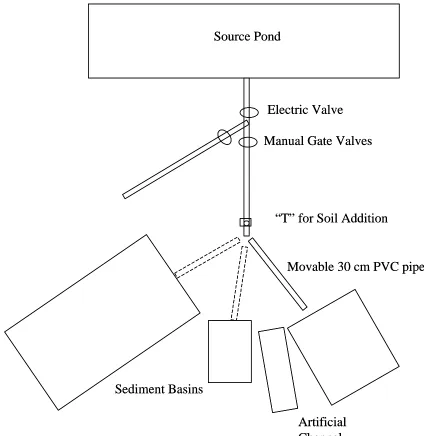
Field tests were conducted at the Sediment and Erosion Control Research and Education Facility (SECREF) located at the Lake Wheeler Road Field Laboratory in Raleigh, NC. The key element at SECREF is a 350 m3 holding pond that provides water for simulated storm events. This pond is supplied through the farm irrigation system. Water from the holding pond is gravity-fed through 30 cm pipes to sediment basins and traps, simulated channels, or any other devices or systems to be tested (Figure 1). There is a “Y” in the pipe system with a gate valve on each arm to allow for water to be directed to two areas of testing downslope of the “Y”. A single
3
Figure 1. Layout of main testing area of SECREF. Source Pond
Sediment Basins
Movable 30 cm PVC pipe “T” for Soil Addition
Manual Gate Valves Electric Valve
Artificial Channel Source Pond
Sediment Basins
Movable 30 cm PVC pipe “T” for Soil Addition
Manual Gate Valves Electric Valve
4
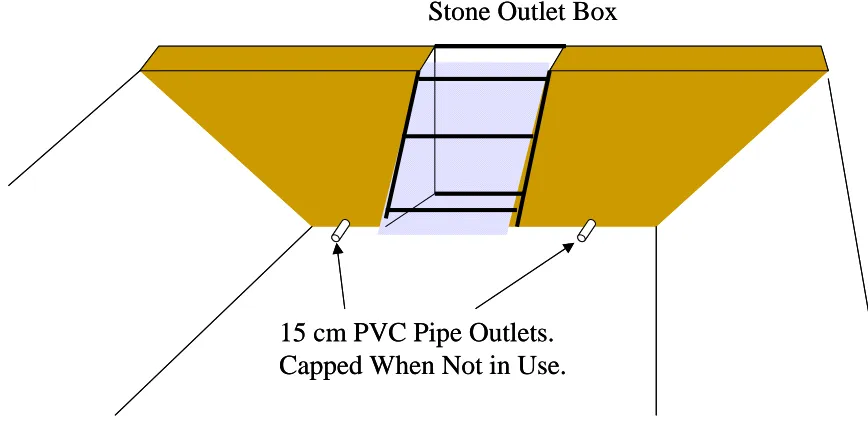
All tests were conducted in the medium basin with dimensions of approximately 5 m x 10 m and a depth of 1 m at the deepest point near the dam. The dam included a plywood box 1.2 m wide with a face angle of 3:1 toward the inside of the basin (Figure 2). The box was filled with large rock with a 0.3 m deep gravel layer on the inside face, following the standard design in the North Carolina Erosion and Sediment Control Manual. The face of the box can be covered with
plywood for skimmer testing through a 0.15 m PVC pipe installed at the base of the dam.
Figure 2. Dam design for the sediment basins.
For each test, the gate valve was opened to a predetermined point for the prescribed time to generate a flow. In most cases, this flow was maintained for 5 minutes and then adjusted according to a hydrograph generated for each sediment basin, with the simulated storm event lasting 25 min (Figures 3-5). We obtained the test soil from a stockpile of soil deposited on the farm property by an unknown local source. The farm had agreed to let a local contractor deposit the soil on the property in case the farm needed fill material in the future. The soil was passed through a wire mesh screen (approximately 2 cm) to remove plant materials, rock, and clods prior to testing.
The pipe leading from the source pond has a “T” at a point 20 m from the basins. Soil is added to the water stream at that point. Prior to each test, a set number of buckets are filled with soil and placed on a platform adjacent to the opening. The soil is added manually using a stopwatch to determine the rate at which the soil is poured into the water stream.
Stone Outlet Box
15 cm PVC Pipe Outlets.
Capped When Not in Use.
Stone Outlet Box
5
Figure 3. Hydrograph/sedigraph for the standard medium basin tests.
The test basin was lined with erosion control fabric prior to each test in order to minimize resuspension from previous tests. After 3-5 tests the liners were removed in order to maintain basin geometry as much as possible. The skimmer tests were all conducted using a Faircloth skimmer with a 0.05 m drain pipe and a 0.025 m orifice. This was attached to the 15 m pipe in the dam by means of a flexible pipe. After completing these tests, we opened the rock outlet box to allow drainage through the standard rock outlet, essentially converting the basin into a trap.
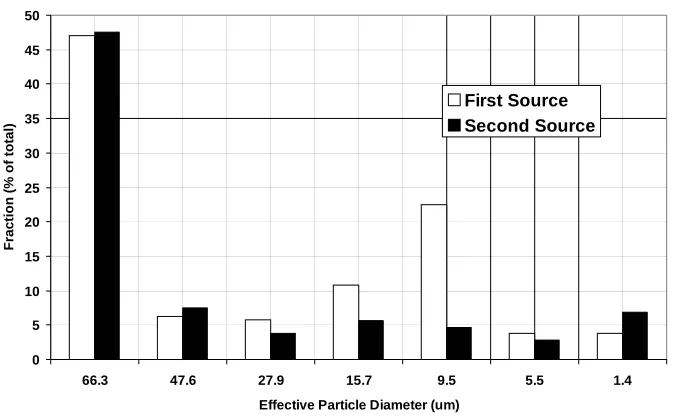
The soil used as a sediment source was a sandy loam donated as fill from an unknown local construction project. There was very little clay-size particles (3%) but substantial amounts of finer silt particles (Figure 4). This source of sediment was removed for a stream restoration project in April 2002, at which time we switched to a new sediment source which had a
somewhat different distribution. However, we did not see any evidence of a substantial shift in turbidity or sediment retention with the new source.
0 10 20 30 40 50 60
0-5 5-10 10-15 15-20 20-25
Time (min)
Flow (L/sec), Sedime
6
Figure 4. Particle size distribution for the sediment used in basin experiments.
H-flumes were installed at the basin and spreader exits to measure flow and obtain samples. Flow was measured using a bubbler module on an Isco 712 series sampler (Isco, Lincoln, NE), which was also programmed to obtain samples. Discrete samples were taken every 5 min for most tests for up to two hours during and after the flow. Because the skimmer basins drain more slowly, some of these tests were conducted using hourly sampling. A sampler was also place above the basin and obtained samples at the upper part of the basin during the test as well. Three tests of each set of conditions were conducted except where noted due to equipment failures.
Tests of polyacrylamide were mostly conducted using Applied Polymer Systems (APS) Floc Logs (Applied Polymer Systems, Norcross, GA, USA) . These were placed at different points in the pipe after the soil addition step. The two formulations used were 702c and 730b, either alone or in combination. The combination of two 730b logs and one 702c log was the most successful PAM treatment and this was how many of our PAM tests were conducted.
The effects of moisture condition on the logs was determined by either soaking them overnight in a bucket of water or by allowing them to air dry until dry to the touch, which usually took several days. The same logs were used for all tests. A second set of tests using a sediment source from western Alamance county (mixed felsic/mafic system) was also used in a separate set of dry vs. wet tests. That sediment had more clay, with a sand:silt:clay distribution of 43:32:25 on a percentage basis, and is referred to as the “Burlington” soil hereafter. The effect of temperature was evaluated by conducting identical tests in the winter and summer. Water temperature in the storage pond was recorded prior to each test.
An alternative sediment trapping system is a sediment bag, which is made up of various types of porous geotextile. Sediment-laden water is usually pumped into them in order to filter out the
Average Particle Size Distribution
0 5 10 15 20 25 30 35 40 45 50
66.3 47.6 27.9 15.7 9.5 5.5 1.4 Effective Particle Diameter (um)
Fraction (% of total)
7
sediment, usually resulting in some retention but with considerable turbidity remaining. We tested four sediment bags made of different materials: standard (340 g m-2 non-woven
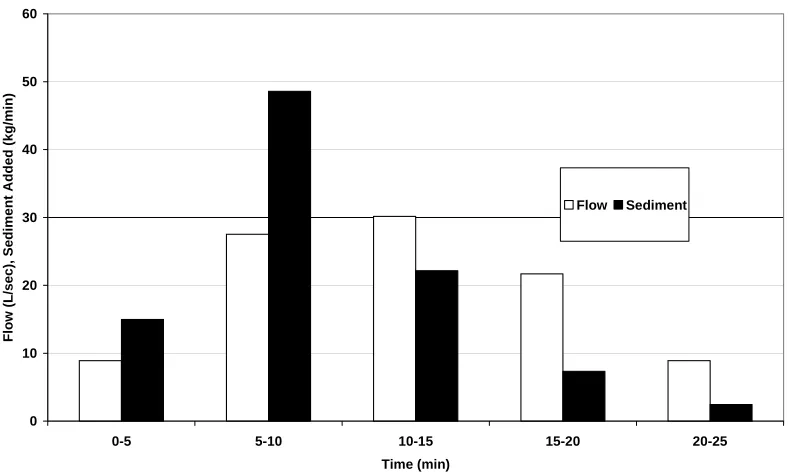
polypropylene), standard plus jute liner, porous polypropylene (190 g m-2 monofilament), and porous jute. For these tests, we piped water in 0.20 m corrugated, plastic pipe to the bags from the source pond as described for the basin tests. The flow and sediment added are indicated in Figure 5. Individual tests were conducted in sequence on the same bag, which was replaced with a new bag for each new set of test conditions. In some tests the flow out of the bag was reduced after several simulations, backing water up into the pipe and causing the simulation to be
terminated early while the bag was allowed to drain. These will be noted in the results section.
For PAM tests with sediment bags, we pumped a 5 g L-1 solution of APS 705 into the flow after added soil. Two peristaltic pumps were used and pumped the solution at a steady rate of 1.85 L min-1. Because the simulated storm flows varied, the resulting concentration of 705 in the runoff water was approximately 7.5 mg L-1, 2.2 mg L-1, 1.7 mg L-1, and 3.4 mg L-1 for each five minute time interval, respectively.
0.00 5.00 10.00 15.00 20.00 25.00
0-5 5-10 10-15 15-20
Test Time (min)
S e d im e nt Add e d (k g mi n -1 ) 0.0 0.2 0.4 0.6 0.8 1.0 1.2 Fl ow (m
3 min -1) Sediment
Flow
8
PAM/Electrolyte Interactions
For the PAM/electrolyte interaction tests, a soil sample from a construction project in Highway Division 8 (Figure 5) located in the Piedmont Region of North Carolina was used in a laboratory flocculation study involving the use of gypsum and PAM treatment. The hypothesis being tested is that gypsum application in addition to PAM will result in greater flocculation of soil
suspensions than either flocculant alone. An evaluation of the efficacy of PAM and gypsum combined application was done on six additional North Carolina soils without replication to see if the trends that appeared in replicate tests with soil sample 8 where similar. Soil samples used in additional evaluations were from Highway Divisions: 1, 2, 3, 4, 11, and 13 (Figure 6; Table 1).
Figure 6. Soil sample numbers coincide with the North Carolina Department of
9
Table 1. Properties of soils used in laboratory evaluations of PAM/electrolyte interactions. Soil Source
(District)
Texture Sand (%)
Silt (%)
Clay (%)
pH Organic Matter (%)
1 Sand 90 5 5 6.6 0.15
2 Sandy Loam 72 18 10 4.4 0.33
3 Sand 93 3 4 6.5 0.20
4 Loamy Sand 84 11 5 3.6 0.46
6 Sandy Clay Loam 63 13 25 2.8 0.59
7 Sandy Loam 54 35 11 4.5 0.09
8 Sandy Loam 78 7 16 3.5 0.14
14 Clay Loam 37 29 34 3.9 0.72
In all tests the gypsum used was construction grade obtained from a hardware store. The levels of gypsum used with sample 8 were 0, 10, 20, 50 and 100 mg L-1. In the evaluation of the six additional North Carolina soils, the gypsum levels were 5, 50, and 200 mg L-1. PAM used in the evaluation of soil sample 8 was both in granular and floclog (block) form. The levels of PAM used were 0, 0.05, 0.125, 1 and 2 mg L-1. The PAM products used were: Cytec Superfloc A110, SNF Floerger Chemtall 923 VHM, Ciba Specialty Chemicals Soilfix Polybead, and Applied Polymer Systems 705 (granular) and 706b (Floclog). Known properties for the polymers used in this experiment are listed in Table 2. The 705 product is a mixture of two PAMs plus an
10
Table 2. PAM products tested and their properties.
PAM Molecular Weight
(Mg mol-1)
Charge Density (%)
A 100 16 7
A 110 15 18
A 1606 28 30
Soilfix 16 30
706b (block) Mixed Mixed
705 Mixed Mixed
923VHM 14-17.5 20
Each polymer was first weighed and then slowly added to distilled water while stirring rapidly with a magnetic stir bar and a stir plate. Concentrated ( 1 g L-1) PAM solutions were allowed to mix for at least 24 hours at room temperature. The concentrated solutions were diluted so that the target concentration in the 100 mL test soil suspension was achieved by adding one mL or less. The distilled water was added to 5 g soil in a plastic, 100 mL urine cup followed by the addition of the PAM solution and the gypsum. Each soil suspension with PAM and/or gypsum was shaken for 10 seconds by hand and placed on a table.
Turbidity was measured using a nephelometer (McVan Instruments Analite 152; McVan Instr., Victoria, Australia). A calibration curve was established for each set of samples using formazin standards (Hach, Loveland, CO, USA), and the sample readings were adjusted using a linear regression curve from the standards. Statistical analyses were performed using the SAS System software GLM procedures. For the sediment trap/basin tests, the weighted mean turbidity was calculated using the turbidity values weighted by the proportion of the event flow represented by that sample according to the following equation:
Weighted Mean Turbidity = Sum ((Sample Turbidity)*(Flow at that time/Total Flow))
For example, the turbidity for the sample taken at 10 minutes would be multiplied by the ratio of the volume at that flow (which is adjusted every 5 minutes) to the total volume during the event. This would be calculated for each 5 minute sample interval and then summed.
Results and Discussion
Effects of PAM Condition, Water Temperature, and Basin Design on Turbidity Reduction
The effects of temperature on the performance of a sediment basin can be estimated based on the increased viscosity of water at lower temperatures. However, we are not aware of tests to
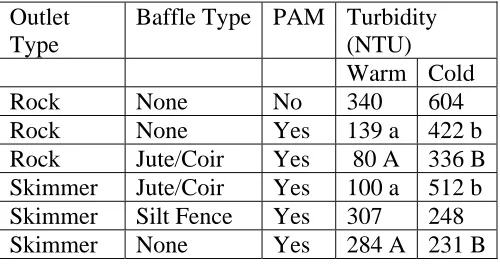
determine this effect at a full scale basin. The tests we conducted clearly indicated that turbidity will usually be significantly higher as runoff water temperature drops. Of the six treatment combinations tested, four had higher turbidity under cold conditions, three of which were statistically significant (Table 3). We arbitrarily set 15 oC as the split between “warm” and “cold,” and the two remaining treatments actually had a relatively small difference in
11
turbidity between “warm” and “cold” also had the greatest differences in temperature, sometimes more than 20 oC. When the cold water tests are all compared, no statistically significant (p = 0.05) difference are evident.
The effect of temperature on turbidity without PAM is evident in the first comparison in Table 3, although the increase under cold conditions was not statistically significant. PAM dissolution rates are not affected by temperature (Montgomery 1968), so the differences between warm and cold conditions are more likely due to the change in water viscosity. This suggests that turbidity will always be higher in the winter compared to the summer, all other conditions being the same. One approach to dealing with this would be to enlarge the basin size requirement to account for longer settling times.
Table 3. The effect of water temperature on the effectiveness of PAM logs in reducing turbidity. Numbers with different capital letters are different between warm and cold at p < 0.05, those with different lower case letters are different at p < 0.10.
Outlet Type
Baffle Type PAM Turbidity (NTU)
Warm Cold
Rock None No 340 604
Rock None Yes 139 a 422 b
Rock Jute/Coir Yes 80 A 336 B Skimmer Jute/Coir Yes 100 a 512 b
Skimmer Silt Fence Yes 307 248
Skimmer None Yes 284 A 231 B
12
Table 4. The effect of log condition on the effectiveness of PAM logs in reducing turbidity. Numbers with different capital letters are different between warm and cold at p < 0.05.
Outlet Type
Baffle Type PAM Turbidity (NTU)
Wet Dry
Rock Jute/Coir Yes 336 412
Rock Silt Yes 151 A 303 B
Rock None Yes 100 A 421 B
Skimmer None Yes 284 502
Skimmer Silt Fence Yes 327 306
Skimmer Jute/Coir Yes 99 A 274 B
Using only tests conducted with warm water and wet PAM logs, the jute/coir baffle significantly reduced turbidity regardless of outlet type (Table 5). The silt fence baffle did not perform as well as the porous jute/coir baffle, but did reduce turbidity compared to a skimmer outlet and no baffles. Recent research at SECREF has shown that the jute/coir baffles have the greatest effect in reducing turbulence and velocity in the basin, providing the optimal conditions for gravity settling (Thaxton et al., 2004). It is somewhat surprising that the skimmer did not provide any improvements in turbidity compared to the rock outlet. It is possible that the rock dam was partially clogged with sediment from the testing and as a result the water primarily exited the basin over the top of the dam. However, this is probably the case for rock dams on actual construction sites so may reflect the flows in a typical sediment trap.
Table 5. The effects of different basin configurations on turbidity under warm conditions and wet PAM logs. Values followed by different letters are significantly different (p < 0.10).
Outlet Type
Baffle Type PAM Turbidity (NTU)
Skimmer None Yes 284 a
Rock Silt Yes 151 b
Skimmer Jute/Coir Yes 99 c
Rock Jute/Coir Yes 80 c
13
Table 6. Turbidity in the sediment basin as affected by combinations of treatments for the Burlington soil, which had higher clay content than the other soils. All tests were
conducted under warm water conditions using wet PAM logs where indicated.
Outlet Type
Baffle Type PAM Turbidity (NTU)
Rock None No 628 A
Rock None Yes 259 B
Skimmer Jute/Coir No 187 B
Skimmer Jute/Coir Yes 57 B
PAM/Electrolyte Interactions
In tests of the single component PAMs, gypsum usually increased turbidity significantly
(p=0.05) with no or low PAM concentrations (<1 mg L-1) (Figures 7-11). However, the turbidity of a soil suspension should decrease with the addition of a divalent cation such as gypsum
(Sposito, 1984). It is possible that the addition of gypsum (no PAM) caused an increase in soil particle size (increasing light scattering and turbidity) but particles were not large enough to settle in the specified time (30 sec). However, as the PAM concentration approached 1 mg L-1, differences in turbidity reduction due to gypsum concentration were no longer present. At higher PAM concentrations, soil particles were bridged by PAM which led to rapid flocculation. At the highest concentration of PAM (5 mg L-1), increasing the gypsum concentration significantly (Tukey, p = 0.05) reduced turbidity for the single PAMs. However, increasing gypsum concentrations above 50 mg L-1 did not appear to have any significant effect. For the mixed PAMs (705, 706b), the optimal dose of gypsum was less than 100 mg L-1 and at that level effectiveness declined.
Chemtall 923 VHM (30% c.d., 14-17.5 Mg Mole –1) had the most significant “rebound” than other PAMs at the highest PAM concentration, although all three single PAMs had some turbidity increase as the concentration increased from 1 mg L-1 to 5 mg L-1. The addition of gypsum reduced this effect in proportion to the amount added.
Gypsum diminished the flocculation effectiveness of PAM at low PAM concentrations. The negative effect below PAM concentrations of 1 mg L-1 is similar to the effect seen by Peng and Di (1994) where multivalent cations in solution decreased PAM efficacy in flocculation of kaolinitic soils. The mechanism is believed to be Ca2+ adsorption on the carboxylic (R-COO-) functional group of PAM to form (R-COO)2Ca, which diminishes repulsive forces between
functional groups and decreases polymer extension in solution. Orts et al. (1999) also stated that neutron scattering pattern of Cytec Superfloc A110 (18% c.d., 15 Mg mole-1) suggests that the radius of gyration of the polymer chain in water decreases almost linearly with increasing concentration of calcium in solution. In addition, complexation of Ca2+ to carboxyl groups inhibits ligand exchange.
14
15
Figure 7. Turbidity reduction as a function of input PAM concentration. Flocculation by Superfloc A110 (18% charge density, 15 Mg mol –1 molecular weight) alone and with
gypsum at four different concentrations on soil 8. For each PAM concentration, data points with different letters are significantly different (p = 0.05). Figure shown in linear-log scale. Figure 8. Turbidity reduction as a function of input PAM concentration. Flocculation by Chemtall 923VHM (30% charge density, 14-17.5 Mg mol –1 molecular weight) alone and with gypsum at four different concentrations on soil 8. For each PAM concentration, data points with different letters are significantly different (p = 0.05). Figure shown in linear-log scale. 0 250 500 750 1000 1250 1500 1750 2000 2250
0.01 0.1 1 10
PAM Concentration (mg L-1)
NTU 0 10 20 50 100 a a a a a a a a ab b b b abab b ab b b bc c
Gypsum (mg L-1)
0 500 1000 1500 2000 2500
0.01 0.1 1 10
PAM Concentration (mg L-1)
NTU 0 10 20 50 100 a a a a b b b b ab ab ab b ab ab ab b b bc c c
16
Figure 9. Turbidity reduction as a function of input PAM concentration. Flocculation by Ciba Soilfix (30% charge density, 15 Mg mol –1 molecular weight) alone and with gypsum at four different concentrations on soil 8. For each PAM concentration, data points with different letters are significantly different (p = 0.05). Figure shown in linear-log scale.
Figure 10. Turbidity reduction as a function of input PAM concentration. Flocculation by APS 705 (mixed charge density, mixed molecular weight) alone and with gypsum at four different concentrations on soil 8. For each PAM concentration, data points with different letters are significantly different (p = 0.05). Figure shown in linear-log scale.
0 500 1000 1500 2000 2500
0.01 0.1 1 10
PAM Concentration (mg L-1)
NTU 0 10 20 50 100 Gypsum (mg L-1)
a a a a a a a ab ab b c a b b
b bbc
bc c a 0 500 1000 1500 2000 2500
0.01 0.1 1 10
PAM Concentration (mg L-1)
NTU 0 10 20 50 100 a a a a a a
a aaaabb
a ab ab b ab ab bc c
17
Figure 11. Turbidity reduction as a function of input PAM concentration. Flocculation by APS 706b (block) (mixed charge density, mixed molecular weight) alone and with gypsum at four different concentrations on soil 8. For each PAM concentration, data points with different letters are significantly different (p = 0.05). Figure shown in linear-log scale.
0 500 1000 1500 2000 2500
0.01 0.1 1 10
PAM Concentration (mg L-1)
NTU
0 10 20 50 100
a a
a
a ab
ab
b b
ab b
b
c
ab
bc c
d
b bb
b
18
The screening tests of gypsum effects on PAM performance in reducing turbidity of suspensions of soils from around the state suggested that the results will always be site specific. For the three Coastal Plain soils, the effect was positive and dose responsive in soil 1, less positive in soil 2, and ineffective in soil 3 (Figure 12-14). For the two Upper Coastal Plain soils, the effect was very positive for soil 4 with little dose response for gypsum and mostly negative for soil 6 with a trend of a negative dose response (Figure 15-16). The Piedmont and Mountain soils had a generally positive response to adding gypsum to PAM, but the magnitude of the turbidity reduction was not great (Figure 17-19). In most cases gypsum alone was not effective as a flocculant.
19 0 50 100 150 200 250 300 350 400 450 500
0 0.5 1
PAM Rate (mg/L)
T u rb id ity (N TU ) 0 50 400 800 Gypsum (mg/L)
Figure 12. The effects of gypsum on turbidity reduction by A 100 PAM for soil sample 1 (Coastal Plain). 0 100 200 300 400 500 600 700 800 900 1000
0 0.5 1
PAM Rate (mg/L)
T u rb id ity (NTU) 0 5 50 200 400 800 Gypsum (mg/L)
20 0 50 100 150 200 250 300 350
0 0.5 1
PAM Rate (mg/L)
Turbidit y ( N TU ) 0 5 50 200 Gypsum (mg/L)
Figure 14. The effects of gypsum on turbidity reduction by the A 100 PAM on soil sample 3 (Coastal Plain).
0 200 400 600 800 1000 1200 1400 1600
0 2 4
PAM Rate (mg/L)
Tur b id it y (N TU ) 0 200 400 800 Gypsum (mg/L)
21 1 10 100 1000 10000
0 1 2
PAM Rate (mg/L)
Tu r b idity ( N TU ) 0 5 50 200 0 5 50 200 Gypsum (mg/L)
A 100 PAM
Soilfix PAM
Figure 16. The effects of gypsum on turbidity reduction by the A 100 PAM on soil sample 6 (Upper Coastal Plain). Note that the turbidity scale is logarithmic to better view
differences. 1 10 100 1000 10000
0 1 2
PAM Rate (mg/L)
Turbi d it y ( N TU ) 0 5 50 200 Gypsum (mg/L)
22 1 10 100 1000 10000
0 1 2
PAM Rate (mg/L)
T u rb idity ( N TU ) 0 5 50 200 0 5 50 200 Gypsum (mg/L)
A 1606 PAM A 100 PAM
Figure 18. The effects of gypsum on turbidity reduction by the A 100 and A 1606 PAMs on soil sample 8 (Piedmont). Note that the turbidity axis is logarithmic to better view
differences. 1 10 100 1000 10000
0 1 2
PAM Rate (mg/L)
T u rb id it y (NT U ) 0 5 50 200 Gypsum (mg/L)
Figure 19. The effects of gypsum on turbidity reduction by the A 100 and A 1606 PAMs on soil sample 14 (Mountain). Note that the turbidity axis is logarithmic to better view
23
Alternative Systems for Sediment and Turbidity Control
The tests conducted in the sediment basins represents modifications to a typical sediment control device to make it more effective. We also examined the potential of using sediment bags to retain sediment and reduce turbidity, particularly in combination with PAM. These bags are typically used as filters when sediment-laden water is pumped from excavated sites. We tested several different types of materials with and without added PAM by conducting sequences of simulated storm events piped into the bags and measuring turbidity in the outflow.
The first test involved a sediment bag with and without PAM added. Turbidity from the bag alone was mostly over 500 NTU during the test, and remained above 150 NTU as it drained down (Figure 20). The lack of change in turbidity during drain down period was true for all tests in which the sampler continue sampling, so the results further discussed only involve the period of the active test or just five to ten minutes afterward. In comparison, the addition of 705 reduced turbidity in bag outflow to a maximum of 123 NTU, with most samples having much lower turbidity (Figure 21). However, this apparent flocculation also resulted in rapid clogging of the bag pores. The third run had to be stopped at 15 min because of water backing up the pipe, and the fourth and fifth runs the next day also had to be stopped early.
We observed that the force of the water discharging from the pipe inside the bag was primarily hitting the downhill corner of the bag on the same side as the pipe. The neck of typical sediment bags is in one corner, so the incoming flow tends to stay on that side until it collides with the opposite corner. We attempted to prevent this by installing a 45o pipe fitting on the pipe end inside the bag, thereby directing the flow toward the middle of the bag and the far corner. This appeared to dissipate the inflow energy and we tested the effects by conducting two runs each with or without the fitting and with the 705 treatment. The results were not spectacular, with the first run being higher in turbidity with the angle but the second run being much lower (Figure 22). On average the turbidity was lower with the angle and that along with the field observations of energy dissipation caused us to use the angled end for all further tests.
Because of the success in using jute and coir to reduce turbidity in sediment basins in
conjunction with PAM treatment, as well as the apparent clogging problem with conventional bags when PAM is used, we tested a bag constructed of jute. The other potential benefit would be that the bag itself would be biodegradable. The test runs conducted with no PAM resulted in turbidity levels somewhat comparable or even higher than the standard polypropylene bag, with peak values of 2000 – 3000 NTU (Figure 23). Adding the 705 to the simulated runoff resulted in much lower turbidities, but these were still considerably higher than were found for the standard bag with 705 added (Figure 24). We observed that the porosity of the bags resulted in very little back pressure and retention. A natural fiber bag with a tighter weave may have performed much better, although it might be subject to clogging similar to the polypropylene bags.
24
continued to conduct tests on the jute bag with 705 added to determine if it would improve in reducing turbidity as it filled. Turbidity did tend to drop over time, but after seven simulations it was still not as low as for the standard bag (Figure 27).
0 500 1000 1500 2000 2500 3000 3500 4000 4500
0 20 40 60 80 100 120 140
PAM Rate (mg/L)
Tur
b
id
it
y
(
N
TU
)
First Run Second Run Third Run Fourth Run Fifth Run Average
25 0 20 40 60 80 100 120 140
0 5 10 15 20 25 30 35
Time (min) Turbidit y ( N TU ) First Run Second Run Third Run Fourth Run Fifth Run Average
Figure 21. Turbidity in water discharged from a standard sediment bag during five storm simulations in which PAM solution was added to the water prior to entering the bag. The fourth and fifth runs had to be stopped due to reduced flow from the bag and water backing up into the pipe.
0 20 40 60 80 100 120
0 5 10 15 20 25 30 35
Time (min) Tur b idit y ( N TU ) First Run Second Run Average First Run, 45 angle Second Run, 45 angle Average, 45 angle
26 0 500 1000 1500 2000 2500 3000 3500
0 5 10 15 20 25 30 35
Time (min) Tu rb id it y ( N TU ) First Run Second Run Third Run Average
Figure 23. Turbidity in water discharged from a jute sediment bag during three storm simulations without 705 added.
0 200 400 600 800 1000 1200 1400 1600 1800 2000
0 5 10 15 20 25 30 35
Time (min) Tu rb id it y (NT U ) First Run Second Run Third Run Average
27 0
500 1000 1500 2000 2500 3000 3500 4000
0 5 10 15 20 25 30 35
Time (min)
Tu
rb
id
ity (N
TU)
First Run Second Run Third Run Average
Figure 25. Turbidity in water discharged from a porous polypropylene sediment bag lined with burlap. No PAM was added to the simulated storm runoff.
0 100 200 300 400 500 600 700
0 5 10 15 20 25 30 35 40
Time (min)
Tur
b
idity
(N
T
U
)
First Run Second Run Third Run Average
28 0
100 200 300 400 500 600 700 800 900
0 5 10 15 20 25 30 35
Time (min)
Tur
b
idity (NTU
)
First Run, 11-18-03 Second Run, 11-18-03 Third Run, 11-18-03 Fourth Run, 11-20-03 Fifth Run, 11-20-03 Sixth Run, 11-20-03 Seventh Run, 11-25-03 Average
29
REFERENCES
Alley, S.M. and J. Letey. 1988. Polymer and water quality effects on flocculation of montmorillonite. Soil Sci. Soc. Am. J. 52:1453-1458.
Bartholomew, N. 2002. Polyacrylamide for turbidity reduction in runoff: effects of polyacrylamide, soil, and solution properties. MS Thesis, NCSU Libraries:
http://www.lib.ncsu.edu/theses/available/etd-08042003-092105/unrestricted/etd.pdf
Barvenik, F.W. 1994. Polyacrylamide characteristics related to soil applications. Soil Sci. 158: 235-243.
Ben-Hur, M., M. Malik, J. Letey, and U. Mingelgrin. 1992. Adsorption of polymers on clays as affected by clay charge and structure, polymer properties, and water quality. Soil Sci. 153: 349-356.
Fennessey, L.A.J., and A.R. Jarrett. 1997. Influence of principal spillway geometry and
permanent pool depth on sediment retention of sedimentation basins. Trans. ASAE 40(1):53-59.
Green, S.V., D.E. Stott, L.D. Norton, and J.G. Graveel. 2000. Polyacrylamide molecular weight and charge effects on infiltration under simulated rainfall. Soil Sci. Soc. Am. J. 64: 1786-1791.
Havlin, L.H., J.D. Beaton, S.L. Tisdale, and W.L. Nelson. 1999. Soil and Crop Productivity. P. 441-442. Soil Fertility and Fertilizers. 6th ed. Prentice Hall. Upper Saddle Rive, NJ.
Laird, D.A. 1997. Bonding between polyacrylamide and clay mineral surfaces. Soil Sci. 162: 826-832.
Lentz, R. D., and R. E. Sojka. 1994. Field results using polyacrylamide to manage furrow erosion and infiltration. Soil Sci. 158:274-282.
Line, D. E. and N. M. White. 2001. Efficiencies of temporary sediment traps on two North Carolina construction sites. Trans. ASAE 44(5):1207-1215.
McCutchan, Hal, et al. 1993. Polymers Check Furrow Erosion, Help River Life. Cal. Ag. 47: 10-11.
Millen, J. A., A. R. Jarrett, and J. W. Faircloth. 1997. Experimental evaluation of sedimentation basin performance for alternative dewatering systems. Trans. ASAE 40(4):1087-1095.
Minton, G. R., and A. H. Benedict. 1999. Use of polymers to treat construction site stormwater. Proc. Intn’l Erosion Control Assoc. Conference 30, pp. 177-188. IECA, Steamboat Springs, CO, USA.
30
Nadler, A and J. Letey. 1989. Adsorption isotherms of polyanions on soils using tritium labeled compounds. Soil Sci. Soc. Am. J. 53: 1375-1378.
NCDENR 1988. Erosion and Sediment Control Planning and Design Manual. North Carolina Dept. Env. Nat. Res., Div. Land Resources, Raleigh, NC, USA.
Orts, W.J., R.E. Sojka, G.M. Glenn, and R.A. Gross. 1999. Preventing soil erosion with polymer additives. Polymer News. 24:406-413.
Przepiora, A., D. Hesterberg, J. E. Parsons, J. W. Gilliam, D. K. Cassel, and W. Faircloth. 1997. Calcium sulfate as a flocculant to reduce turbidity of sedimentation basin water. J. Environ. Qual. 26:1605-1611.
Przepiora, A., D. Hesterberg, J. E. Parsons, J. W. Gilliam, D. K. Cassel, and W. Faircloth. 1998. Field evaluation of calcium sulfate as a chemical flocculant for sedimentation basins. J. Environ. Qual. 27:669-678.
Reed, J. P., J. M. Miller, D. F. Pence, and B. Schaich. 1983. The effects of low level turbidity on fish and their habitat. N. C. Water Resources Res. Inst. Rep. #190.
Sojka, R.E. and R.D. Lentz. 1997. Reducing furrow irrigation erosion with polyacrylamide (PAM). J. Prod. Agric. 10: 47-52.
Sposito, G. 1984. The surface chemistry of soils. Oxford Univ. Press. New York, NY, USE.
Thaxton, C. S., J. Calantoni, and R. A. McLaughlin. 2004. Hydrodynamic assessment of various types of baffles in a sediment detention pond .Transactions of the ASAE. Vol. 47(3): 741-749 .