18th International Conference on Structural Mechanics in Reactor Technology (SMiRT 18) Beijing, China, August 7-12, 2005 SMiRT18-K04-3
A TEST TO EVALUATE NON-LINEAR SOIL STRUCTURE
INTERACTION
T. Hagiwara
Japan Nuclear Energy Safety
Organization
Phone: 81 3 4511 1824,
Fax: 81 3 4511 1898
E-mail: [email protected]
Y. Kitada
Japan Nuclear Energy Safety
Organization, Vice-chairman of the
CSNI/Seismic Working Group
Phone: 81 3 4511 1822,
Fax: 81 3 4511 1898
E-mail: [email protected]
ABSTRACT
JNES is planning a new project to study non-linear soil-structure interaction (SSI) effect under large earthquake ground motions equivalent to and/or over a design earthquake ground motion of S2.
Concerning the SSI test, it is pointed out that handling of the scale effect of the specimen taking into account the surrounding soil on the earthquake response evaluation to the actual structure is essential issue for the scaled model test. Thus, for the test, the largest specimen possible and the biggest input motion possible are necessary. Taking into account the above issues, new test methodology, which utilizes artificial earthquake ground motion, is considered desirable if it can be performed at a realistic cost.
With this motivation, we have studied the test methodology which applying blasting power as for a big earthquake ground motion. The information from a coalmine company in the U.S.A. indicates that the works performed in the surface coalmine to blast a rock covering a coal layer generates a big artificial ground motion, which is similar to earthquake ground motion.
Application of this artificial earthquake ground motion for the SSI test is considered very promising because the blasting work is carried out periodically for mining coal so that we can apply artificial motions generated by the work if we construct a building model at a closed point to the blasting work area.
The major purposes of the test are to understand (a) basic earthquake response characteristics of a Nuclear Power Plant (NPP) reactor building when a large earthquake strikes the NPP site and (b) nonlinear characteristics of SSI phenomenon during a big earthquake.
In the paper of ICONE-13, we will introduce the test method and basic characteristics of measured artificial ground motions generated by the blasting works on an actual site.
Keywords: SSI test, blast excitation, non-linear, basemat uplift
1. INTRODUCTION
Recently some large earthquake records are reported which have maximum acceleration of nearly equal to 1.0g. In order to confirm the seismic safety of NPPs, we have to study the behaviour of NPP reactor building under such large earthquake ground motions.
The paper proposes new test methodology to evaluate ultimate behaviour of NPP structures against a strong earthquake ground motion. Currently we are planning the vibration tests using large scale model structures by applying artificial ground motions generated by a large scale blast work in the surface coal mine.
evaluate the basic ground motion characteristics and have conducted soil survey of the coal mine site to comprehend the soil properties. In this test project, we are paying particular attention on the basemat uplift.
2. TEST METHODOLOGY
Figure 1 shows a photo of the coal mining site. As it can be seen in the photo, sand-rock, coal and mud-rock form strata, and a sand-rock stratum covers the coal stratum. The blasting power has been applied to remove the sand-rock stratum before mining coal.
A typical blast is being conducted using an underground explosive array (typically, width is a about 80meters, length is about 500meters).
Figure 2 shows a schematic drawing of the field test. We construct a structure model beside an explosive array area taking into account the coal-mining plan and wait for some major blastings conducted for mining. Under this plan we can expose artificial earthquake ground motions of various loads to the model generated by mining blasts.
The advantages of the test method using the blast excitation are; a) Large-scale structures can be tested
b) Ground motions of various amplitudes can be applied.
c) The SSI in actual ground and three-dimensional effects can be taken into account.
Explosive Blast Area
Mudstone Layer (Overburden) Test Structure
with Embedment
Coal Layer Earthquake-like
Ground Motion
Mudstone Layer Surface Layer
Explosive Blast Area
Mudstone Layer (Overburden) Test Structure
with Embedment
Coal Layer Earthquake-like
Ground Motion
Mudstone Layer Surface Layer
COAL LAYER SAND ROCK LAYER
Fig. 2 Vibration test method at mining site
Fig. 1 A picture of a surface coal mine
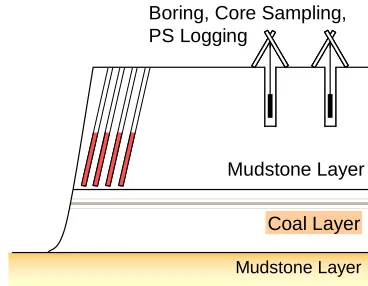
3.1 Soil survey of the test site
The underground structure of the portion near a surface layer is surveyed by the elastic wave surface exploration technique.
We conduct the boring investigation by four borings with a depth of about 30m. Stratum structure and soil properties are examined in detail. The PS logging is carried out using the boreholes.
Mudstone Layer
Coal Layer
Mudstone Layer
Elastic Wave Surface Exploration
Source Receiver Elastic Wave Surface Exploration
Source Receiver
Mudstone Layer
Coal Layer
Mudstone Layer
Boring, Core Sampling, PS Logging
3.2 Measurement of artificial ground motions
We have measured artificial ground motions using the horizontal and vertical arrays. In order to grasp the motion in an area, we place a concrete slab on the ground and measure the slab motion. The wave propagation characteristics of horizontal and vertical motions are studied using these measured records.
3.2.1 Horizontal motion
Artificial ground motions are observed with a horizontal array of accelerometers and the observed horizontal motions are analyzed to study the wave propagation characteristics in the horizontal direction. The analyses are carried out regarding the distances between blasting area and the measuring points and the influence of directivity of the blasting. Figure 6 shows on outline of the measurement, we deploy ten measurements, T01-T10, together with on RC slab
Ground Motion Measurement
Measurement of Basemat
Mudstone Layer
Coal Layer
Mudstone Layer
Basemat(Reinforced concrete)
Accelerometer
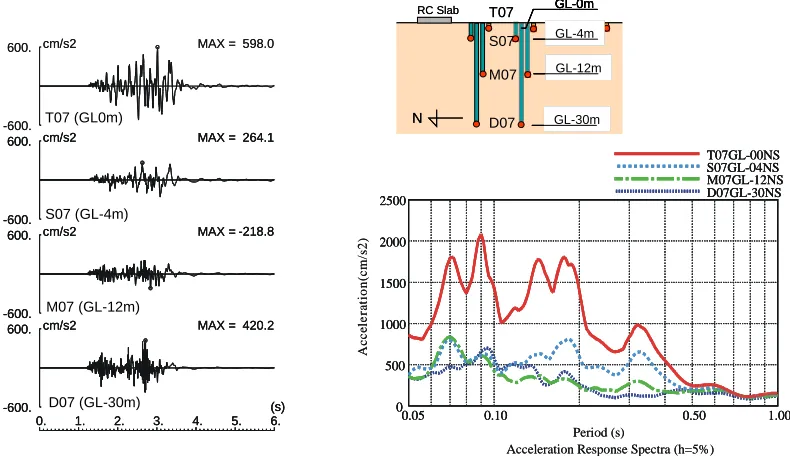
3.2.2 Vertical motion
Artificial ground motions are observed with three vertical arrays T03, T07, and T08 of accelerometers to analyze the wave propagation characteristics of the artificial ground motions in the vertical direction.
The relevance of the acceleration components in the horizontal and the vertical directions of the artificial ground motions are analyzed and evaluated regarding the scale of blasting and acceleration level of the ground motions.
Arrays of accelerometers are installed in three boreholes (see Fig.6).
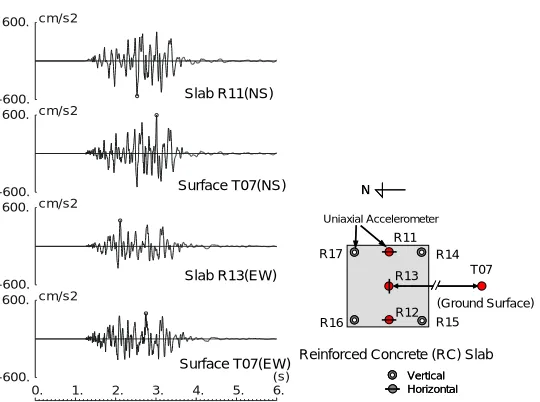
3.2.3 Reinforced concrete slab
In Fig. 6, an outline of the reinforced concrete (RC) slab installed to comprehend the artificial ground motion. The size of the RC slab has 8 meters square in plan and 0.5 meters in thickness. Seven accelerometers are arranged on the slab as shown in Fig.6.
Fig. 5 Measurement of ground motion
RC Slab
GL-30m GL-12m GL-4m GL-0m
T07
S07
M07
D07 N
RC Slab
GL-30m GL-12m GL-4m GL-0m
GL-30m GL-30m GL-12m GL-12m GL-4m GL-4m GL-0m GL-0m GL-0m
T07
S07
M07
D07 N
N
Vertical Array(GL-0m, GL-4m,GL-12m,GL-30m)
Only Surface (GL-0m)
B
B
A RC Slab A
N N
T07 T06 T05 T04
T03 T02 T01
T10 T09 T08
R11
R12 R13
R15 R14
R16 R17
R11
R12 R13
R15 R14
R16 R17
Horizontal Array
Vertical Array
RC Slab
Vertical Horizontal Vertical Horizontal
N N 10m
8m 6m
Blast Area Measurement
Area
Key Plan
Blast Area Measurement
Area
Key Plan
4. MESUAREMENT RESULT 4.1 Result of soil survey
Table 1 shows the physical properties of the soil layers evaluated using the results of PS logging and boring data. The shear wave velocity at the ground surface is about 240 meters/second (m/s) and is increasing with the increment in depth up to about 630 m/s.
Table. 1 Soil properties
P-wave
velocity velocity
GL.(m) (m/s) (m/s)
0-2 Clay 520 240
2-8 Silty Sand
- Clay 980 240
8-12 Clay Stone 980 340
12-21 Clay Stone
- Silt Stone 1750 570
21-30 Clay Stone 1750 630
Stratum S-wave
4.2 Observation result
Three cases of ground motions were measured three times using the observation arrays. The locations of the blast areas for each case are shown in Fig. 7.
The observation results of maximum accelerations are shown in Table 2. The maximum acceleration measured on the ground surface was nearly 1g on December 30 (04/12/30). The 04/12/30 blast was about 300m from the test site.
Acceleration time history records of the horizontal array of T01 to T10 are shown in Fig. 8. The maximum accelerations of the records are almost the same except for the point of T07, which locates the closest to the blasting area.
Test Site
N
04/12/17
04/12/31
04/12/30
Blast Area
Test Site
N
04/12/17
04/12/31
04/12/30
Blast Area
Figure 9 shows the acceleration time histories of vertical array of T07-D07 together with their response spectra. The record in the deepest point contains the frequency components higher than 40Hz and the components raise the maximum acceleration twice. It can be confirmed excepting the phenomenon that the wave propagation characteristics in the vertical direction was similar to a usual earthquake movement. The high frequency components were considerably decreased with
the wave propagation process.
Fig. 7 Locations of blasts and test site
Unit: cm/s2 Date
NS EW UD NS EW UD 04.12.17 75 84 51 93 88 52 04.12.30 546 401 699 971 833 882 04.12.31 252 225 376 337 342 447
* The maximum value
On the RC Slab Ground Surface *
The acceleration time histories on the RC slab are shown in Fig. 10 for comparison. The shape of the records in the same direction (NS and EW) can be found nearly the same. Also when we compare the records with the records on the ground surface, the motions can be found nearly the same. The fact indicates that no particular extraordinary motions are observed in the ground motion observation array and on the RC slab.
Table. 2 Observed maximum acceleration
(s) MAX = cm/s2 1000. -1000. MAX = cm/s2 1000. -1000. MAX = cm/s2 1000. -1000. MAX = cm/s2 1000. -1000. 598.0 674.5 597.6 -366.1 (s) (s) MAX = cm/s2 1000. -1000. MAX = cm/s2 1000. -1000. MAX = cm/s2 1000. -1000. MAX = cm/s2 1000. -1000. MAX = cm/s2 1000. -1000. MAX = cm/s2 1000. -1000. MAX = cm/s2 1000. -1000. 598.0 674.5 597.6 -366.1
T05 (GL0m, NS)
T07 (GL0m, NS) T06 (GL0m, NS) T04 (GL0m, NS)
0.05 0.10 0.50 1.00
0 2500 500 1000 1500 2000 D07GL-30NS M07GL-12NS S07GL-04NS T07GL-00NS Period (s) A c ce ler a ti on (c m/ s2)
Acceleration Response Spectra (h=5%)
0.05 1.00
0.05 0.100.10 0.500.50 1.00
0 2500 0 2500 500 500 1000 1000 1500 2000 1500 2000 D07GL-30NS D07GL-30NS M07GL-12NS M07GL-12NS S07GL-04NS S07GL-04NS T07GL-00NS T07GL-00NS Period (s) A c ce ler a ti on (c m/ s2)
Acceleration Response Spectra (h=5%)
T07 (GL0m)
S07 (GL-4m)
M07 (GL-12m)
D07 (GL-30m)
6. 0. 1. 2. 3. 4. 5.
(s) MAX = 420.2 cm/s2
600.
-600.
MAX = -218.8 cm/s2
600.
-600.
MAX = 264.1 cm/s2
600.
-600.
MAX = 598.0 cm/s2
600.
-600.
6. 0. 1. 2. 3. 4. 5.
(s) 6. 0. 1. 2. 3. 4. 5.
(s) MAX = 420.2 cm/s2
600.
-600.
MAX = 420.2 cm/s2
600.
-600.
MAX = -218.8 cm/s2
600.
-600.
MAX = -218.8 cm/s2
600.
-600.
MAX = 264.1 MAX = 264.1 cm/s2 600. -600. cm/s2 600. -600.
MAX = 598.0 cm/s2
600.
-600.
6. 0. 1. 2. 3. 4. 5.
(s) MAX = 624.3 cm/s2
1000.
-1000.
MAX = 697.4 cm/s2
1000.
-1000.
MAX = -541.6 cm/s2
1000.
-1000. 000
6. 0. 1. 2. 3. 4. 5.
(s) 6. 0. 1. 2. 3. 4. 5.
(s) MAX = 624.3 cm/s2
1000.
-1000.
MAX = 624.3 cm/s2
1000.
-1000.
MAX = 697.4 cm/s2
1000.
-1000.
MAX = 697.4 cm/s2
1000.
-1000.
MAX = -541.6 MAX = -541.6 cm/s2 1000. -1000. cm/s2 1000. -1000. 000
T09 (GL0m, NS) T08 (GL0m, NS)
T10 (GL0m, NS)
6. 0. 1. 2. 3. 4. 5.
(s) MAX = cm/s2
1000.
-1000.
MAX = -587.5 cm/s2
1000.
-1000.
MAX = 603.1 cm/s2 1000. -1000. 000 -971.5 6. 0. 1. 2. 3. 4. 5.
(s) 6. 0. 1. 2. 3. 4. 5.
(s) MAX = cm/s2 1000. -1000. MAX = cm/s2 1000. -1000.
MAX = -587.5 cm/s2
1000.
-1000.
MAX = -587.5 cm/s2
1000.
-1000.
MAX = 603.1 cm/s2
1000.
-1000.
MAX = 603.1 cm/s2
1000.
-1000. 000
-971.5
T02 (GL0m, NS) T03 (GL0m, NS)
T01 (GL0m, NS)
Vertical Array(GL-0m, GL-4m,GL-12m,GL-30m) Only Surface (GL-0m) B
B
A b A
N N T06 T05 T04 T07 RC Sla Vertical Array(GL-0m, GL-4m,GL-12m,GL-30m) Only Surface (GL-0m) B
B
A RC Slab A
N N T07 T10 T09 T08 Vertical Array(GL-0m, GL-4m,GL-12m,GL-30m)
Only Surface (GL-0m) B
B
A RC Slab A
N N
T07 T03 T02 T01
Fig. 8 Acceleration records in horizontal array (04/12/30, NS-dir.)
RC Slab GL-30m GL-12m GL-4m GL-0m T07 S07 M07 D07 N RC Slab GL-30m GL-12m GL-4m GL-0m GL-30m GL-30m GL-12m GL-12m GL-4m GL-4m GL-0m GL-0m GL-0m T07 S07 M07 D07 N N
6. 0. 1. 2. 3. 4. 5.
(s) cm/s2
600.
-600. cm/s2 600.
-600. cm/s2 600.
-600. cm/s2 600.
-600. Slab R11(NS)
Slab R13(EW) Surface T07(NS)
Surface T07(EW)
Uniaxial Accelerometer
R11
R12 R13
R15 R14
R16 R17
Vertical Horizontal Vertical Horizontal Reinforced Concrete (RC) Slab
T07
(Ground Surface) N
N
Fig. 10 Acceleration records of ground surface and RC slab (04/12/30, NS-dir.)
5. ANALYSIS RESULT
79.25
104.09
156.71
194.09
122.88
482.34
694.04
1071.22
1130.79
715.91
657.02
W (ton) Ig(t m2) No.
1
2
3
4
5
Σ
GL 6.5 m
GL 3.75m
GL 1.0 m
GL-2.4 m
GL-4.0m
1
2
3
4 5
Fig. 11 Parameters of building model
5.1 Analytical model
The response analysis of the assumed building model was carried out using the 3D FEM model. The parameters of the assumed building model are shown in Fig. 11. Nonlinearity due to the basemat uplift was modeled by the contact elements between the basemat and the foundation soil. The 3D FEM model is shown in fig. 12. The nonlinearity of the soil was modeled by taking into account equivalent physical properties.
P
δz
com pression Kz
Axial force displacem ent Kz axial stiffness
X Y
Z
50m @2.0m x4
@0.8m x5
16m
50m @4.0m x4
0.2,0.4,1.4,3.0m 1.0,1.0,0.8,0.6,0.4,0.2m
CL
Base m at
Soil
4m 5m
@1.0m x4
Q
δx
Kx
Horizontal force displacem ent Kx horizontal stiffness
contact element
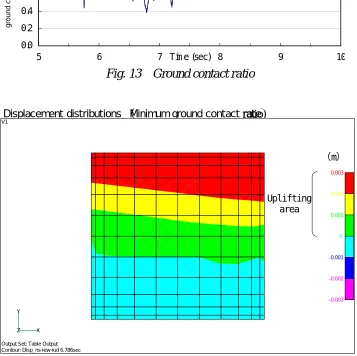
5.2 Response analysis result
The input motion used for the response analysis was the motion observed at M07 (GL-12m) point during the blast work on Dec. 30, 2004. Tri-axes recorded motions were applied to the model simultaneously.
The ground contact ratio is shown in Fig. 13. The vertical displacement distribution of the basemat at the time of the minimum ground contact ratio is shown in Fig. 14. The minimum ground contact ratio is at a 38.7%. Thus one of the nonlinear phenomena was confirmed theoretically by this analysis.
The result indicate the feasibility of the nonlinear soil-structure interaction examination to study the basemat uplift phenomenon, one of the current big issues, using the artificial ground motions generated by the blasting works on an actual site.
min: 0.387 6.786sec
0.0 0.2 0.4 0.6 0.8 1.0 1.2
5 6 7 Tim e (sec) 8 9 0
6. CONCLUSION
JNES is planning a new test project to study non-linear SSI effect on the earthquake response of the safety related important structure, e.g. reactor building, under a big ground motion generated by the blasting works in a surface coal mine regarding the motion as a big earthquake ground motion. In order to confirm a feasibility of using the ground motion as to be an earthquake motion, we have observed ground motions generated in the coal
1
ground cont
act ratio
Fig. 13
Ground contact ratio
Displacement distributions Minimum ground contact
Relative vertical displacem ent. Positive num ber shows the uplifting. X
Y
Z
0.002
0.001
0.
-0.001
-0.002
-0.003 V1
Output Set: Table Output Contour: Disp_ns+ew+ud 6.786sec
Uplifting area
m
rateratio)
0.003
mine and evaluated their basic characteristics.
It was confirmed that the artificial ground motions generated by blasting works were enough acceleration level for the non-linear SSI tests. The observed motions have similar characteristics (horizontal and vertical wave propagation) to the earthquake ground motions.
The feasibility study is still on going, but we have piled up many promising data which indicate the feasibility of performing the non-linear SSI test.
We will continue the observations to confirm the characteristics of the artificial ground motions exceeding the maximum acceleration of 1g. Using these data, we will make detailed plan for the non-linear SSI test.
REFERENCES