6
DIGITAL TERRAIN
ILLUSTRATION
Puter Suhaiza Sulaiman, Mohd. Shafry Abd.
Rahim, Daut Daman
INTRODUCTION
With the availability of systems for visualizing terrain in various ways, the artistic methods of relief representation have largely been ignored within computer graphics system. This is partly because our understanding of the cognitive process involved in sketching is still insufficient. This chapter finds an alternative sketching ways that gives new life to the conventional terrain representation.
While the creative process of producing a sketch may seem hasty and mostly effortless, there are indications that sketching communicates most intimately with the most basic form of visual processing in humans. Sketching is used in many real life situations - like illustrations on a chalk board, doodling on a paper, sketching a map for directions.
One example is directions to get to a certain location within a city. A photographic image from satellite will most likely be of less help than a layman’s sketch, where streets are simple lines and only the ones to be taken en route are drawn.
WHY TERRAIN SKETCHING?
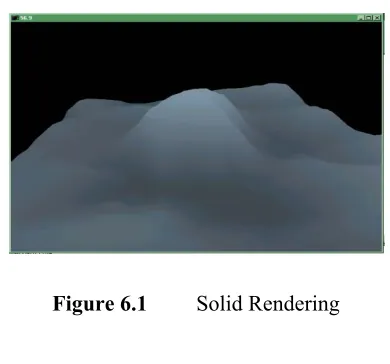
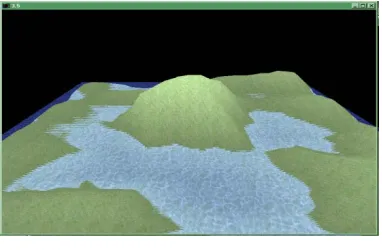
There are a lot of ways to represent terrain in computer graphics. The most popular is solid rendering which represents the terrain in solid mode which can be in plain color or with added texture using mapping technique. A few ways in adding realistic appearance for terrain such as by adding color and shading with the simulation of light and texturing material, promise unbelievable real output at interactive time.
Figure 6.2 Realistic Rendering
Figure 6.3 Wireframe Rendering
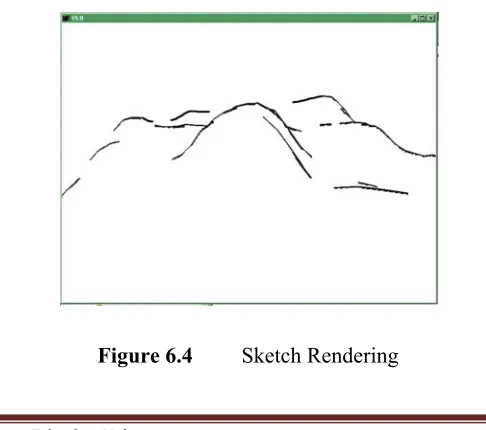
Since sketching offers many benefits in sense of simplicity and providing an outline with necessary detail, making sketching as an appropriate alternative in representing terrain data.
RELATED WORK
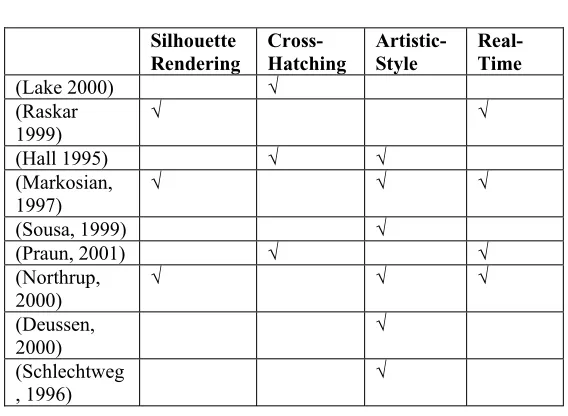
Many researchers have produced sketch style renderers. Apart from the universal real-time/non-real-time distinction, there is another classification that can be used which is silhouette rendering and (cross-) Hatching. While the first style is concerned mainly with the outlining of the silhouette (and/or important feature), the second style attempts to apply relatively flat shading using simulated ink or pencil strokes (refer Table 6.1).
Table 6.1 Sketch style renderers
Silhouette Rendering Cross-Hatching Artistic-Style Real-Time
(Lake 2000) ¥
(Raskar 1999)
¥ ¥
(Hall 1995) ¥ ¥
(Markosian, 1997)
¥ ¥ ¥
(Sousa, 1999) ¥
(Praun, 2001) ¥ ¥
P-Stroke (Visvalingam 2001)
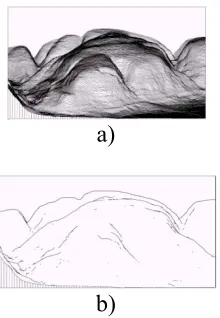
P-stroke sketching involves the use of line generalization algorithm for associating measures of significance to the cells of the DEM (Visvalingam 1998). The sketching technique treats the row and column profiles as independent lines. This algorithm repeatedly scans each line and eliminates the point that contributes the least information to the description of the line.
The DEM cells can be filtered at run time using tolerance values to locate cells (called core cells) lying on scale-related convexities and concavities. These core cells are then extended into P-Stroke and rendered to form the sketch. Even though the P-stroke can give a realistic and convincing landscape sketching (Figure 6.5.b), it is limited only for 2D and 2.5D scene.
a)
b)
Silhouette Rendering (Ruzinoor 2002)
The silhouette rendering of terrain by Ruzinoor (2002) used two different approaches namely Dietrich (1999) and Raskar (1999).
Dietrich (1999) generates silhouettes lines by detecting the edge between front-facing and back-facing polygons. The technique uses the cubemaps technique, taking advantages of a graphics card (GeForce 256) for rendering the silhouette. While Raskar (1999) sets the front-facing polygons as white and the back facing polygon as black wireframe.
The comparisons between the two approaches are presented by Ruzinoor (2002). He concluded that silhouette rendering algorithms are found to be sufficient enough for visualizing the terrain as an artistic sketch.
a)
b)
METHODOLOGY
As shown in Figure 6.7, the overall process of digital terrain illustration consists of two main modules which are height Mapping and Sketching process. The height Mapping process is the pre-processing that is involved in building a 3D terrain model from a 2D data set. The Sketching process is the rendering process which is made of two separate routes - outlining and shading.
Figure 6.7 Digital terrain Illustration Build3DTerrainModel
Read2Ddata
Shading Outline
TerrainSketching
i)HeightMapping
Height Mapping
The simplest form of terrain representation is as a regular height field. For example considering a regular grid in the plane XZ, with evenly spaced points, a height is attributed to each point. This representation saves a lot of space when storing the terrain because only the heights and a reference point are needed. Since the grid is evenly spaced we do not need to store both x and z values for each point.
Starting from this principle, we can easily conceive a height map as a grayscale image, where the intensity of each pixel corresponds to a height.
So the 2D input for the terrain is a grayscale image, where each pixel's intensity corresponds to a relative height. Figure 6.8 shows two examples of grayscale images with different sizes that are being used as an input.
Outline (Silhouette)
The following is a pseudo-code to render silhouette edges in black on white background.
1. Draw background in white color. 2. Enable back face culling, set depth function
to ‘Less Than’
3. Render (front facing) polygons in white 4. Enable front face culling, set depth function
‘Equal To’
5. Draw (back-facing) polygons in black wireframe
6. Repeat for a new viewpoint
Figure 6.9 Silhouette rendering
Front
Facing
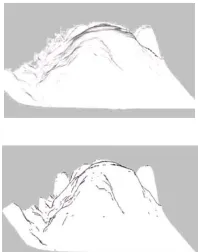
Shading (Hatching)
The Shading is done by creating the pen-and-ink line drawing for the surfaces of the terrain. Some researchers presented methods of placing the line strokes based on the direction field of the surfaces, such as principle curvature direction fields. However, images produced by this method tend to create over-complex hatching pattern.
The steps in creating pen-and-ink line drawing are as follows:
1. Create 2D line texture
2. Generate texture-coordinate (s and t) automatically (with glTexGen() of OpenGL)
3. Texture mapping while drawing each polygons Stroke textures are created with different level (level 1-5) for different darkness during the texture mapping.
a)
b)
Figure 6.10 a) Stipples (b)Lines(Hatch Lines)
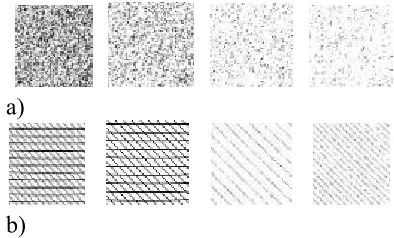
IMPLEMENTATION & RESULT
The following are the results for outline rendering of terrain data:
Data size : 32 X 32
Performance : 67 frame per second
Data size : 1024 X 1024
Figure 6.11 Screen shot
CONCLUSION
REFERENCE
Deussen O., Strothotte T., “Computer-Generated Pen-and-Ink Illustration of Trees”, Proecedings SIGGRAPH 2000.
Hall Peter, “Comic-strip rendering”, Department of Computer Science, Victoria University of Wellington, 1995.
Lake et al, “Stylised Rendering Techniques For Scalable Real-Time 3D Animation”, Graphics Algorithms and 3D Technologies Group (G3D), Intel Architecture Labs (IAL), University of North Carolina at Chapel Hill, 2000.
Markosian L. et al, “Real-Time Nonphotorealistic Rendering”, Brown University site of the NSF Science and Technology Center for Computer Graphics and Scientific Visualization, August 1997. Northrup J. D., Markosian L., “Artistic Silhouettes: A
Hybrid Approach”, Brown University, June 2000. Praun E., Hoppe H., Webb M., Finkelstein A., “Real-Time
Hatching”, Microsoft Research (Hoppe), Princeton University (others), Proceedings SIGGRAPH 2001. Raskar Ramesh, “Hardware Support for Non-photorealistic
Rendering”, MERL, MitsubishiElectric Research Laboratories, 2000.
Raskar Ramesh, Michael Cohen, “Image Precision Silhouette Edges”, Symposium on Interactive 3D Graphics (I3DG), Atlanta, April, 1999.
Salisbury M. P., Wong M. T., Hughes J. F., Salesin D. H., “Orientable Textures for Image-Based Pen-and-Ink Illustration”, University of Washington, Proecedings SIGGRAPH 1997.
Schlechtweg S., Strothotte T., “Rendering Line-Drawing with Limited Resources”, Dept. for Simulation and Graphics, University of Magdeburg, Germany, July 1996.
Sousa M.C., Buchanan J. W., “Computer-Generated Graphite Pencil Rendering of 3DPolygonal Models”, 18(3), Proceedings Eurographics 1999.
Sousa M.C., Buchanan J. W., “Computer-Generated Pencil Drawing”, Dept. of Computer Science, University of Alberta, Canada, 1999.
Visvalingam M, Dowson K, “Towards cognitive evaluation of computer-drawn sketches” The Visual Computer. 17:219-235 Springer-Verlag 2001