CONTRIBUTION TO THE IAEA SOIL-STRUCTURE INTERACTION
KARISMA BENCHMARK
Fan Wang1, Jean-Mathieu Rambach2
1CEA, DEN, DM2S, SEMT, EMSI, F-91191 Gif-sur-Yvette, France ([email protected]) 2IRSN, DSR/SES/BEGC, IRSN, BP 17, 92262 Fontenay-aux-Roses Cedex, France
ABSTRACT
Following the 2007 NCOE Earthquake in Japan which affected severely the Kashiwazaki-Kariwa nuclear power plant, IAEA launched the KARISMA Benchmark in August 2009 with the objective to find out if current simulation methodologies are able to capture the main features of the seismic response under strong Soil-Structure Interaction (SSI). This paper presents the contribution of the French CEA-IRSN joint team to the the Benchmark.
This work consists of 3D finite element modeling for the structure and the nearby soil and the use of viscous absorbing boundary to represent the far-field soil (lateral sides and bottom). Time domain integration is carried out directly on the coupled soil-structure system. The analysis has given good results compared to the recorded structure response during NCOE earthquake. The same procedure allows us furthermore to perform nonlinear soil-structure interaction analysis under extreme seismic loadings by assuming ground motions 2, 4 and 6 times stronger than the NCOE earthquake. Seismic margin of the reactor building has been quantified.
INTRODUCTION
Following the 16 July 2007 Niigataken-Chuetsu-Oki Earthquake in Japan (NCOE) which affected severely the Kashiwazaki-Kariwa Nuclear Power Plant located just 16 km from the epicenter, and under the initiatives of several organisms among which the CEA France, the International Atomic Energy Agency (IAEA), with the help of TEPCO company, owner of the power plant, launched the KARISMA Benchmark (KAshiwazaki-Kariwa Research Initiative for Seismic Margin Assessment) in August 2009. The power plant is composed of 7 BWR type reactors. The building of the Unit 7 Reactor has been chosen as the subject of the benchmark.
The primary objective is to understand what happened to the soil and structures during the earthquake and to find out if current simulation methodologies used by different countries are able to capture the main features of the seismic response under strong Soil-Structure Interaction (SSI). Another important goal of the benchmark is to evaluate the robustness of the reactor buildings against even stronger earthquakes by quantifying the seismic margin of the structure and the equipment using numerical methods.
A total of approximately 20 teams from about 10 countries participated to the benchmark which was held between 2009 and 2012 in three phases:
- Phase I: Modeling, static and modal analyses, soil column analyses,
- Phase II: Response analyses of the structure and equipment during the NCOE earthquake,
- Phase III: Assessment of the seismic margin by multiplying the seismic level.
SSI ANALYSIS USING FINITE ELEMENT METHOD
Soil-structure interaction plays a very important role in this benchmark because the reactor buildings of the power plant are deeply embedded in a relatively soft soil. For SSI analysis, a direct time domain procedure has been implemented in the finite element code CAST3M developed by the CEA
(website:
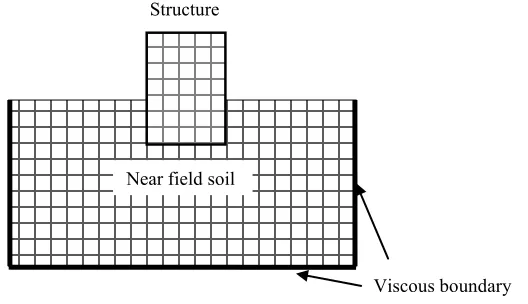
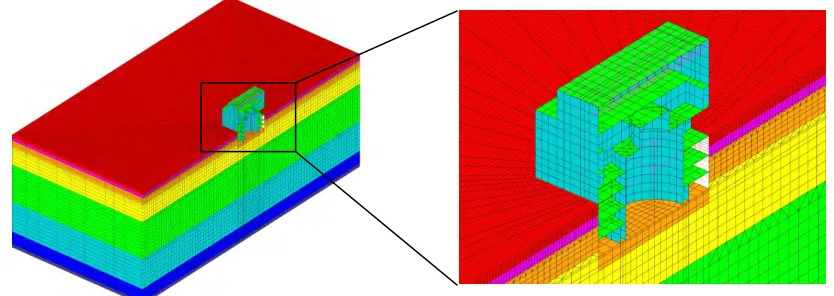
http://www-cast3m.cea.fr). The procedure consists of 3D finite element modeling for thestructure and the near-field soil and the use of Lysmer and Kuhlemeyer (1969) viscous boundary to represent the far-field soil (lateral sides and bottom) as shown in Figure 1. Time domain integration can be carried out directly on the coupled soil-structure system.
Figure 1. SSI analysis using CAST3M finite element code.
Using the geometric dimensions and material data given by the benchmark organizer, the reactor building is modeled with different types of finite elements. In particular, multilayered shell elements are used for the principal lateral-resistant structural components, i.e. the main shear walls and the Reinforced Concrete Containment Vessel (RCCV). These components are assumed to have nonlinear behaviors under strong seismic loadings. This allows us to perform nonlinear soil-structure interaction analysis under extreme seismic loadings when the structure exhibits nonlinear behaviors such as concrete cracking or reinforcement steel yielding. Soil nonlinearity is also taken into account in the SSI analysis by the usual linear equivalent method.
BENCHMARK PHASE I: STRUCTURE AND SOIL MODELING
The Phase I of the KARISMA benchmark consists in modeling the Unit 7 Reactor Building (R/B), carrying out static analysis under static loads, identifying the fixed-base modal parameters of the structure and performing soil column analyses for the main shock and aftershocks of the NCOE. In this phase, the whole R/B structure is supposed to have a linear elastic behavior.
Unit 7 Reactor Building
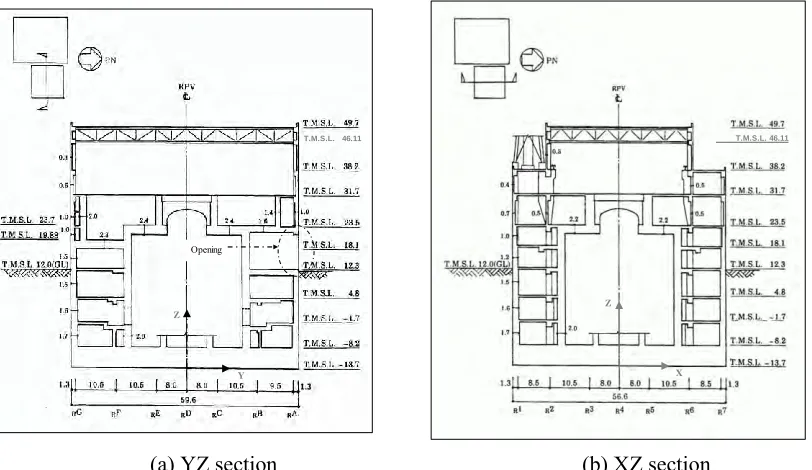
Figure 2 shows the overall geometry of the Unit 7 Reactor Building where T.M.S.L. stands for “Tokyo Mean Sea Level” and PN indicates the Plant North (X direction) which is different from the geographic North. The building is constructed mainly in reinforced concrete except for the roof which is a steel structure. As can be seen in the figure, the Basemat and the 3 levels of the Basement are embedded in soil over 25 meters.
Structure
Near field soil
The structure of the Unit 7 Reactor Building is modeled in 3D using several types of finite elements depending on the geometry of the structural members. The Basemat of the building has a 5.5 m thickness with an almost square form. It is modeled with 8-nodes solid elements as shown in Figure 2(a), Because of its robustness, this part of the structure is considered elastic in the three phases of the benchmark.
The 4 exterior walls, the interior walls as well as the Reinforced Concrete Containment Vessel (RCCV) are modeled using 4-nodes shell elements as shown in figure 2(b) which depicts the element mesh of the 3rd Basement. In addition to the common nodes between the connecting solid and shell elements, a special operator in CAST3M is used to ensure their rotational continuity.
Z
Y
Opening
T.M.S.L. 46.11
X Z
T.M.S.L. 46.11
(a) YZ section (b) XZ section
Figure 2. Cross sections of the Unit 7 Reactor Building.
(a)
(b)
Figure 3. Finite element meshes of the Basemat and the 3rd Basement.
elements. Reinforcement steel ratios for the main structure members as well as concrete and steel properties are given to the participants in the framework of the benchmark.
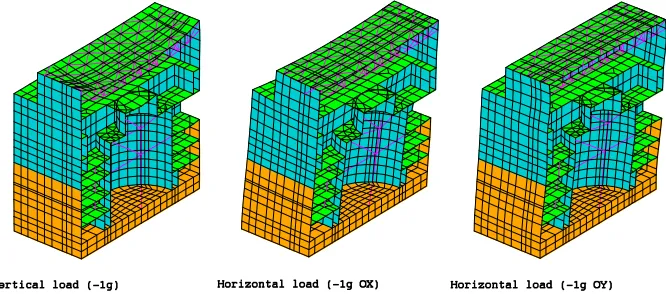
Once the model of the building formed, as requested by the benchmark, elastic analyses are performed under static loads to check its validity. Figure 5 shows the deformed fixed-base structure under gravity loading and unit acceleration (-1g) loading in the X and Y directions. These analyses show that the steel truss of the roof is much more flexible than the rest of the structure which are made of reinforced concrete.
Figure 4. Finite element model of the Reactor Building.
Figure 5. Structure deformation under static loadings.
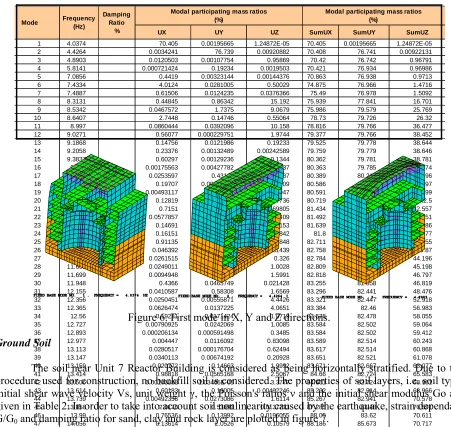
Modal analysis has been performed on the fixed-base structure model using CAST3M. In the frequency range from 0 to 35 Hz, 379 vibration modes have been identified. Among them, many are local modes related to elements of the roof and exert very little influence on the overall response of the structure. The influence of each mode can be measured by their participating mass in X, Y and Z directions. Table 1 lists the first 12 modes with significant contribution to the participating mass.
Table 1: The first 12 modes of the Reactor Building.
UX UY UZ SumUX SumUY SumUZ
1 4.0374 70.405 0.00195665 1.24872E-05 70.405 0.00195665 1.24872E-05
2 4.4264 0.0034241 76.739 0.00920882 70.408 76.741 0.00922131
3 4.8903 0.0120503 0.00107754 0.95869 70.42 76.742 0.96791
4 5.8141 0.000721424 0.19234 0.0019503 70.421 76.934 0.96986
5 7.0856 0.4419 0.00323144 0.00144376 70.863 76.938 0.9713
6 7.4334 4.0124 0.0281005 0.50029 74.875 76.966 1.4716
7 7.4887 0.61506 0.0124235 0.0376366 75.49 76.978 1.5092
8 8.3131 0.44845 0.86342 15.192 75.939 77.841 16.701
9 8.5342 0.0467572 1.7375 9.0679 75.986 79.579 25.769
10 8.6407 2.7448 0.14746 0.55064 78.73 79.726 26.32
11 8.997 0.0860444 0.0392096 10.158 78.816 79.766 36.477
12 9.0271 0.56077 0.000229751 1.9744 79.377 79.766 38.452
13 9.1868 0.14756 0.0121986 0.19233 79.525 79.778 38.644
14 9.2058 0.23376 0.00132489 0.00242589 79.759 79.779 38.646
15 9.3837 0.60297 0.00129236 0.1344 80.362 79.781 38.781
16 9.561 0.00175563 0.00427782 3.6937 80.363 79.785 42.474
17 9.7158 0.0253597 0.43163 0.0220287 80.389 80.217 42.496
18 10.157 0.19707 0.00959971 0.000724709 80.586 80.226 42.497
19 10.302 0.00493117 0.40067 0.00227947 80.591 80.627 42.499
20 10.579 0.12819 0.16397 0.00087736 80.719 80.791 42.5
21 10.646 0.7151 0.0446879 0.0569805 81.434 80.836 42.557
22 10.884 0.0577857 0.00494913 0.29409 81.492 80.84 42.851
23 10.912 0.14691 0.000217922 0.00879153 81.639 80.841 42.86
24 11.033 0.16151 0.00601277 0.0164842 81.8 80.847 42.877
25 11.151 0.91135 0.0060289 0.17848 82.711 80.853 43.055
26 11.496 0.046392 0.0921019 0.81439 82.758 80.945 43.87
27 11.591 0.0261515 0.00321989 0.326 82.784 80.948 44.196
28 11.601 0.0249011 0.16906 1.0028 82.809 81.117 45.198
29 11.699 0.0094948 0.69432 1.5991 82.818 81.811 46.797
30 11.948 0.4366 0.0465749 0.021428 83.255 81.858 46.819
31 12.155 0.0410587 0.58308 1.6569 83.296 82.441 48.476
32 12.356 0.0250451 0.00555871 4.4426 83.321 82.447 52.918
33 12.365 0.0626474 0.0137225 4.0651 83.384 82.46 56.983
34 12.56 0.19221 0.0171424 1.0719 83.576 82.478 58.055
35 12.727 0.00790925 0.0242069 1.0085 83.584 82.502 59.064
36 12.893 0.000206134 0.000591498 0.3485 83.584 82.502 59.412
37 12.977 0.004447 0.0116092 0.83098 83.589 82.514 60.243
38 13.113 0.0280517 0.000176704 0.62494 83.617 82.514 60.868
39 13.147 0.0340113 0.00674192 0.20928 83.651 82.521 61.078
40 13.159 0.020772 0.14663 1.9992 83.671 82.667 63.077
41 13.414 0.98818 0.0565168 2.5067 84.66 82.724 65.583
42 13.506 0.00103888 1.03465E-05 3.3777 84.661 82.724 68.961
43 13.614 0.60183 0.19005 0.00492246 85.262 82.914 68.966
44 13.739 0.00492356 0.0273086 1.6114 85.267 82.941 70.578
45 13.858 2.0176 0.53891 0.0137713 87.285 83.48 70.591
46 13.99 0.76536 0.13992 0.0196055 88.05 83.62 70.611
47 14.056 0.13614 2.0526 0.10579 88.186 85.673 70.717
48 14.082 0.0543535 0.0563137 0.12793 88.241 85.729 70.845
49 14.517 0.13705 0.000903355 0.49489 88.378 85.73 71.339
50 14.684 0.0212239 0.2835 1.2353 88.399 86.013 72.575
Mode Frequency
(Hz)
Modal participating mass ratios (%)
Damping Ratio
%
Modal participating mass ratios (%)
Figure 6. First mode in X, Y and Z directions.
Ground Soil
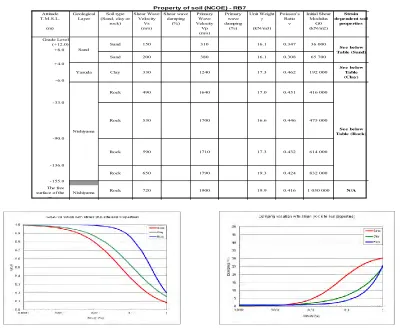
The soil near Unit 7 Reactor Building is considered as being horizontally stratified. Due to the procedure used for construction, no backfill soil is considered. The properties of soil layers, i.e. soil type, initial shear wave velocity Vs, unit weight γ, the Poisson's ratios ν and the initial shear modulus Go are given in Table 2. In order to take into account soil nonlinearity caused by the earthquake, strain dependant
G/G0 and damping ratio for sand, clay and rock layer are plotted in figure 7.
Soil column analysis calculates the seismic response of the free field by supposing that the seismic waves propagate vertically. This is done on a vertical column of soil representative of the geotechnical properties of the site. The goal is to obtain the soil model with shear modulus G and damping ratios compatible with the seismic motion of the free field at different depth of the ground soil.
To do this, we used the software EERA programmed by Bardet et al (2000) which is in fact a modern implementation of the code SHAKE. With this software, one uses a method known as “linear equivalent” which takes into account in a simplified way the effect of the nonlinearity of the ground soil. It consists in seeking a linear equivalent solution in an iterative way by using the curves presented in Figure 7.
Figure 8 shows the results of this analysis for the NCOE Main shock, i.e. the maximum shear
strain, the modulus redaction G/G0 and the damping ratio as a function of the depth of the soil. We can
Table 2. Soil properties near Unit 7 Reactor Building.
Attitude T.M.S.L.
(m)
Geological
Layer (Sand, clay or Soil type rock) Shear Wave Velocity Vs (m/s) Shear wave damping (%) Primary Wave Velocity Vp (m/s) Primary wave damping (%) Unit Weight g (kN/m3) Poisson’s Ratio n Initial Shear Modulus G0 (kN/m2) Strain dependent soil properties +8.0 Nishiyama
Property of soil (NCOE) - RB7
Rock Rock 16.1 0.347 +4.0 Yasuda Sand 150 Sand Sand Grade Level (+12.0) Clay 65 700
200 16.1 0.308
192 000
330 See below Table
(Clay)
-6.0
Nishiyama
490 17.0 0.451 416 000
-136.0
The free
surface of the Rock Rock 650 -155.0 720 -33.0 530 590 Rock -90.0 310 380 1240 1640 1700 1710 1790 36 000 See below Table (Sand) 17.3 0.462
1900 1 050 000
0.424 832 000
19.9 0.416 475 000 17.3 N/A 614 000 19.3 See below Table (Rock) 0.432 16.6 0.446
Figure 7. Strain dependent shear modulus and damping ratio.
Figure 8. Results of soil column analysis, NCOE Main shock, X direction.
Soil-Structure Model with Viscous Boundaries
optimized to reduce the number of elements while meeting the requirements on the dimension of the mesh (usually 5 times the dimension of the foundation due to the approximate nature of the viscous boundary) and the size of elements to ensure correct propagation of the waves in the vertical and radial directions.
Perfect contact between the structure and the soil is imposed by the common nodes of the interface. The final model is composed of about 150 000 finite elements. Viscous boundary is added on the lateral and bottom surface of the soil model to represent the far-field soil which extends to infinity.
Figure 9. Coupled soil-structure model (half of the model plotted here).
BENCHMARK PHASE II : NCOE EARTHQUAKE RESPONSE
The Phase II of the benchmark consists in simulating by calculation the response of the Unit 7 Reactor Building during the main shock of NCOE. The behavior of the building is supposed to be linear elastic as no apparent damage has been observed on the main structure members after the earthquake.
Reference Soil Model and Input Motion
In order to be able to compare the results of the participants of the benchmark, a reference model of the soil near Unit 7 Reactor Building was given by the benchmark organizer. This model was obtained by an independent expert via soil column analysis in a similar way as we described above. The input motion for the SSI analysis is also given by the benchmark organizer. This signal was obtained from a free field surface recording at a location about 200 meters away from the Unit 7 Reactor Building The recording is de-convoluted to the bedrock outcrop (defined as the layer with Vs > 700 m/s) where the motion is supposed to be the same for the two locations.
TimeDomainAnalysis
A special procedure has been implemented in CAST3M to calculate from the input motion, the seismic loading to be applied on the soil model boundary. It is based on the deconvolution method by assuming vertical propagation of seismic waves in the free field soil.
Using this procedure, SSI analysis is carried out in the time domain for the movements in X, Y and Z directions respectively. The time step used for the computation is 0.0025 second. Material damping of the soil and the structure is represented by the Rayleigh model.
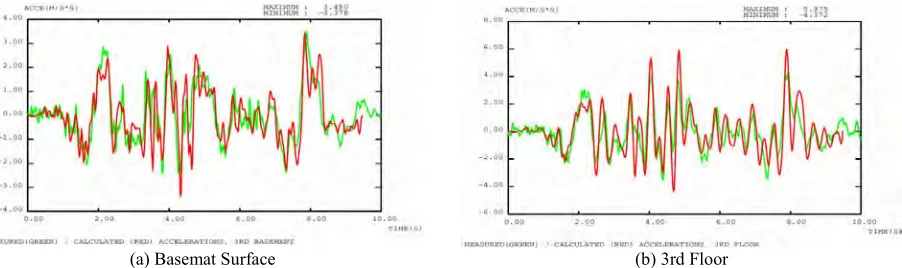
compared in Figure 11 where some differences are observed between the two curves. They show that the calculation over-estimates the frequency of the system.
(a) Basemat Surface (b) 3rd Floor
Figure 10. Response history in the Y direction (green: recording, red: calculation).
(a) Basemat Surface (b) 3rd Floor
Figure 11. Response spectra in the Y direction (blue: recording, red: calculation).
BENCHMARK PHASE III : MARGIN ASSESSMENT
The objective of Phase III is to evaluate the seismic margin of the Reactor Building. That leads to nonlinear SSI analysis by increasing fictitiously the level of earthquake motion.
Increased Seismic Loadings
Four fictitious levels of seismic motion are specified by for phase III. They are defined on the bedrock outcrop by multiplying the amplitude of the signals: 1xNCOE, 2xNCOE, 4xNCOE, 6xNCOE. Figure 12 plots their response spectra on the outcrop of bedrock and on the soil surface. We see a saturation effect on the soil surface response due to the nonlinearity of the soil column, i.e. the peak amplitude for 6xNCOE is almost the same as that of the 4xNCOE on the soil surface.
Nonlinear SSI Analysis
unidirectional materials with elasto-plastic law: for each face of wall, a layer for the horizontal reinforcements and a second layer for the vertical reinforcements.
(a) Bedrock outcrop (b) Soil surface
Figure 12. Response spectra for 1xNCOE, 2xNCOE, 4xNCOE and 6xNCOE (X direction)
The response time-history of the structure in the directions X, Y and Z are calculated simultaneously using CAST3M as the analysis is in the nonlinear domain. Gravity load is also taken into account prior to the dynamic analysis in the form of initial structural stress. Figure 13 shows the response
of the 3rd Floor for the 4 levels of seismic signals. As expected, the amplitude of the response increases
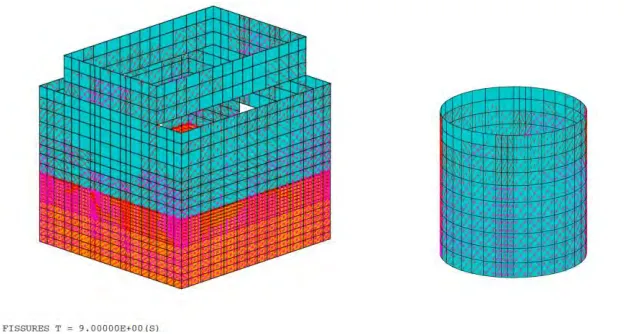
with the level of the input signal but their relation is not linear. For the level of 6xNCOE, generalized cracking can be seen on most part of the structure as shown in figure 14.
Figure 13. Response time-history for 1xNCOE, 2xNCOE, 4xNCOE and 6xNCOE (X direction)
Figure 13. Generalized concrete cracking for 6xNCOE
CONCLUSION
This paper presents the contribution of the French CEA-IRSN team to the KARISMA Benchmark organized by IAEA following the 2007 NCOE Earthquake in Japan which affected severely the Kashiwazaki-Kariwa nuclear power plant.
This work consists of 3D finite element modeling for the structure and the near-field soil and the use of viscous absorbing boundary to represent the far-field soil (lateral sides and bottom). Time domain integration is carried out directly on the coupled soil-structure system. The analysis has given good results compared to the recorded structure response during NCOE earthquake. The procedure also allows us to perform nonlinear soil-structure interaction analysis under extreme seismic loadings by assuming ground motions 2, 4 and 6 times stronger than the NCOE earthquake. Seismic margin of the reactor building has been thus quantified.
The particularity of this work compared to that of the other participants is the fact that the method used is capable of tackling both the unboundedness of the soil media and the nonlinear behavior of the structure such as concrete cracking or reinforcement yielding.
ACKNOWLEDGEMENTS
The authors would like to express their deep thanks to the International Seismic Safety Centre (ISSC) of the International Atomic Energy Agency (IAEA) for organizing the KARISMA Benchmark and TEPCO Company for making data available on the Unit 7 Reactor Building.
REFERENCES
Lysmer J., Kuhlemeyer R.L. (1969). “Finite Dynamic Model for Infinite Media”, J. of the Engineering
Mechanics Division. Vol 91, EM4, pp 859-877
International Atomic Energy Agency (IAEA) (2009). “General specification for the KARISMA Benchmark Exercise”. IAEA-EBP-SS-WA2- KARISMA-SP-0012009, Vienna
International Atomic Energy Agency IAEA (2011). “Guidance Document - PART 1: K-K Unit 7 R/B Structure, PHASE I, II & III”, IAEA-EBP-SS-WA2- KARISMA-SP-002, Vienna