DETERMINATION OF SURFACE RADIATION DOSE-RATE IN THE ENVIRONMENT OF KELATAN STATE MALAYSIA
*NURADDEEN NASIRU GARBA, AHMAD TERMIZI BIN RAMLI, MUNEER AZIZ SALEH, HAMMAN TUKUR GABDO, ABUBAKAR SADIQ ALIYU, MOHD
SYAZWAN BIN MOHD SANUSI
Department of Physics, Faculty of Science, Universiti Teknologi Malaysia, 81310 UTM Johor Bahru, Johor, Malaysia
1
[email protected], [email protected] [email protected],
4
[email protected], [email protected],
5
[email protected] *Corresponding author
Abstract. Measurements of environmental surface radiation dose rate in Kelantan state, Malaysia was carried out using a portable hand held radiation survey meter and Global Positioning System (GPS). The surface radiation dose rates ranged from 44 to 500 nGy h-1. The measurements were done based on geology and soil types of the area. The mean radiation dose rate was found to be 209 ± 8 nGy h-1. Few areas of relatively enhanced activity were located in Pasir Mas, Tanah Merah and Jeli districts which have external gamma dose rates between 300 to 500 nGy h_1. An Isodose map of the state was produced using ArcGIS10 software version 10.1. To evaluate the radiological hazard due to terrestrial gamma dose, the annual effective dose equivalent (AEDE), the mean population weighted dose rate and cancer risk factor were calculated and found to be relative excess lifetime cancer risks were 1.280 mSv y-1, 18 mSv and 1.04×10⁻³ respectively.
Key words Surface radiation dose; Annual effective dose; Cancer risk
1.0 INTRODUCTION
collective radiation exposure of the world’s population[1]. Human beings are continually being exposed to ionizing radiation from natural sources.
There are two main contributors to natural radiation exposures: high-energy cosmic ray particles incident on the earth’s atmosphere and radioactive nuclides that originated from the earth crust and are present everywhere in the environment, including the human body[2].
Humans are exposed to radionuclides through ingestion and inhalation (internal exposure) and/or irradiation from external gamma rays emitted from the radionuclide (external exposure).
Natural environmental radioactivity and the associated external exposure due to gamma radiation depend primarily on the geological conditions[3]. The presence of naturally occurring radionuclides in the environment may result in an external and internal dose received by a population exposed to them directly and via the ingestion/inhalation pathways. The assessment of the radiological impact on a population, as result of the radiation emitted by these radionuclides, is important since they contributes to the collective dose of the population[2]. This paper tried to show the dose rate distribution and its radiological hazards in Kelantan state, Malaysia.
2.0 EXPERIMENTAL
2.1 Materials
The following materials were used in carrying out the research;
A micro roentgen (μR) meter model 19 manufactured by Ludlum
Measurement, USA.
A Global Positioning System, Garmin (GPS Map76)
2.2 METHODS 2.2.1 Study Area
The study area is positioned in the north-east of Peninsular Malaysia, and
is located on latitude 400̍- 5015̍ N and longitude 101015̍ - 102045̍ E in the
north-eastern part of the peninsula, it has a tropical climate with temperature ranges from 21 to 32 °C and intermittent rain fall throughout the year. The wet season is the east-coast monsoon season from November to January and it is situated on
granites set which is undifferentiated intrusive rock [4].The study area consists of
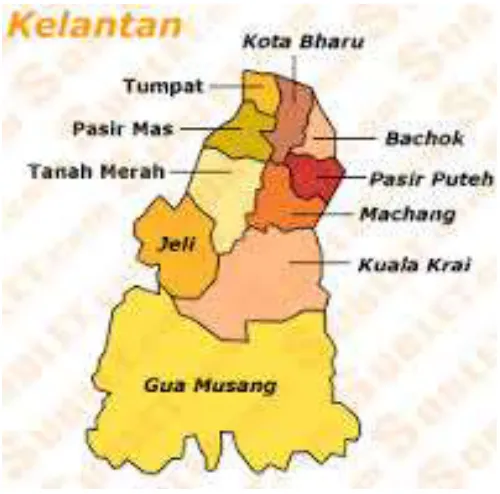
ten (10) districts (Figure 2.2). With Kota Bharu as the most populous district with
a population of 491,237 inhabitants while Jeli district has the smallest population with a total number of 40,637 inhabitants, Kota Bharu is the administrative capital of the state with Kelantan River as the largest river which passes through most part of the state[5].
2.2.2 Data Collection
The Surface radiation dose rate was measured in situ 1 meter above the ground by using Ludlum detector model 19, micro roentgen (μR) meter,
manufactured by Ludlum, USA. It uses (2.54 × 2.54 cm2) sodium iodide (NaI)
crystal doped with thallium (Tl). The instrument was calibrated by Malaysian Nuclear Agency; it is a Secondary Standard Dosimetry Laboratory (SSDL). A global positioning system receiver Garmin model GPS map 76 was use for locating the latitude and longitude of each survey point [6].
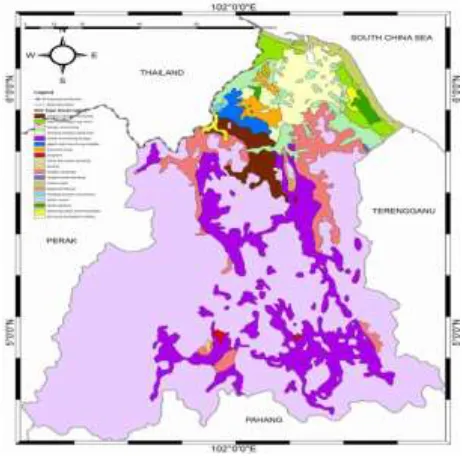
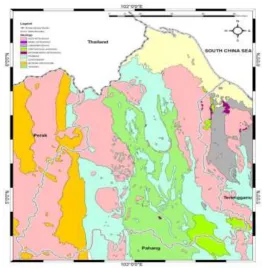
The dose rates were measured from locations with different soil types (Figure 2.3) and geological background (Figure 2.4) randomly. (Figure 3.1) shows the external radiation survey points covering the entire study area. The
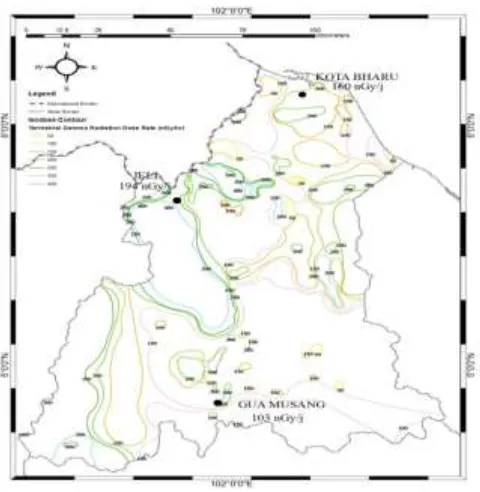
results of the measurements were presented as an Isodose contour map (Figure
3.2) which was drawn using Arc GIS software version 10.1 and modified
according to geological and soil information (from previous aerial survey), where in 1956 an Arial survey was conducted part of which was to indicate the presence of radioactive minerals in Malaya (present Malaysia). The result of the survey shows large radioactive anomalies in the study area due to presence of intrusive igneous rocks.
Figure 2.4: Geological map of the study area
3.0 RESULTS AND DISCUSSION
Surface radiation dose rates were measured from 150 outdoor locations,
with values ranges from 44 nGy h-1 to 500 nGy h-1, with a mean value of 176 ± 5
nGy h-1. This value is three times the world and two times the Malaysian average
of 59 and 92 nGy h-1 respectively as reported by[2]. Enhanced activity ranging
between 400 to 500 nGy h-1 were observed in Kg. Lawang, Hutan Rizab Gunung
Basab, Kg. Sg. Rual and Air Terjun Lata Hujan Gual Ipoh located in Pasir Mas, Jeli and Tanah Merah districts respectively. The highest measurement of 500 nGy
h-1 was observed in Hutan Rizab Gunung Basab, Tanah Merah district with the
lowest value of 44 nGy h-1 found in Kg. Bukit Kuang both in Tanah Merah
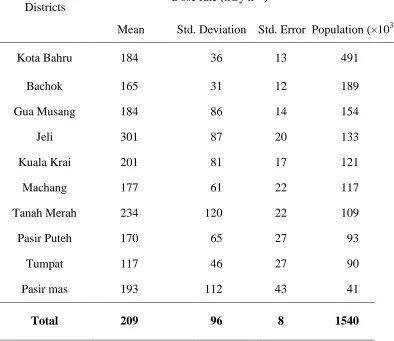
Table 1.0 Mean dose rate and population of each district of the study area
Districts Dose rate (nGy h –1
)
Mean Std. Deviation Std. Error Population (×103)
Kota Bahru 184 36 13 491
Bachok 165 31 12 189
Gua Musang 184 86 14 154
Jeli 301 87 20 133
Kuala Krai 201 81 17 121
Machang 177 61 22 117
Tanah Merah 234 120 22 109
Pasir Puteh 170 65 27 93
Tumpat 117 46 27 90
Pasir mas 193 112 43 41
Total 209 96 8 1540
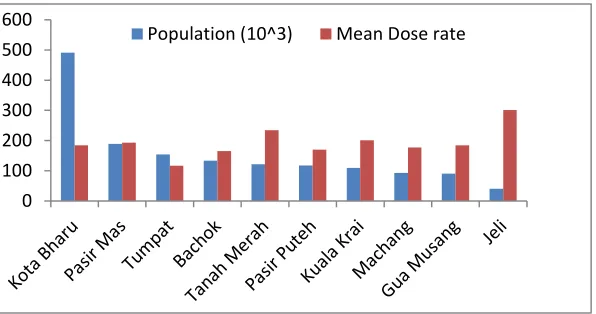
It could be observed (Figure 3.3) Jeli districts recorded the highest mean
TGRD dose rates value of 301 ± 19 nGy h-1 which is about five times the world
average, while Tumpat district has the lowest TGRD Dose rate of 117 ± 26 nGy h
-1
and is approximately two times the world average.
Figure 3.1: Survey location points of the study area
Figure 3.3: A plot of district’s mean dose rate against population of the study area.
Using the conversion coefficient factor for the absorbed dose in air to
effective dose of 0.7 Sv Gy-1, and the outdoor occupancy factor of 0.2[2] the
annual effective dose equivalent (AEDE) outdoors is calculated by using equation
1.
AEDE (mSv y-1) = Dose rate (nGy h-1) x 8760 hours x OF x 0.7 x 10⁻⁶--- (1)
Where AEDE is annual effective dose equivalent in mSv, and OF is occupancy
factor which is 0.2 for outdoor. The average annual effective dose equivalent
outdoors received in habited areas of the study area was found to be 0.22 mSv y.-1
this is higher than the world annual effective dose outdoor equivalent average
value of 0.07 mSv y-1 [2]. This is not expected to contribute significant additional
hazard from the radiological health point of view. The annual dose limit for
members of the public according to [7] is 1 mSv y−1 and this limit is not applicable
to doses received from natural resources.
The information on population distribution was combined with the mean gamma radiation dose rate value for each of the district to yield a
population-weighted mean dose rate of the area which is 184 nGy h−1. The mean population
weighted dose rate, Dw was obtained from the relation in equation. (2).
𝐷𝑊= ∑ 𝐷 ∑ 𝑃̃𝑃− − − − − − − − − − − − − − − − − − − − − − − − − − − (2)
0 100 200 300 400 500 600
Where 𝐷̃ the mean dose rate for each district and P is the corresponding population[8]. This is lower than the geographical mean dose rate which is: 176 ±
5 nGy h−1. Malaysia is one of the countries that have higher than usual values of
terrestrial gamma radiation dose rate [5]. The world average value is 59 nGy h−1
and Malaysian average value is 92 nGy h-1. This higher value obtained in this
study can be attributed to the geological predominance of igneous acidic intrusive granitic rocks in the study area with steep land soil type.
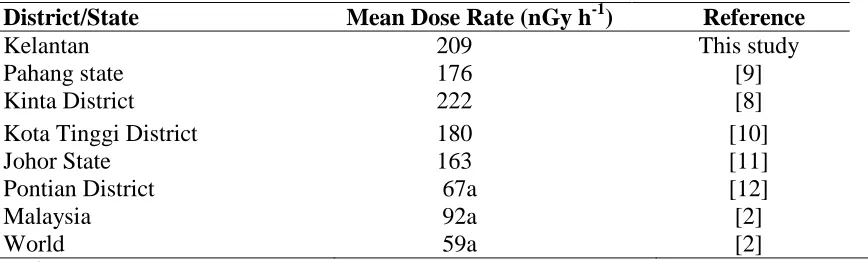
A comparative table consisting of the mean value of terrestrial gamma radiation dose rates in the study area, Malaysia and the world averages are presented in Table 2. It could be observed from the table that the result obtained was in good agreement with those conducted in other part of the country.
Table 2. Mean dose rates in the study area compared with the values reported from other Districts in Malaysia and world average
District/State Mean Dose Rate (nGy h-1) Reference Kelantan Pahang state 209 176 This study [9]
Kinta District 222 [8]
Kota Tinggi District Johor State Pontian District Malaysia World 180 163 67a 92a 59a [10] [11] [12] [2] [2] a
4.0 CONCLUSION
The mean surface radiation dose rate in the study area state was found to
be about two times the Malaysian average and about three times higher than the
world average value. The higher values of the surface radiation dose rate were
associated with soils of granitic origin and with acid intrusive geological
formation.
Acknowledgement
Our sincere appreciation goes to the Malaysian Ministry of Higher education and
the Universiti Teknologi Malaysia for providing a research grant
REFERENCES
[1]. UNSCEAR, S. Sources and effects of ionizing radiation : UNSCEAR 1993 report to the General Assembly with scientific annexes / United Nations Scientific Committee on the Effects of Atomic Radiation, New York: United Nations. 1993.
[2]. UNSCEAR, S. Effects of Ionizing Radiation, 2000 Report to the General Assembly, with Scientific Annexes.United Nations, New York. 2000.
[3]. Ramli, A. T., Rahman, A. T. A. and Lee, M. H. Statistical prediction of terrestrial gamma radiation dose rate based on geological features and soil types in Kota Tinggi district, Malaysia. Applied Radiation and Isotopes. 2003. 59(5-6): 393-405.
[4]. Garba, NN., Ramli, AT, Gabdo, HT, Sanusi, MS Radiological information of kelantan-A Review. Archives of Physics Research. 2013. 4(5): 55-59.
[5]. Department of Statistics, M. Population and Housing Census of Malaysia 2010. 2010: 55.
[6]. Ramli, A. T., Sahrone, S. and Wagiran, H. Terrestrial gamma radiation dose study to determine the baseline for environmental radiological health practices in Melaka state, Malaysia. J Radiol Prot. 2005. 25(4): 435-450.
[7]. Mountford, P. J., Temperton, D.H. Recommendations of the International Commission on Radiological Protection (ICRP) 1990 Eur J Nucl Med 1992. 19(60): 3.
[8]. Lee, S. K., Wagiran, H., Ramli, A. T., Apriantoro, N. H. and Wood, A. K. Radiological monitoring: terrestrial natural radionuclides in Kinta District, Perak, Malaysia. J Environ Radioact. 2009. 100(5): 368-374.
[9]. Gabdo, H. T., Ramli, A. T., Sanusi, M. S., Saleh, M. A. and Garba, N. N. Terrestrial gamma dose rate in Pahang state Malaysia. Journal of Radioanalytical and Nuclear Chemistry. 2014. 10.1007/s10967-014-2928-1.
[10]. Yarar, Y. and Kam, E. Environmental radioactivity concentrations of Tekirdag. High Levels of Natural Radiation and Radon Areas: Radiation Dose and Health Effects. 2005. 1276: 387-389. [11]. Wahab, A. Terrestrial gamma radiation dose and its relationship with soiltype and geology in
Johor State, Malaysia. UTM: M.Sc. thesis. 1998.