ISSN (Print) : 2320 – 3765 ISSN (Online): 2278 – 8875
I
nternational
J
ournal of
A
dvanced
R
esearch in
E
lectrical,
E
lectronics and
I
nstrumentation
E
ngineering
(An ISO 3297: 2007 Certified Organization)
Vol. 5, Issue 3, March 2016
Skin Lesion Segmentation and Classification
Based on High Level Features
M.Priyanka¹, J.Sophia Jone²
PG Student [CS], Dept. of ECE, Bethlahem Institute of Engg, Kanyakumari, Tamilnadu, India¹
Assistant Professor, Dept. of ECE, Bethlahem Institute of Engg, Kanyakumari, Tamilnadu, India ²
ABSTRACT:A set of high-level intuitive features (HLIFs) is proposed to quantitatively describe melanoma in standard camera images. Melanoma is the deadliest form of skin cancer. With rising incidence rates and subjectivity in current clinical detection methods, there is a need for melanoma decision support systems. Feature extraction is a critical step in melanoma decision support systems. Existing feature sets for analyzing standard camera images are comprised of low-level features, which exist in high-dimensional feature spaces and limit the system’s ability to convey intuitive di-agnostic rationale. The proposed HLIFs were designed to model the ABCD criteria commonly used by dermatologists such that each HLIF represents a human-observable characteristic. As such, intuitive diagnostic rationale can be conveyed to the user. Experimental results show that concatenating the proposed HLIFs with a full level feature set increased classification accuracy, and that HLIFs were able to separate the data better than low-level features with statistical significance. An example of a graphical interface for providing intuitive rationale is given.
KEYWORDS:Decision Support, Feature Extraction, Melanoma, Pigmented skin lesion.
I.INTRODUCTION
CUTANEOUS melanoma (i.e., melanoma of the skin) is the deadliest form of skin cancer [1]. The World Health Organization (WHO) estimated that approximately 65 000 global deaths related to melanoma occurred in the year 2000 [2]. This death toll is increasing;melanoma hasincidence rates have been in-creasing on average by 2.6% each year over the last ten years in the U.S. [3]. If caught early when the cancer is localized, a simple excision of the cancerous tissue results in a 98% five-year survival rate [4]. However, if identified late when the cancer has spread remotely, the prognosis is a bleak 15% five-year survival rate [4]. Cutaneous melanoma is the cancerous growth of melanocytes, cells found at the bottom of the epidermal layer of the skin, which are responsible for producing the UV-absorbing pigment melanin. In North America, initial melanoma detection is usually done visually by a general practitioner, followed by a follow-up appointment with a dermatologist for further visual inspection. This process is time- and cost-inefficient, especially with increasing incidence rates [3]. Additionally, the following two factors make it difficult to visually identify melanoma: 1) melanoma can be very similar in appearance to benign nevi (i.e., noncancerous “moles”) at the surface during its early to midst ages and 2) melanoma can take on widely varying shapes and forms. Dermatologists commonly use metrics such as the ABCD (asymmetry, border irregularity, color patterns, and diameter) criteria [5], [6] or the seven-point checklist [7]. However, usage of these metrics is very subjective, leading to large interobserver variability [8]. Systematic objective decision support systems can help meet the demand of the rising rate of melanoma and help reduce subjectivity.
ISSN (Print) : 2320 – 3765 ISSN (Online): 2278 – 8875
I
nternational
J
ournal of
A
dvanced
R
esearch in
E
lectrical,
E
lectronics and
I
nstrumentation
E
ngineering
(An ISO 3297: 2007 Certified Organization)
Vol. 5, Issue 3, March 2016
3) Cluster the patch representations into k color clusters. 4) Quantify the variance found using the original lesion and the k representative colors.
II. PROPOSED SYSTEM
In my project is based on ABCD metric.’A’ means asymmetric high level intuitive features is divided into two types.Color asymmetry and structural similarity.The axis of separation line is used to color asymmetry.Separate major and minor axis.Apply clustering algorithm.The fast fourier transform is used to structural similarity.This transform is used for calculate area.’B’ means border irregularity.Morphological filtering is used.To estimate perimeter.’C’ means color high level intuitive features. ‘D’ means diameter.
The process for classification of cancer consists 4 steps:- i) Preprocessing
ii) Feature extraction a, Low level features
b, High level intuitive features iii) Feature normalization
iv) SVM classifier
ISSN (Print) : 2320 – 3765 ISSN (Online): 2278 – 8875
I
nternational
J
ournal of
A
dvanced
R
esearch in
E
lectrical,
E
lectronics and
I
nstrumentation
E
ngineering
(An ISO 3297: 2007 Certified Organization)
Vol. 5, Issue 3, March 2016
IV MODULE DESCRIPTION
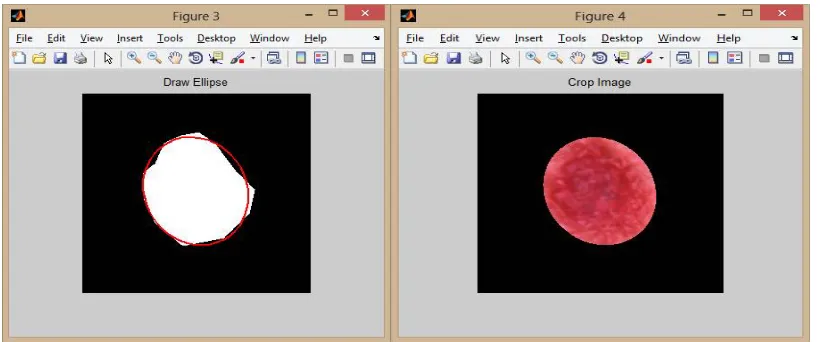
The input is skin lesion image. Initialize the path and browsing the image. Concencate the string. Create the ellipse and crop the image, so getting ROI image. ROI stands for region of interest. Convert ROI into HSV. This HSV stands for high saturation value. The objective of this paper is to present a framework for designing HLIFs and a full set of HLIFs is proposed for quantifying skin lesion characteristics for melanoma detection.
Fig. 1 Input image,creating mask
In Fig 1, Skin lesion image is an input image for my project. Size of the image is 256*256.The input images are classified into 2 types. One is melanoma and other is benign. Detection of melanoma in images obtained using standard camera. Segment the affected portion of cancer. For the Classification purpose we have to crop the input Skin lesion image.
Fig. 2 Create the ellipse, Mask overlap to the image
ISSN (Print) : 2320 – 3765 ISSN (Online): 2278 – 8875
I
nternational
J
ournal of
A
dvanced
R
esearch in
E
lectrical,
E
lectronics and
I
nstrumentation
E
ngineering
(An ISO 3297: 2007 Certified Organization)
Vol. 5, Issue 3, March 2016
Fig. 3 Region of interest image, HSV image and gray scale image
In Fig 3, Segment the region of interest in a rectangular shape. Medical imaging, the boundaries of a tumor may be defined on an image or in a volume, for the purpose of measuring its size. HSV stands for hue saturation and value. To overcome the luminance used hue saturation value.
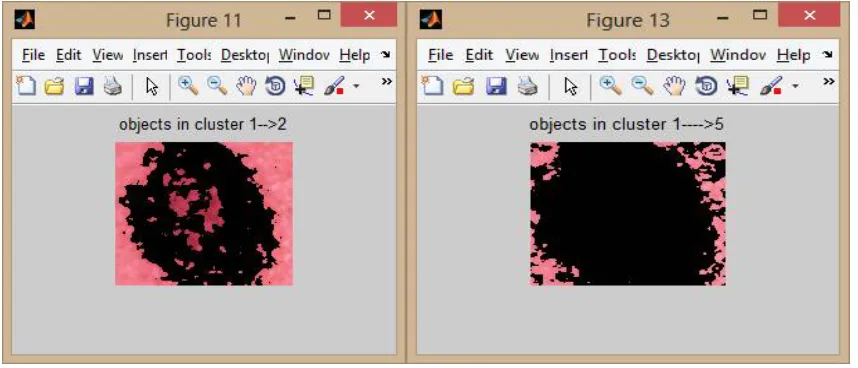
Fig. 4 Image cluster levels
In Fig 4, it shows the image cluster level 1 and 5.Apply the clustering algorithm. This algorithm is used the color high level intuitive features. Image cluster id==1 where total cluster 2.Apply the cluster index 2.Grouping the image based on similarity measurement. Labeling the image by cluster index 2. Image cluster id==1 where total number of cluster 5.Extract the color features. Construct color spatial representations that model the color information for a patch that is local grid.
V. RESULT
ISSN (Print) : 2320 – 3765 ISSN (Online): 2278 – 8875
I
nternational
J
ournal of
A
dvanced
R
esearch in
E
lectrical,
E
lectronics and
I
nstrumentation
E
ngineering
(An ISO 3297: 2007 Certified Organization)
Vol. 5, Issue 3, March 2016
high saturation value. The objective of this paper is to present a framework for designing HLIFs and a full set of HLIFs is proposed for quantifying skin lesion characteristics for melanoma detection.
.
Fig.5 Classifier output
In Fig 5, it shows the classified output. Theproposed method is to classify cancer using SVM classifier. The SVM stands for support vector machine. This classifier is used to classify which type of skin cancer occurs. Our proposed system classifies the Skin lesion type more accurately than the Existing systems. The final classified result shows that the Skin lesion type is Melanoma
Fig.6 Classification accuracy
In Fig 6,the above figure shows the existing and proposed method of map estimation. The melanoma accuracy of existing method is 75%. The benign accuracy of existing method is 82%.The melanoma accuracy of proposed method is 85%.The benign accuracy of proposed method is 95%.
VI. CONCLUSION AND FUTURE WORK
ISSN (Print) : 2320 – 3765 ISSN (Online): 2278 – 8875
I
nternational
J
ournal of
A
dvanced
R
esearch in
E
lectrical,
E
lectronics and
I
nstrumentation
E
ngineering
(An ISO 3297: 2007 Certified Organization)
Vol. 5, Issue 3, March 2016
PNN classifier used to classify which type of skin cancer. And collect the data for the PNN based prediction algorithm. Define the set of values for the training and testing purposes.. And then transform it to the format of PNN. Train the network, with the help of PNN training algorithm, input and output matrices.Identify the suitable value of spread constant s. The value of s cannot be selected arbitrarily. A too small s value can result in a solution that does not generalize from the input/ target vectors used in the design. In contrast, if the spread constant is large enough, the radial basis neurons will output large values for all the inputs used to design a network.
REFERENCES
[1] A. F. Jerant, J. T. Johnson, C. D. Sheridan, and T. J. Caffrey, (2000) “Early detection and treatment of skin cancer,”Amer. Family Physician, vol. 62, no. 2, pp. 357–368.
[2]. K. Korotkov and R. Garcia, (2012) “Computerized analysis of pigmented skin lesions: A review,” Artif. Intell.Med., vol. 56, no. 2, pp. 69–90, 2012.
[3]. I. Maglogiannis and C. N. Doukas,( 2009) “Overview of advanced computer vision systems for skin lesions characterization,”IEEE Trans. Inf. Technol. Biomed., vol. 13, no. 5, pp. 721–733.
[4]. I. Maglogiannis and C. N. Doukas, (2009)“Overview of advanced computer vision systems for skin lesions characterization,”IEEE Trans. Inf. Technol. Biomed., vol. 13, no. 5, pp. 721–733.
[5]. R. Lucas, T. McMichael, W. Smith, and B. Armstrong, (2006) Solar Ultravio-let Radiation: Global Burden of Disease from Solar Ultraviolet Radia-tion(Environmental Burden of Disease Series), A. Pruss-Ustun, H. Zeeb, C. Mathers, and M. Repacholi, Eds. Geneva, Switzerland: World Health Organization, no. 13.
[6]. N. Howlader, A. Noone,(2012)“SEER cancer statistics review, 1975-2010,” National Cancer In-stitute, Bethesda, MD, USA.
[7].American Cancer Society,(2011) “Cancer Facts & Figures 2011,” Ameri-can Cancer Society, Atlanta, GA, USA, Tech. Rep. ACSPC-029771. [8]. W. Stolz, A. Riemann, (1994) “ABCD rule of dermatoscopy: A new practical method for early recognition of malignant melanoma,”Eur. J. Dermatol., vol. 4, no. 7, pp. 521–527.
[9]. F. Nachbar, W. Stolz, T. Merkle, A. B. Cognetta, T. Vogt, M. Landthaler, P. Bilek, O. Braun-Falco, and G. Plewig,( 1994) “The ABCD rule of dermatoscopy: High prospective value in the diagnosis of doubtful melanocytic skin lesions,”J. Amer. Academy Dermatol., vol. 30, no. 4, pp. 551– 559.
[10]. G. Argenziano, G. Fabbrocini, P. Carli, V. De Giorgi, E. Sammarco, and M. Delfino, (1998) “Epiluminescence microscopy for the diagnosis of doubtful melanocytic skin lesions: Comparison of the abcd rule of dermatoscopy and a new 7-point checklist based on pattern analysis,”ArchivesDermatol., vol. 134, no. 12, pp. 1563–1570.
BIOGRAPHY
Miss.M.Priyanka received the B.E degree in Electronics and Communication Engineering in 2014 from Mar Ephraem College of Engg &Tech/Anna University,Chennai. She is currently doing PG Communication Systemsin 2016 at Bethlahem Institute of Engineering at Anna University, Chennai. Her Research activities encompass classify skin cancer with the aid of Medical Image Processing.