Pre-treatment loss to follow-up in tuberculosis patients in low- and
lower-middle-income countries and high-burden countries:
a systematic review and meta-analysis
Peter MacPherson,
aRein MGJ Houben,
bJudith R Glynn,
bElizabeth L Corbett
c& Katharina Kranzer
cIntroduction
Since tuberculosis was declared a global emergency in 1993 by the World Health Organization (WHO), new cases of tuberculosis and deaths from the disease have dropped dramatically in several countries with a high burden of the disease.1 All six WHO regions are on track to meet the Millennium Development Goal target of reducing tuberculosis incidence and deaths from tuberculosis by half between 1990 and 20151,2 and, with the sole exception of the African Region, all are on track to halve tuberculosis mortality rates.2 Nevertheless, the situation remains precarious.3 Twenty-two predominantly low- and middle-income countries were estimated to account for 82% of the 5.7 million tuberculosis cases notified in 20101 and high rates of death from tuberculosis among people living with human immunodeficiency virus (HIV) infection prevail in much of sub-Saharan Africa.4,5
Rapid case identification of individuals with sputum smear-positive tuberculosis and rapid initiation of anti-tuber-culosis chemotherapy are key to controlling tuberanti-tuber-culosis6 and are promoted as part of the DOTS strategy model of passive case-finding that has been adopted by most national tubercu-losis programmes (NTPs).7 From the patient’s perspective, the tuberculosis diagnostic and care pathway (Fig. 1) begins with a recognition of symptoms that prompt care seeking. Individuals may drop out of care during the diagnostic process (“loss to follow-up during diagnostic period”), before initiating treat-ment (“pre-treattreat-ment loss to follow-up”, formerly known as “initial default”) or after treatment has begun. Patients diag-nosed with smear-positive tuberculosis who do not initiate
treatment represent an important failing in the provision of care.8,9 High rates of mortality are reported in this group.10 Moreover, bringing these patients into care could reduce tu-berculosis transmission to others.11 Patients with a diagnosis of tuberculosis who are lost to follow-up before they receive treatment are not included in routine reporting by NTPs. Thus, programme effectiveness may be overestimated.8
Efforts to improve tuberculosis case detection rates have centred on ensuring rapid treatment for all individuals diag-nosed with smear-positive tuberculosis.12,13 With this goal in mind, WHO has recently changed its policy, which now calls for two sputum specimens instead of three and same-day col-lection.13,14 However, assessing the impact of these changes on linkage to treatment has been hampered by a lack of understand-ing of the extent of pre-treatment loss to follow-up8 and of the patient, provider and health system factors that contribute to it.15
Although nearly 50 years have passed since high rates of pre-treatment loss to follow-up were first identified as a po-tential major contributor to the failure of tuberculosis control programmes, researchers and policy-makers have paid little attention to the fate of patients who do not access treatment after receiving a diagnosis of tuberculosis.16,17,18 Indeed, the “Piot model” used to describe loss to care at different stages for any disease was first developed for tuberculosis.18
This study had two main objectives: (i) to systematically quantify pre-treatment loss to follow-up in low- and lower-middle income countries and in countries with a high burden of tuberculosis; and (ii) to describe the reasons for drop-out and the outcomes seen in individuals with a tuberculosis diagnosis Objective To assess the magnitude of loss to follow-up in smear- or culture-positive tuberculosis patients before treatment initiation and outcomes among patients who were traced.
Methods Ovid Medline and Global Health databases were searched for studies published between 1994 and January 2013 that described pre-treatment loss to follow-up in patients with smear- or culture-positive tuberculosis in routine national tuberculosis programmes (NTPs) in low- and lower-middle-income countries and in countries with a high burden of tuberculosis. Data on the proportion of patients who did not initiate treatment after their tuberculosis diagnosis were extracted from studies meeting inclusion criteria. Where available, data on causes and outcomes, including initiation of tuberculosis treatment at another facility, were investigated. Heterogeneity and publication bias were assessed and random-effects meta-analyses by subgroup (region) were performed.
Findings Twenty-three eligible studies were identified, with a total of 34 706 smear- or culture-positive tuberculosis patients from 14 countries (8 in Africa, 5 in Asia and 1 in the western Pacific). Most studies were retrospective and linked laboratory and treatment registers to identify pre-treatment loss to follow-up. Pre-treatment loss to follow-up varied from 4 to 38% and was common in studies from Africa (random-effects weighted proportion, WP: 18%; 95% confidence interval, CI: 13–22) and Asia (WP: 13%; 95% CI: 10–15).
Conclusion Pre-treatment loss to follow-up, common in most settings, can hinder tuberculosis control efforts. By not counting individuals who are lost to follow-up before treatment when reporting standard programme indicators, NTPs underestimate case detection rates and mortality and overestimate cure rates.
a Department of Clinical Sciences, Liverpool School of Tropical Medicine, Pembroke Place, Liverpool, L3 5QA, England. b Department of Infectious Disease Epidemiology, London School of Hygiene & Tropical Medicine, London, England. c Department of Clinical Research, London School of Hygiene & Tropical Medicine, London, England.
Correspondence to Peter MacPherson (e-mail: petermacp@gmail.com).
Bull World Health Organ 2014;92:126–138
|
doi: http://dx.doi.org/10.2471/BLT.13.124800 127 who do not initiate treatment. Asecond-ary objective was to assess the quality of the studies reporting on pre-treatment loss to follow-up.
Methods
Definitions
We followed PRISMA reporting guide-lines for systematic reviews.19 To define the points at which tuberculosis patients drop out of care, we developed the tu-berculosis diagnostic and care pathway described in Fig. 1 using terms recom-mended recently that replace previously used terms such as “initial default”.9
For this study, patients in a national tuberculosis care programme who re-ceived a diagnosis of tuberculosis on the basis of at least one positive sputum smear or culture but did not start tuber-culosis treatment were defined as having pre-treatment loss to follow-up. This included individuals who died before initiating treatment.
The recruitment period was defined as the time during which patients with a diagnosis of tuberculosis were recruited to studies or during which data from such patients were extracted from na-tional programme registers. For studies with individual follow-up, the follow-up period was defined as the time between diagnosis and the most recent date of active follow-up. For studies in which tuberculosis treatment registers were checked retrospectively, we present the minimum and maximum follow-up periods available. Because studies had
different follow-up periods and varying temporal definitions for pre-treatment loss to follow-up, we used the definition given in each study rather than a
time-delineated definition. However, we did require a follow-up period of at least 4 weeks to allow enough time for patients to link to care and treatment.
Fig. 1.
The diagnostic and care pathway for tuberculosis
Loss to follow-up during diagnostic period Care-seeking not
initiated tuberculosis patient Not identified as
Onset of tuberculosis
symptoms
Testing for tuberculosis • Sputum smear
microscopy • Sputum culture Tuberculosis
symptom screen treatment initiatedTuberculosis
Tuberculosis diagnosed • Results of tuberculosis
tests conveyed to patient
Tuberculosis cured or treatment completed Pre-treatment loss to
follow-up Lost to follow-up, on treatment
Table 1.
Systematic strategy used to search for studies on pre-treatment loss to
follow-up in tuberculosis patients
Set MEDLINE Global Health
1 tuberculosis tuberculosis
2 TB patient refusal of treatment
3 TUBERCULOSIS dropout
4 Sets 1–3 were combined with “OR” dropouts
5 PATIENT DROPOUT referral
6 DELAYED DIAGNOSIS delayed
7 REFERRAL AND CONSULTATION attrition 8 DIAGNOSTIC SERVICES retain
9 TUBERCULOSIS, PULMONARY DIAGNOSIS treatment programme 10 initial delay* initial delay
11 initial default* initial default
12 drop out retention
13 attrition diagnostic delay
14 retention treatment delay
15 retain* care seeking
16 diagnostic delay* loss to follow-up 17 treatment delay* lost to follow-up
18 treatment seek* Sets 2–17 were combined with “OR” 19 care seek* Sets 1 and 18 were combined with “AND” 20 loss to follow-up Set 19 was limited to 1994–2013 21 lost to follow-up
22 loss to follow-up 23 lost to follow-up
24 Sets 1–23 were combined with “OR” 25 Sets 4 and 24 were combined with “AND” 26 Set 25 was limited to 1994–2013
Inclusion and exclusion criteria
Studies were included in the review if they reported on the proportion of pa-tients having smear- or culture-positive tuberculosis who experienced pre-treatment loss to follow-up in NTPs in low- or lower-middle-income countries as defined by the World Bank on 1 July 2011,20 or in any of the 22 countries with a high burden of tuberculosis as defined by the Stop TB department of WHO.1 Studies that reported on clinical trials, including randomized and non-randomized active case-finding studies, were excluded because participants in these studies would be more likely to re-ceive intensive follow-up and tracing and would not be representative of patients with tuberculosis diagnosed routinely. Studies that reported only on paediatric patients – i.e. children 15 years of age or younger – were excluded. Studies that recruited both adults and children were included even if the data were not disag-gregated by age group.
Search strategy
We systematically searched the Ovid, Medline and Global Health databases for studies published between 1 Janu-ary 1994 and 31 JanuJanu-ary 2013. Our search strategy is outlined in Table 1. We also hand searched the abstracts of the Union World Conference on Lung Health from 2009 to 2012. We identified additional studies through reference lists and annotated bibliographies and by corresponding with researchers in the field. If the manuscript did not give the absolute number of individuals with pre-treatment loss to follow-up, we contacted the authors to obtain the data.
Three authors (KK, PM, RH) re-viewed titles and abstracts to obtain the full texts of relevant articles. All three assessed the full texts to determine their suitability and based their final inclusion in the review on consensus as a team. PM and KK extracted data from included studies using a pre-designed table.
Quality of selected studies
One researcher (PM) used a modified version of the Newcastle-Ottawa scale to assess studies in terms of quality and of the risk of bias in the selection of participants and in the ascertainment of outcomes. Each study could score up to six points in each of these two categories, each having six items. The section for the selection of comparison groups was removed from the Newcastle-Ottawa
scale because no study had a comparison group. The factors considered included: the representativeness of the patients recruited with respect to the underlying population of tuberculosis patients diag-nosed in the routine health-care system; the test used to ascertain the diagnosis of tuberculosis; the method of identification of pre-treatment loss to follow-up; and the adequacy of follow-up (judged in terms of the proportion of participants whose outcomes were ascertained, with > 85% being adequate). In studies in which laboratory and treatment registers were linked, we evaluated the process and variables used for linkage (including personal identifiers and dates).
Data analysis and statistical
methods
For each included study, we report on the number of patients who received a diagnosis of smear- or culture-positive tuberculosis and the proportion who initiated antituberculosis treatment. For patients identified as having experienced pre-treatment loss to follow-up, we
report the duration of follow-up and, if available, the proportion who were successfully traced and their outcomes (alive but not on treatment; alive after starting treatment; deceased; or trans-ferred to another facility but treatment and vital status unknown). To calculate summary estimates of pre-treatment loss to follow-up, we classified as treatment initiators those tuberculosis patients who were classified as having experi-enced pre-treatment loss to follow-up but who, on tracing, were found to have initiated treatment at an alternative site. We assessed heterogeneity using the I2
statistic. On initial analysis, we found substantial heterogeneity between stud-ies. Therefore, we estimated the pooled proportion of patients with a diagnosis of tuberculosis and pre-treatment loss to follow-up (and the corresponding 95% confidence intervals) using a random-effects model, weighting for the inverse of the variance and stratification by study region. Stata 12.1 (Statacorp, College Station, Texas, USA) was used to analyse the data.
Fig. 2.
Flowchart for the selection of studies on pre-treatment loss to follow-up in
patients with a diagnosis of tuberculosis
Records identified through database searching:
Total (n = 5096) Medline: (n = 2668) Global Health: (n = 1106) IUTBLD Conferences: (n = 1322)
Additional records identified through other sources (n = 5)
Records after duplicates removed (n = 5088)
Records excluded (n = 4942)
Not relevant (n = 4698)
Not low-or-middle income/high tuberculosis burden
country (n = 139)
Only patients already on tuberculosis treatment recruited (n = 38)
Only paediatric cases (n = 12) Only MDR-TB patients (n = 16) Other reasons (qualitative data, review article) (n = 39)
Full-text articles excluded (n = 123)
No data on pre-treatment loss to follow-up (n = 48)
Only patients already on tuberculosis treatment recruited (n = 68)
Qualitative data only (n = 3) Modelling/commentry (n = 3) Duplicate data (n = 1)
Duplicates excluded (n = 13)
Records screened (n = 5088)
Full-text articles assessed for eligibility (n = 146)
Studies included in qualitative synthesis (n = 23)
Studies included in quantitative synthesis (meta-analysis) (n = 23)
Identification
Scr
eening
Eligibilit
y
Included
Bull World Health Organ 2014;92:126–138
|
doi: http://dx.doi.org/10.2471/BLT.13.124800 129Table 2.
Charac
teristics of studies included in the r
evie
w and pr
opor
tion of smear-positiv
e tuber
culosis pa
tients who initia
ted tr
ea
tment
Study
Year(s) study conduc
ted
Countr
y
Setting
Diagnostic crit
erion
Recruitment period
No . with diagnosis of tuber culosis Follo w-up period
Temporal definition of pr
e-tr ea tment loss to f ollo w-up
Method used to confirm
star
t of tr
ea tment No . (%) of pa tients initia ting tr ea tment Cr eek , 2000 27 1997 Botsw ana G abor one , outpa tien t depar tmen t of
public hospital and 13 PHCs
≥ 1 positiv e smear 5 mon ths 184 5–22 mon ths 2 w eeks Retr ospec tiv e link ing of labor at or y r eg ist
er and na
tional elec tronic tuber culosis r eg ist er 165 (90) D embele , 2006 28 2001 Bur kina F aso 6 distr ic ts (including the capital) An
y smear positiv
e 1 year 31 NR ND Retr ospec tiv e link ing of labor at or
y and tr
ea tmen t reg ist ers 27 (87) Afutu , 2012 21 2009 Ghana Reg ional hospital Smear positiv e not fur ther specified 1 year 84 9–27 mon ths ND Retr ospec tiv e link ing of labor at or
y and tr
ea tmen t reg ist ers 52 (62) Glynn, 1998 30 1986–1994 M ala wi Rur al PHCs , one distr ic t hospital ≥ 1 positiv e smear 90 mon ths 682 Up t
o 110 mon
ths ND Pr ospec tiv e mon thly f ollo w-up as par
t of D
emog
raphic and Health
Sur ve y 642 (94) N yir enda, 1998 32 1997 M ala wi Na tional Smear positiv e, not fur ther specified 6 mon ths 3482 2–8 mon ths a ND Retr ospec tiv e link ing of labor at or
y and tr
ea tmen t reg ist ers 2980 (86) Squir e, 2005 10 2000 M ala wi Rur al
, 31 PHCs
, one distr ic t hospital Smear positiv e, not fur ther specified 6 mon ths 157 0–6 mon ths ND Retr ospec tiv e link ing of labor at or
y and tr
ea
tmen
t
reg
ist
ers; home tr
acing of
pa
tien
ts with missing tr
ea tmen t inf or ma tion 134 (85) Uchenna, 2012 36 2009 N iger ia 5 sta
tes in souther
n N iger ia Smear positiv e, not fur ther specified 3 mon ths 323 Up t
o 3 mon
ths 2 da ys Retr ospec tiv e c olla
tion of t
otal
number of tuber
culosis pa
tien
ts
diag
nosed in labor
at or y r eg ist ers and tr ea
ted in tr
ea tmen t r eg ist ers (individual r ec or
ds not linked)
268 (83) Botha, 2008 23 2004–2005 South A frica 13 PHCs ≥ 2 positiv e smears 1 year 367 3–15 mon ths 3 mon ths Retr ospec tiv e link
ing of sputum
collec
tion r
eg
ist
er and tr
ea tmen t reg ist er 303 (83) Botha, 2008 24 2005 South A frica
11 PHCs in the West
er
n C
ape
pr
ovinc
e (8 in C
ape To wn metr opolitan ar ea) ≥ 2 positiv e smears 3 mon ths 227 4–16 mon ths 2 mon ths Retr ospec tiv e link ing of labor at or
y and tr
ea tmen t reg ist ers 203 (89) Claassens , 2010 37 2009 South A frica
133 PHCs in 5 provinc
es Smear positiv e, not fur ther specified 5 mon ths 3020 NR 1 mon th Retr ospec tiv e link ing of labor at or
y and tr
ea tmen t reg ist ers
2268 (75) (cont
in
ue
s
Study Year(s) study conduc
ted
Countr
y
Setting
Diagnostic crit
erion
Recruitment period
No . with diagnosis of tuber culosis Follo w-up period
Temporal definition of pr
e-tr ea tment loss to f ollo w-up
Method used to confirm
star
t of tr
ea tment No . (%) of pa tients initia ting tr ea tment Dunbar , 2011 29 2007 South A frica Tw o c ommunit y clinics Bac ter iolog ically confir med 1 year 306 Up t
o 24 mon
ths b 2 mon ths Retr ospec tiv e link ing of labor at or
y and tr
ea tmen t reg ist ers 243 (79) Da vis , 2011 41 2009 Uganda Fiv e PHCs ≥ 1 positiv e smear 1 year 81 NR ND Pr ospec tiv e c ohor t f ollo w-up ,
with additional r
etr
ospec
tiv
e
link
age of labor
at or y and trea tmen t r eg ist ers f or confir ma tion 62 (77) Chadambuk a, 2011 26 2006 Zimbab w e G ok w e distr ic t Smear positiv e, not fur ther specified 1 year 112 1 mon th ND Retr ospec tiv e link ing of labor at or
y and tr
ea tmen t reg ist ers/” st ock car ds ” 82 (73) Balasubr amanian, 2004 22 1998–2001 India PHCs ≥ 2 positiv e smears 2 years 833 3 mon ths 3 mon ths Retr ospec tiv e link ing of labor at or y r eg ist
er and pa
tien t rec or ds 713 (86) G opi, 2005 31 2001–2003 India One PHC Smear positiv e, not fur ther specified 31 mon ths 1049 2 mon ths 2 mon ths Pr ospec tiv e r ec oncilia tion of labor at or
y and tr
ea tmen t reg ist ers 893 (85) Sai B abu , 2008 34 2006 India 20 distr ic ts in Andhr a P radesh sta te ≥ 2 positiv e smears 3 mon ths 15 361 Cr oss-sec tional: iden tifica
tion of all
initial default
ers
in one quar
ter of
2006
ND
Ex
trac
tion of da
ta fr om labor at or y reg ist er
; home tr
acing of
pa
tien
ts with missing tr
ea tmen t inf or ma tion 14 676 (96) Razia, 2011 39 2009 Pak istan One distr ic t,
including 16 per
ipher al c en tres and fiv e t er tiar y cen tres Smear positiv e, not fur ther specified 1 year 1698 Up t
o one y
ear ND Retr ospec tiv e link ing of labor at or
y and tr
ea tmen t reg ist ers 1597 (94) Rao , 2009 33 2007–2008 Pak istan Chest clinic , K ar achi Smear positiv e, not fur ther specified 5 mon ths 224 Pa tien ts pr ospec tiv ely recruit ed dur ing a 5-mon th per iod; time bef or e tr acing under taken not defined ND Telephone tr
acing of pa
tien
ts
who did not r
etur n f or tr ea tmen t 162 (72) Rao , 2011 40 2010 Pak istan Chest clinic , K ar achi Smear positiv e, not fur ther specified 6-mon ths 1121 Up t o 6 mon ths ND Telephone tr
acing of pa
tien
ts
who did not r
etur n f or tr ea tmen t 947 (84) Kor obitsyn, 2010 38 2008–2009 Tajik istan Four distr ic ts Smear positiv e, not fur ther specified 1 year 254 Up t
o one y
ear ND Retr ospec tiv e link ing of labor at or
y and tr
ea tmen t reg ist ers 209 (82) Uthaiv or avit , 2003 35 1995 Thailand Pr ovincial r ef er ral hospital ≥ 1 positiv e smear 60 mon ths 212 “M id-1996” to
“the end of 2000”
.
Repor
ted in y
ear ly cohor ts ND Pr ospec tiv e link
ing of labor
at or y, trea tmen t r eg ist
er and medical
131 Bull World Health Organ 2014;92:126–138
|
doi: http://dx.doi.org/10.2471/BLT.13.124800Ethics statement
Ethical approval was not required for this study.
Results
Study characteristics
We identified 5096 potentially relevant studies, of which 23 were eligible for in-clusion in the analysis (Fig. 2).10,21–42 These reported on a total of 34 706 patients with smear- or culture-positive tuberculosis, 3474 of whom had experienced pre-treat-ment loss to follow-up. The characteristics of the included studies are summarized
in Table 2. There were 13 studies from
sub-Saharan Africa (8 countries), 9 from Asia (5 countries) and 1 from the western Pacific (1 country).
Most studies reported on pre-treat-ment loss to follow-up among smear-positive patients only. Two studies included patients who were either smear- or culture-positive.29,30 In some studies smear positivity was defined as at least 125,27,28,30,35,41,42 or at least 222–24,34 positive smears, whereas others did not provide any definition.10,21,26,31–33,36–40 A study from South Africa stratified rates of reported pre-treatment loss to follow-up by smear status (smear-positive or smear-negative but culture-positive),23 whereas another study, also from South Africa, reported on pre-treatment loss to follow-up in tuberculosis patients whose diagnosis was established clinically and/ or bacteriologically.29
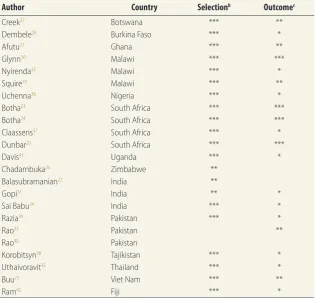
Quality of included studies
The quality of the included studies var-ied (Table 3). Only a few studies (n = 4) showed a low risk of bias or scored full marks across all items assessing patient selection and ascertainment of out-comes. The methods for ascertaining pre-treatment loss to follow-up were suboptimal or poorly described in most studies; only seven studies adequately described the follow-up period allotted to each participant. The majority of stud-ies (n = 19) identified patients diagnosed with tuberculosis by extracting data from laboratory or sputum collection registers (Table 2). Such extraction was performed retrospectively in 17 studies and prospectively in two. In the remain-ing 4 studies, patients with a diagnosis of tuberculosis were identified as part of ongoing epidemiological surveil-lance30 or were prospectively recruited for follow-up from a chest clinic33,40 or
from primary-health-care centres.41 The recruitment periods ranged from 3 months24,34,36 to 90 months.30 Only 9 studies22–25,27,29,31,36,37 applied a cut-off for time since diagnosis – ranging from 1 month to 3 months – to define pre-treatment loss to follow-up.
Although most studies (n = 16) used retrospective linkage of laboratory and treatment registers to identify patients who initiated treatment for tuberculo-sis10,21–29,32,37–39,41,42 – and so scored full marks for this item – the quality of the procedures used to ensure accurate linkage varied considerably. Only one study27 described the variables used to link records and gave the proportion of records that were reliably matched.
Pre-treatment loss to follow-up
The proportion of patients with a diag-nosis of tuberculosis who experienced pre-treatment loss to follow-up ranged from 4 to 38%.21,34 In studies from Africa pre-treatment loss to follow-up ranged from 6 to 38%, whereas in studies from Asia it ranged from 4 to 28%. Studies that reported on data from a single clinical site21,22,26,29,31,33,35,40 had higher rates of pre-treatment loss to follow-up (range: 14–38%) than studies report-ing on national or regional data (range: 4–25%).10,23–25,27,28,30,32,34,36–39,41,42
In total, 10 studies10,24,25,30–34,38,40 at-tempted to trace tuberculosis patients with pre-treatment loss to follow-up (Table 4). One of them did not detail the tracing method used.38 Tracing rates were rather poor on average. The proportion of patients who could not be traced ranged from 0%30 to 77%.32 This limited our abil-ity to draw inferences about the fate of tuberculosis patients with pre-treatment loss to follow-up.
Six studies – five of them from Asia – reported that patients who had initially been classified as being lost to follow-up before being treated had in fact initiated treatment for tuberculosis at another clinical facility.25,31,32,33,34,40 In the Asian studies, transfer to a private clinic for tuberculosis treatment was the commonest reason for pre-treatment loss to follow-up; from 0 to 62% of patients were found to have been treated at private clinics, although only one such study successfully traced more than 80% of the patients.33 In the only study from Africa that traced individuals and recorded if they initiated treatment elsewhere, 23% of tuberculosis patients who were initially classified as lost to follow-up before
treat-Study
Year(s) study conduc
ted
Countr
y
Setting
Diagnostic crit
erion
Recruitment period
No
. with
diagnosis
of tuber
culosis
Follo
w-up
period
Temporal definition of pr
e-tr
ea
tment loss
to f
ollo
w-up
Method used to confirm
star
t of tr
ea
tment
No
. (%)
of pa
tients
initia
ting tr
ea
tment
Buu
, 2003
25
2000
Viet Nam
Distr
ic
t tuber
culosis
units
≥
1 positiv
e smear
1
year
4208
1
mon
th
1
mon
th
Retr
ospec
tiv
e link
ing of
labor
at
or
y and tr
ea
tmen
t
reg
ist
ers
3859 (92)
Ram, 2012
42
2001–2010
Fiji
4 labor
at
or
ies and 2
DO
TS sit
es
≥
1 positiv
e smear
9
years
690
NR
ND
Retr
ospec
tiv
e link
ing of
labor
at
or
y and tr
ea
tmen
t
reg
ist
ers
579 (84)
ND
, not defined; NR, not r
epor
ted; PHC, pr
imar
y-health-car
e c
en
tre
.
a T
he per
iod dur
ing which tuber
culosis labor
at
or
y r
eg
ist
ers w
er
e r
ec
onciled with tuber
culosis tr
ea
tmen
t r
eg
ist
ers is not r
epor
ted
. T
he
“da
ta c
ollec
tion per
iod
” is g
iv
en as r
ang
ing bet
w
een 2 and 8
mon
ths
.
b T
he tr
ea
tmen
t r
ec
or
ds of all individuals with bac
ter
iolog
ically c
onfir
med tuber
culosis dur
ing 2007 w
er
e iden
tified b
y sear
ching elec
tronic tr
ea
tmen
t r
eg
ist
ers f
or 2007 and 2008.
(. . .
co
nt
in
ue
d
ment in Malawi had started treatment for tuberculosis in another district.32
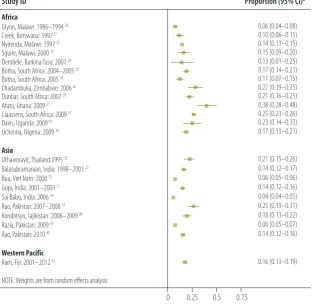
When we counted traced individu-als who had initiated treatment at an alternative site as tuberculosis treatment initiators, we noted substantial hetero-geneity between studies in rates of pre-treatment loss to follow-up (I2 = 98.4%; P < 0.001). This remained after stratify-ing by study region (Africa: I2 = 96.1%; P < 0.001; Asia: I2 = 98.0%; P < 0.001;
western Pacific: one study only). The funnel plot showed asymmetry, sugges-tive of publication bias (Egger’s statistic:
P < 0.001). Fig. 3 shows a forest plot for the included studies, stratified by region. In random-effects meta-analysis, the overall inverse-weighted proportion of patients with a diagnosis of tuberculosis who experienced pre-treatment loss to
follow-up was 16% (95% confidence interval, CI: 13–18). Although this pro-portion was 18% in studies from Africa (95% CI: 13–22) and hence higher than in Asian studies, where it was 13% (95% CI: 10–15%), the CIs overlapped.
Case fatality
Among traced tuberculosis patients with pre-treatment loss to follow-up, the case fatality rate ranged from 0% (95% CI: 0–6)40 to 82% (95% CI: 59–94).10 The risk of death was highest in studies from Africa but varied widely and low rates of tracing rendered it unreliable. Only the study from Malawi described the time from diagnosis to death among 19 patients who were traced:10 a median of 3.5 weeks (range: 2–12) in 14 deceased patients.
Reasons for loss to follow-up
Factors associated with an increased risk of pre-treatment loss to follow-up were male sex, older age,31 living in an urban area,25 diagnosis in a hospital or station-ary clinic (rather than a mobile clinic),23 geographical location of the tuberculosis laboratory (regional versus local),42 and being diagnosed with smear-negative but culture-positive tuberculosis.24 However, distance to treatment site was not associ-ated with the risk of pre-treatment loss to follow-up in Ghana.21
Of the nine studies that traced pa-tients with pre-treatment loss to follow-up, one undertook in-depth qualitative interviews to determine the reasons for drop-out,10 and the other eight were based on structured patient interviews, either in person24,25,30–32,34,40 or by telephone.33,40 Health-system-related obstacles for not starting treatment for tuberculosis includ-ed dissatisfaction with long waiting times in health services, the need for repeated visits, and delays in receiving the results of sputum smears.10,25,29,31 Some reasons for not starting treatment for tuberculosis were patient-related (e.g. difficulty getting time off from work or a lack of under-standing of tuberculosis, its severity or the potential benefits of treatment).10,24,31,33,40 Other reasons were disease-related (e.g. weakness and fatigue).31,32
Discussion
This review highlights the paucity of data on pre-treatment loss to follow-up among patients with a diagnosis of tuberculosis, despite high prevalence and mortality rates. Only 23 studies from 14 countries were identified over a period of 17 years, in sharp contrast with the 37 studies on HIV care programmes in low-resource settings that were published in a period of 5 years.43 Yet pre-treatment loss to follow-up in patients with smear-positive tuberculosis is an important problem for tuberculosis programmes because these patients are highly infectious44 and expe-rience high morbidity and mortality.45,46 In the studies identified in this review, pre-treatment loss to follow-up was high – from 4 to 38% – and was higher in sub-Saharan Africa (18%) than in Asia (13%). Given the very high risk of death among tuberculosis patients who are not prompt-ly treated, minimizing treatment delay and losses at all stages in the diagnostic and care pathway is critically important.12 Although tracing was suboptimal in most
Table 3.
Modified Newcastle-Ottawa Scale for assessment of the quality of the studies
included in the review of pre-treatment loss to follow-up in tuberculosis
patients
aAuthor Country Selectionb Outcomec
Creek27 Botswana *** **
Dembele28 Burkina Faso *** *
Afutu21 Ghana *** **
Glynn30 Malawi *** ***
Nyirenda32 Malawi *** *
Squire10 Malawi *** **
Uchenna36 Nigeria *** *
Botha23 South Africa *** ***
Botha24 South Africa *** ***
Claassens37 South Africa *** *
Dunbar29 South Africa *** ***
Davis41 Uganda *** *
Chadambuka26 Zimbabwe **
Balasubramanian22 India **
Gopi31 India ** *
Sai Babu34 India *** *
Razia39 Pakistan *** *
Rao33 Pakistan **
Rao40 Pakistan
Korobitsyn38 Tajikistan *** *
Uthaivoravit35 Thailand *** *
Buu25 Viet Nam *** **
Ram42 Fiji *** *
a A study can be awarded a maximum of one star for each of three items within the “selection” and
“outcome” categories.
b Assessment of patient selection comprised three items (those that score stars are shown):
(i) representativeness of the cohort (truly representative,* somewhat representative,* selected group of users, no description of derivation); (ii) ascertainment of tuberculosis diagnosis (secure records/ registers,* structured interviews,* written self-report, no description); (iii) demonstration that treatment for tuberculosis was not being taken at recruitment (secure records/registers,* structured interviews,* written self-report, no description).
c Assessment of outcome comprised three items (those that score stars are shown): (i) ascertainment of
Bull World Health Organ 2014;92:126–138
|
doi: http://dx.doi.org/10.2471/BLT.13.124800 133 studies, the main reason for pre-treatment loss to follow-up was death, especially in countries in sub-Saharan Africa with generalized epidemics of HIV infection, perhaps because of the high mortality among patients having both tuberculosis and HIV infection.47,48 It is difficult to ascertain whether these deaths are caused by or result from lack of treatment. Only one study reported the time between di-agnosis and death in patients who did not start tuberculosis treatment; the median of 3.5 weeks found in the study suggests that patients were severely ill at the time of diagnosis.10The diagnostic and care pathway is often costly and long, even in settings where health care and diagnostic tests are free at the point of delivery. Reducing costs and time for the patient might im-prove linkage to treatment. Thus, NTPs should consider the following measures: (i) reducing the number of sputum sam-ples for initial diagnosis from three to two;49 (ii) replacing “spot-morning-spot” sputum collection (requiring visits to the facility on two separate days) with col-lection of two spot sputum samples one hour apart;14 (iii) preparing two smears from the same sputum specimen;50 and (iv) introducing same-day light-emitting diode (LED) microscopy51 or automated nucleic acid molecular diagnostics,52 shown to be more sensitive and associ-ated with reduced time to diagnosis and lower pre-treatment loss to follow-up. Further evaluation of the impact of these interventions on reducing pre-treatment loss to follow-up is required.
Health system factors, particularly relating to the recording and registration of suspected and confirmed tuberculo-sis cases, were found to be important contributors to pre-treatment loss to follow-up in several studies. Moreover, in many studies researchers were required to reconcile laboratory registers with treatment registers to determine the pre-treatment loss to follow-up rate, a task not easy to perform regularly under rou-tine programmatic conditions. These is-sues could be addressed by using a single patient identifier for the entire diagnostic and care pathway for tuberculosis. Pa-tients attending a facility with a positive screening for symptoms of tuberculosis would be recorded in a “cough regis-ter”53 for subsequent monthly tracing of those whose smear results had not been received and of smear-positive patients who had not returned for treatment.
Table 4.
Out
comes obser
ved in studies of pr
e-tr
ea
tment loss t
o f
ollo
w-up in tuber
culosis pa
tients
Author Countr y No. lost t
o follo w-up bef or e tr ea tment Pa
tients not traced
Pa
tients traced
No.
% (95% CI)
No. Deceased No . tr ea ted else wher e (priv at e sec tor) No . transf err ed , tr ea tment sta tus unk no wn Aliv
e, not on tr
ea
tment
Lost
a
No.
% (95% CI)
No.
% (95% CI)
No.
% 95% CI)
Glynn 30 M ala wi 40 0 0 (0.00–0.09) 40 25 0.63 (0.47–0.76) 0 0 0 0 (0.00–0.09) 15 0.38 (0.24–0.53) N yir enda 32 M ala wi 502 386 0.77 (0.73–0.80) 116 b 40 0.34 (0.26–0.44) 27 ( outside distr ic t) 23 2 0.02 (0.00–0.06) 20 0.17 (0.11–0.25) Squir e 10 M ala wi 20 3 0.15 (0.05–0.36) 17 14 0.82 (0.59–0.94) 0 1 2 0.12 (0.04–0.40) 0 0 (0.00–0.18) Botha 24 South A frica 58 26 0.45 (0.33–0.58) 32 14 0.44 (0.28–0.61) 0 0 18 0.56 (0.39–0.72) 0 0 (0.00–0.11) G opi 31 India 156 79 0.51 (0.43–0.58) 77 23 0.30 (0.21–0.41) 13 ( outside ar ea) 0 33 0.39 (0.29–0.45) 8 0.09 (0.05–0.17) Sai B abu 34 India 685 402 0.59 (0.55–0.62) 278 c 152 0.55 (0.49–0.60) 38 (pr iv at e) 22 28 0.10 (0.07–0.14) 38 0.13 (0.10–0.18) Rao 33 Pak istan 62 7 0.11 (0.06–0.22) 55 0 0 (0.00–0.06) 6 (pr iv at e) 0 25 d 0.45 (0.33–0.58) 0 0 (0.00–0.06) Rao 40 Pak istan 173 82 0.47 (0.40–0.55) 91 1 0.01 (0.00–0.06) 15 (pr iv at e) 0 0 e 0 (0.00–0.04) NS NS Kor obitsyn 38 Tajik istan 45 27 0.60 (0.45–0.73) 18 2 0.11 (0.03–0.33) 0 0 3 0.17 (0.06–0.39) 3 0.72 (0.49–0.88) Buu 25 Viet Nam 349 174 0.50 (0.45–0.55) 175 f NS NS 108 (pr iv at e) NS 67 0.38 (0.31–0.46) NS NS CI, c onfidenc e in ter
val; NS, not sta
ted
.
α P
atien
ts with k
no
wn addr
esses
, but when the home visit w
as c
onduc
ted the
y had mo
ved a
w
ay but w
er
e k
no
wn t
o be aliv
e.
b F
our pa tien ts w er e dischar ged fr
om hospital bef
or
e smear r
esult w
as r
epor
ted
.
c N
inet een pa tien ts w er e f ollo w-up cases
, not ne
w diag
noses; 24 w
er
e chr
onic cases
, not ne
w diag
noses
.
d T
w en ty-f our pa tien ts w er e tr ac
ed and put on tuber
culosis tr
ea
tmen
t.
e N
inet y pa tien ts w er e tr ac
ed and put on tuber
culosis tr
ea
tmen
t.
f T
hr
ee pa
tien
ts did not w
an
t t
o par
ticipa
te in the study and fiv
e pa
tien
ts w
er
e judged not t
o ha ve tuber culosis . Not e:
The 95% CIs w
er
e calcula
ted b
y authors using da
ta in selec
ted studies
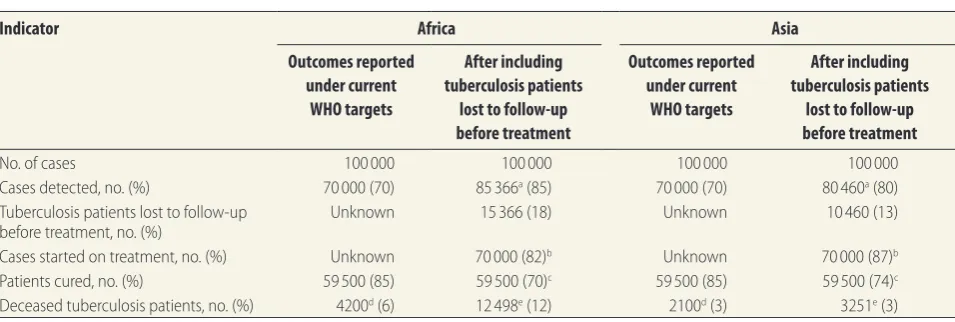
By not including individuals lost to follow-up before treatment when reporting standard programme indica-tors, NTPs incorrectly report case de-tection, cure and case fatality rates. For example, with DOTS strategy targets of 70% case detection and 85% cure rate, including individuals who experience pre-treatment loss to follow-up (using 18% in Africa and 13% in Asia, for il-lustration), would result in the true case detection rate rising from 70% to 85% in African countries and 70% to 80% in Asian countries, as those diagnosed but not started on treatment are included
(Table 5). The cure rate however would
drop from 85% to 70% in Africa and from 85% to 74% in Asia, as those de-tected but not started on treatment are counted as “not cured”. Moreover, in Af-rican countries, where the higher death rate in individuals with pre-treatment loss to follow-up could be attributable to HIV infection, the reported death
rate would increase from 6 to 12%. In NTPs from Asia, the death rate would be unchanged at 3%. These numbers better reflect NTP’s actual performance – they are finding more cases than thought, but are not performing so well at providing treatment.
In studies from Asia, where more private practitioners offer tuberculosis treatment services alongside NTPs,54,55 a small number of patients lost to follow-up initiated treatment with private pro-viders. Since they would not be included in NTP reports of outcomes, the success of the national programme would be un-derestimated. Interventions to improve links and data sharing between NTPs and private providers have proved effec-tive in increasing case detection rates in studies from Asia56,57 and are promoted by WHO.58 Further expansion of such interventions will help to ensure that programme outcomes are accurately reported at the national level.
A limitation of this analysis is the poor quality of outcome ascertainment in several studies. The small number of traced individuals who had initiated treatment under a different provider un-derscores the need to tailor tuberculosis services to the individual patient and the difficulty of accurately estimating outcomes at the programme level. The varying length of follow-up of tubercu-losis patients in cohort studies and the absence of time-delineated definitions for pre-treatment loss to follow-up make it difficult to draw firm conclusions. Fol-lowing the framework set out in Fig. 1, NTPs should strive to adopt and routine-ly report retention in care throughout the diagnostic and care pathway.16,59 A focus on retention could enhance the reporting of the pre-treatment loss to follow-up rate (e.g. the proportion of smear-positive patients not initiating treatment for tuberculosis within 3 months) as part of the regular quarterly reporting system, in addition to allowing comparison within and between NTPs.
A second limitation is that nega-tive publication bias may have resulted in an under- or overestimation of pre-treatment loss to follow-up in this review. Although we undertook a systematic literature search, we may have missed some studies reporting on pre-treatment loss to follow-up if this was not the main focus of the study.
Because the studies identified were so heterogeneous, the summary esti-mates should be interpreted cautiously. Our ability to draw conclusions on the risk factors or reasons for pre-treatment loss to follow-up among people with tuberculosis is limited by the poor re-porting of the baseline characteristics of study participants and low numbers of traced patients in several studies. We identified studies from 8 of the world’s 22 countries with a high burden of tuberculosis. Although the data from these countries are helpful in showing the important contribution of pre-treatment loss to follow-up to suboptimal NTP performance, data from a broader range of countries and regions are urgently needed. In particular, no studies from Latin American countries or the Russian Federation were identified, perhaps be-cause these countries have produced no studies or because we limited our search to English-language sources. To facilitate comparisons between studies and re-gions, all studies reporting outcomes in patients with a diagnosis of tuberculosis
Fig. 3.
Proportion of patients with a diagnosis of tuberculosis who were lost to
follow-up before treatment
ain 23 studies from Africa, Asia and the western Pacific
Study ID Proportion (95% CI)b
Africa
Glynn, Malawi: 1986–1994 30 0.06 (0.04–0.08)
Creek, Botswana: 1997 27 0.10 (0.06–0.15)
Nyirenda, Malawi: 1997 32 0.14 (0.13–0.15)
Squire, Malawi: 2000 10 0.15 (0.09–0.20)
Dembele, Burkina Faso: 2001 28 0.13 (0.01–0.25)
Botha, South Africa: 2004–2005 23 0.17 (0.14–0.21)
Botha, South Africa: 2005 24 0.11 (0.07–0.15)
Chadambuka, Zimbabwe: 2006 26 0.27 (0.19–0.35)
Dunbar, South Africa: 2007 29 0.21 (0.16–0.25)
Afutu, Ghana: 2009 21 0.38 (0.28–0.48)
Claassens, South Africa: 2009 37 0.25 (0.23–0.26)
Davis, Uganda: 2009 41 0.23 (0.14–0.33)
Uchenna, Nigeria: 2009 36 0.17 (0.13–0.21)
Asia
Uthaivoravit, Thailand:1995 35 0.21 (0.15–0.26)
Balasubramanian, India: 1998–2001 22 0.14 (0.12–0.17)
Buu, Viet Nam: 2000 25 0.06 (0.05–0.06)
Gopi, India: 2001–2003 31 0.14 (0.12–0.16)
Sai Babu, India: 2006 34 0.04 (0.04–0.05)
Rao, Pakistan: 2007–2008 33 0.25 (0.19–0.31)
Korobitsyn, Tajikistan: 2008–2009 38 0.18 (0.13–0.22)
Razia, Pakistan: 2009 39 0.06 (0.05–0.07)
Rao, Pakistan: 2010 40 0.14 (0.12–0.16)
Western Pacific
Ram, Fiji: 2001–2012 42 0.16 (0.13–0.19)
NOTE: Weights are from random effects analysis
0 0.25 0.5 0.75
CI, confidence interval.
a All studies combined represent 34 706 patients with a diagnosis of tuberculosis; 3267 were lost to
follow-up before treatment.
b The 95% CIs were calculated by authors from data provided in selected studies.
Bull World Health Organ 2014;92:126–138
|
doi: http://dx.doi.org/10.2471/BLT.13.124800 135صخلم
نم ايندلا ةيحشرلا نادلبو لخدلا ةضفخنلما نادلبلا في لسلا ضىرم في هتعباتم ررقلما جلاعلا لبق ام ةلحرم في نادقفلا
يفصو ليلتحو يجهنم ضارعتسا :ليقثلا ضرلما ءبع تتح حزرت يتلا نادلبلاو طسوتلما لخدلا
نيذلا لسلا ضىرم في هتعباتم ررقلما نادقفلا مجح مييقت
ضرغلا
ءدب لبق مبه صالخا ةعرزلما وأ ةخاطللا رابتخا جئاتن ةيبايجإ تتبث
.مهعبتت مت نيذلا ضىرلما ينب لئاصلحاو جلاعلا
و
Medline
و
Ovid
تانايب دعاوق في ثحبلا مت
ةقيرطلا
نم ةترفلا في اهشرن مت يتلا تاساردلا نع
Global Health
لبق ام ةلحرم في نادقفلا تفصو يتلا 2013 رياني لىإ 1994
جئاتن ةيبايجإ تتبث نيذلا لسلا ضىرم في هتعباتم ررقلما جلاعلا
ةينيتورلا ةينطولا جمابرلا في مبه صالخا ةعرزلما وأ ةخاطللا رابتخا
ايندلا ةيحشرلا نادلبو لخدلا ةضفخنلما نادلبلا في لسلا ةحفاكلم
.لسلل ليقثلا ءبعلا تتح حزرت يتلا نادلبلاو طسوتلما لخدلا نم
جلاعلا اؤدبي لم نيذلا ضىرلما ةبسن نأشب تانايبلا صلاختسا متو
.جاردلإا يرياعم تبل يتلا تاساردلا نم لسلاب مهصيخشت دعب
ءدب كلذ في ماب ،لئاصلحاو بابسلأاب ةينعلما تانايبلا يرتح متو
مييقت متو .ًاحاتم كلذ ناك ماثيح ،رخآ قفرم في لسلا جلاع
تايرثأتلل ةيفصولا تلايلحتلا ءارجإو شرنلا في زيحتلاو ةيرياغتلا
.)ميلقلإا( ةيعرفلا ةئفلا بسح ةيئاوشعلا
لياجمإ لىع تلمتشا ةلهؤم ةسارد نيشرعو ثلاث ديدتح مت
جئاتنلا
رابتخا جئاتن ةيبايجإ تتبث نيذلا لسلا ضىرم نم ًاضيرم 34706
في 5و ايقيرفأ في 8( ًادلب 14 نم مبه ةصالخا ةعرزلما وأ ةخاطللا
تاساردلا مظعم تناكو .)ئدالها طيحلما برغ في ةدحاوو ايسآ
نادقفلا ديدحتل جلاعلا تلاجسو برتخلما ينب تطبرو ةيعاجترسا
ةلحرم في نادقفلا حوارتو .هتعباتم ررقلما جلاعلا لبق ام ةلحرم في
في ًاعئاش ناكو % 38 لىإ % 4 نم هتعباتم ررقلما جلاعلا لبق ام
؛% 18 :ةيئاوشعلا تايرثأتلل ةحجرلما ةبسنلا( ايقيرفأ تاسارد
should specify the proportion that is lost to follow-up before getting treated.
In conclusion, there is a paucity of evidence on the magnitude and clinical consequences of pre-treatment loss to follow-up in tuberculosis patients. The limited data available suggest that pre-treatment loss to follow-up is common and that it entails a high risk of death. There is an urgent need to improve the recording and reporting of pre-treatment loss to follow-up and to evaluate and scale up interventions to reduce this problem. ■
Acknowledgements
Peter MacPherson and Elizabeth L Corbett are also affiliated with TB/HIV Group, Malawi-Liverpool-Wellcome Trust Clinical Research Programme, Blantyre, Malawi.
Funding: PM (the corresponding author) was funded by the Wellcome Trust (grant number: WT089673). RMGJH was funded by the Bill & Melinda Gates Foundation. ELC was funded by a Well-come Trust Senior Research Fellowship in Clinical Science (grant number:
WT091769). The funders had no role in the design or analysis of the study, or in the writing or decision to submit for publication. PM confirms that he had full access to all the data in the study and had final responsibility for the decision to submit for publication.
Competing interests: None declared.
Table 5.
Impact of including rates of pre-treatment loss to follow-up on national tuberculosis programme indicators in hypothetical
programmes in Africa and Asia with 100 000 individuals and DOTS strategy targets (70% case detection, 85% cure) theoretically
achieved, 2011
Indicator Africa Asia
Outcomes reported under current
WHO targets
After including tuberculosis patients
lost to follow-up before treatment
Outcomes reported under current
WHO targets
After including tuberculosis patients
lost to follow-up before treatment
No. of cases 100 000 100 000 100 000 100 000
Cases detected, no. (%) 70 000 (70) 85 366a (85) 70 000 (70) 80 460a (80)
Tuberculosis patients lost to follow-up
before treatment, no. (%) Unknown 15 366 (18) Unknown 10 460 (13)
Cases started on treatment, no. (%) Unknown 70 000 (82)b Unknown 70 000 (87)b
Patients cured, no. (%) 59 500 (85) 59 500 (70)c 59 500 (85) 59 500 (74)c
Deceased tuberculosis patients, no. (%) 4200d (6) 12 498e (12) 2100d (3) 3251e (3)
WHO, World Health Organization.
a Calculated as [1 ÷ (1 − fraction lost to follow-up before treatment)] × number of cases detected. For Africa: [1 ÷ 0.82] × 70 000; for Asia: [1 ÷ 0.87] × 70 000. b Percentage calculated as number of cases initiating tuberculosis treatment divided by the number of cases detected. For Africa: 70 000 ÷ 85 366; for Asia:
70 000 ÷ 80 460.
c Percentage calculated as the number of patients who successfully completed treatment divided by the number of cases detected. For Africa: 59 500 ÷ 85 366; for
Asia: 59 500 ÷ 80 460.
d Number obtained from WHO country database.
e Calculated as the number of deceased tuberculosis patients plus the product of the number of cases lost to follow-up before treatment and the median case fatality
摘要
中低收入国家和高负担国家的肺结核病治疗前失访情况 :系统评价和元分析
目的
评估在治疗开始之前痰涂片或菌培阳性肺结核病
人失访的量级和被追踪病人的结果。
方法
搜索奥维德(
Ovid)、联机医学文献和检索系统
(
Medline)以及全球卫生(
Global Health)数据库,寻
找在
1994年和
2013年
1月之间发表的描述中低收入
国家和肺结核病高负担国家在常规国家结核病规划
(
NTP)中对痰涂片阳性或者菌培阳性肺结核病人治
疗前失访情况的研究。从满足入选标准的研究中,提
取肺结核诊断之后没有开始治疗的患者比例方面的数
据。如果有的话,还调查原因和结果数据(包括在另
一个医疗设施中开始肺结核治疗的情况)。评估异质
性和发表偏倚,执行子群(地区)随机荟萃分析。
结果
确认了
23个符合要求的研究,其中包括
14个
国家(非洲
8个,亚洲
5个,西太平洋
1个)的总计
34706
名痰涂片阳性或者菌培阳性肺结核病人。大多
数研究是回顾性研究,与实验室和治疗登记相关,用
以识别治疗前失访情况。治疗前失访率为
4% 到
38%
不等,常见于非洲(随机加权比例
WP:
18% ;
95% 置
信区间,
CI:
13-
22)和亚洲(
WP:
13% ;
95%
CI:
10-15
)的研究中。
结论
常见于大多数环境中的治疗前失访会妨碍肺结核
控制工作。在报告标准项目指标时,由于没有计算治
疗之前失访的个人数量,
NTP低估了病例发现率和死
亡率,高估了治愈率。
Résumé
Le manque de suivi avant le traitement chez les patients atteints de tuberculose dans les pays à revenu faible et à revenu
moyen inférieur fortement touchés par la maladie: méta-analyse et analyse systématique
Objectif Évaluer l’ampleur du manque de suivi chez les patients atteints d’une tuberculose à frottis positif ou culture positive avant le début du traitement, ainsi que les résultats chez les patients qui ont été suivis. Méthodes Des études publiées entre 1994 et janvier 2013, qui décrivaient le manque de suivi des patients atteints de tuberculose à frottis positif ou à culture positive dans des programmes nationaux courants de lutte contre la tuberculose (NTP) dans les pays à revenu faible et à revenu moyen inférieur fortement touchés par la tuberculose ont été recherchées dans les bases de données Ovid, Medline et Global Health. Des données concernant le taux de patients qui n’ont pas débuté le traitement après leur diagnostic de tuberculose ont été extraites des études satisfaisant les critères d’inclusion. Le cas échéant, les données portant sur les causes et les résultats, y compris le début d’un traitement contre la tuberculose dans un autre établissement, ont été examinées. L’hétérogénéité et le parti pris dans les publications ont été évalués, et des méta-analyses à effets aléatoires par sous-groupe (région) ont été réalisées.
Résultats Vingt-trois études éligibles ont été identifiées pour un total de 34 706 patients atteints de tuberculose à frottis positif ou à culture positive dans 14 pays (8 en Afrique, 5 en Asie et 1 dans le Pacifique occidental). La plupart des études étaient rétrospectives et associaient des registres de laboratoire et de traitement pour identifier le manque de suivi avant le traitement. Celui-ci variait de 4% à 38% et s’est révélé commun dans les études provenant d’Afrique (proportion pondérée à effets aléatoires, PP: 18%; intervalle de confiance à 95%, IC: 13–22) et d’Asie (PP: 13%; IC à 95%: 10–15).
Conclusion Le manque de suivi avant le traitement, commun dans la plupart des contextes, peut entraver les efforts fournis en matière de lutte contre la tuberculose. Comme les individus qui ne sont pas suivis avant le traitement ne sont pas pris en compte lors de l’élaboration des rapports sur les indicateurs de programme standard, les programmes nationaux de lutte contre la tuberculose sous-estiment les taux de dépistage des cas et la mortalité, mais surestiment les taux de guérison.
Резюме
Случаи отсутствия наблюдения до начала лечения больных туберкулезом в странах с низкими
доходами и доходами ниже среднего уровня, а также в странах с высоким бременем туберкулеза:
систематический обзор и мета-анализ
Цель Произвести количественную оценку числа случаев отсутствия наблюдения за мокрото- или культуропозитивными пациентами, страдающими туберкулезом легких, с момента диагностирования заболевания до начала лечения, а также обработать результаты по пациентам, которых удалось отследить. Методы В базах данных Ovid, Medline и Global Health был произведен поиск исследований, проведенных в рамках стандартных национальных программ по борьбе с туберкулезом в странах с низкими доходами и доходами ниже среднего уровня, а также в странах с высоким бременем туберкулеза, опубликованных в период с 1994 года по январь 2013 года, и содержащих описания случаев отсутствия наблюдения до начала
лечения за мокротопозитивными или культуропозитивными пациентами, страдающими туберкулезом легких. Данные по пропорциональному количеству пациентов, которые не начали лечение после диагностирования туберкулеза, были извлечены из исследований, соответствующих критериям включения в данный анализ. По мере возможности, также были исследованы данные по причинам и последствиям, включая прохождение лечения в другом медицинском учреждении. Также была проведена оценка разнородности и систематических ошибок, связанных с предпочтительной публикацией положительных результатов исследований, а также мета-анализ случайных эффектов по подгруппам (регионам).
؛% 13 :ةحجرلما ةبسنلا( ايسآو )22 لىإ 13 نم ،% 95 ةقثلا لصاف
.)15 لىإ 10 نم ،% 95 ةقثلا لصاف
جلاعلا لبق ام ةلحرم في نادقفلا لقرعي نأ نكملما نم
جاتنتسلاا
ةحفاكم دوهج ،تائيبلا مظعم في عيشي يذلاو ،هتعباتم ررقلما
تلادعم ريدقت نم لسلا ةحفاكلم ةينطولا جمابرلا للقتو .لسلا
Bull World Health Organ 2014;92:126–138
|
doi: http://dx.doi.org/10.2471/BLT.13.124800 137 Результаты Было выявлено 23 исследования, соответствующиекритериям включения в данный анализ, которые охватывали в целом 34 706 мокротопозитивных или культуропозитивных пациентов, страдающих туберкулезом легких из 14 стран (8 в Африке, 5 в Азии и 1 в регионе Западной части Тихого океана). Большинство исследований были ретроспективными и включали анализ журналов регистраций результатов лабораторных анализов и прохождения лечения, что позволило выявить случаи непрохождения последующего наблюдения до начала лечения. Показатель непрохождения последующего наблюдения до начала лечения колебался от 4 до 38%, где наиболее высокие значения были отмечены в исследованиях, проводимых в Африке
(взвешенная пропорция случайных эффектов, ВП: 18%; 95% доверительный интервал, ДИ: 13–22) и Азии (ВП: 13%; 95% ДИ: 10–15). Вывод Непрохождение пациентами наблюдения от момента обнаружения заболевания до начала лечения, при схожих значениях остальных параметров, может снижать эффект от принимаемых мер по борьбе с туберкулезом. Неучет лиц, за которыми не велось наблюдение до начала лечения, и их невключение в отчеты со стандартными показателями программы приводит к тому, что национальные программы по борьбе с туберкулезом занижают показатели выявления случаев заболевания и смертности, одновременно завышая оценки показателей эффективности лечения.
Resumen
Pérdida de seguimiento antes del tratamiento de pacientes con tuberculosis en países de ingresos medios y bajos y en países
con carga alta: una revisión sistemática y metanálisis
Objetivo Evaluar la magnitud de la pérdida de seguimiento de los pacientes con tuberculosis que dieron positivo en el análisis o el cultivo antes del inicio del tratamiento y los resultados entre los pacientes que se sometieron a un seguimiento.
Métodos Se realizó una búsqueda en las bases de datos Ovid, Medline y Global Health de estudios publicados entre 1994 y enero de 2013 que describían pérdidas de seguimiento antes del tratamiento en pacientes que dieron positivo en el análisis o el cultivo de tuberculosis en los programas nacionales contra la tuberculosis (PNT) ordinarios en países de ingresos medios y bajos y en países con carga alta de tuberculosis. Se extrajeron datos sobre la proporción de pacientes que no inició un tratamiento después del diagnóstico de la tuberculosis de estudios que cumplían los criterios de inclusión. Siempre que fue posible, se investigaron los datos sobre las causas y resultados, incluida la iniciación del tratamiento de la tuberculosis en otro centro. Se evaluó el sesgo de las publicaciones y la heterogeneidad, y se realizaron metanálisis de efectos aleatorios por subgrupos (región).
Resultados Se identificaron veintitrés estudios que cumplían los criterios, con un total de 34 706 pacientes que dieron positivo en el análisis o cultivo de tuberculosis de 14 países (8 de África, 5 de Asia y 1 del Pacífico occidental). La mayoría de los estudios eran retrospectivos y relacionaban los registros de laboratorio con los registros de tratamiento para identificar la pérdida de seguimiento antes del tratamiento, que osciló entre el 4 y 38 % y fue frecuente en los estudios de África (proporción ponderada de efectos aleatorios, WP: 18 %; intervalo de confianza del 95 %, IC: 13–22) y Asia (WP: 13 %; IC del 95 %: 10–15). Conclusión La pérdida de seguimiento antes del tratamiento, común en la mayoría de los entornos, puede obstaculizar los esfuerzos de control de la tuberculosis. Sin contar los pacientes cuyo seguimiento se pierde antes del tratamiento, los programas nacionales contra la tuberculosis subestiman la mortalidad y las tasas de detección de casos, a la vez que sobrestiman las tasas de curación al informar sobre los indicadores del programa estándar.
References
1. Global tuberculosis control. Geneva: World Health Organization; 2011. 2. The Millennium Development Goals report. New York: United Nations; 2011. 3. Lönnroth K, Castro KG, Chakaya JM, Chauhan LS, Floyd K, Glaziou P et al.
Tuberculosis control and elimination 2010–50: cure, care, and social
development. Lancet 2010;375:1814–29. doi: http://dx.doi.org/10.1016/
S0140-6736(10)60483-7 PMID:20488524
4. Getahun H, Gunneberg C, Granich R, Nunn P. HIV infection-associated
tuberculosis: the epidemiology and the response. Clin Infect Dis 2010;50(Suppl
3):S201–7. doi: http://dx.doi.org/10.1086/651492 PMID:20397949
5. Harries AD, Lawn SD, Getahun H, Zachariah R, Havlir DV. HIV and tuberculosis–
science and implementation to turn the tide and reduce deaths. J Int AIDS Soc
2012;15:17396. doi: http://dx.doi.org/10.7448/IAS.15.2.17396 PMID:22905358 6. Dye C, Bassili A, Bierrenbach AL, Broekmans JF, Chadha VK, Glaziou P
et al. Measuring tuberculosis burden, trends, and the impact of control
programmes. Lancet Infect Dis 2008;8:233–43. doi: http://dx.doi.org/10.1016/
S1473-3099(07)70291-8 PMID:18201929
7. The Stop TB Strategy. Geneva: World Health Organization. Stop TB Partnership; 2006.
8. Harries AD, Rusen ID, Chiang CY, Hinderaker SG, Enarson DA. Registering initial
defaulters and reporting on their treatment outcomes. Int J Tuberc Lung Dis
2009;13:801–3. PMID:19555527
9. Zachariah R, Harries AD, Srinath S, Ram S, Viney K, Singogo E et al. Language in tuberculosis services: can we change to patient-centred terminology
and stop the paradigm of blaming the patients? Int J Tuberc Lung Dis
2012;16:714–7. doi: http://dx.doi.org/10.5588/ijtld.11.0635 PMID:22613683 10. Squire SB, Belaye AK, Kashoti A, Salaniponi FM, Mundy CJ, Theobald S et al. ‘Lost’ smear-positive pulmonary tuberculosis cases: where are they and why
did we lose them? Int J Tuberc Lung Dis 2005;9:25–31. PMID:15675546
11. Dowdy DW, Chaisson RE. The persistence of tuberculosis in the age of DOTS:
reassessing the effect of case detection. Bull World Health Organ 2009;87:296–
304. doi: http://dx.doi.org/10.2471/BLT.08.054510 PMID:19551238 12. Davis JL, Dowdy DW, den Boon S, Walter ND, Katamba A, Cattamanchi
A. Test and treat: a new standard for smear-positive tuberculosis. J
Acquir Immune Defic Syndr 2012;61:e6–8. doi: http://dx.doi.org/10.1097/ QAI.0b013e3182614bc5 PMID:22918128
13. Same-day diagnosis of tuberculosis: policy statement. Geneva: World Health Organization; 2011.
14. Cuevas LE, Yassin MA, Al-Sonboli N, Lawson L, Arbide I, Al-Aghbari N et al. A multi-country non-inferiority cluster randomized trial of frontloaded smear microscopy
for the diagnosis of pulmonary tuberculosis. PLoS Med 2011;8:e1000443. doi:
http://dx.doi.org/10.1371/journal.pmed.1000443 PMID:21765808
15. Storla DG, Yimer S, Bjune GA. A systematic review of delay in the diagnosis
and treatment of tuberculosis. BMC Public Health 2008;8:15. doi: http://dx.doi.
org/10.1186/1471-2458-8-15 PMID:18194573
16. Rosen S, Fox MP. Retention in HIV care between testing and treatment in
sub-Saharan Africa: a systematic review. PLoS Med 2011;8:e1001056. doi:
http://dx.doi.org/10.1371/journal.pmed.1001056 PMID:21811403 17. Govindasamy D, Ford N, Kranzer K. Risk factors, barriers and facilitators for
linkage to antiretroviral therapy care: a systematic review. AIDS 2012;26:2059–
67. doi: http://dx.doi.org/10.1097/QAD.0b013e3283578b9b PMID:22781227
18. Piot MA. A simulation model of case finding and treatment in tuberculosis control
programmes. Geneva: World Health Organization; 1967. (WHO/TB/Technical Information/67.53).
19. Liberati A, Altman DG, Tetzlaff J, Mulrow C, Gøtzsche PC, Ioannidis JPA et al. The PRISMA statement for reporting systematic reviews and meta-analyses of
studies that evaluate healthcare interventions: explanation and elaboration. BMJ
20. The World Bank [Internet]. How we classify countries. Washington: WB; 2011. Available from: http://data.worldbank.org/about/country-classifications [accessed 9 December 2013].
21. Afutu FK, Zachariah R, Hinderaker SG, Ntoah-Boadi H, Obeng EA, Bonsu FA et al. High initial default in patients with smear-positive pulmonary tuberculosis at a
regional hospital in Accra, Ghana. Trans R Soc Trop Med Hyg 2012;106:511–3. doi:
http://dx.doi.org/10.1016/j.trstmh.2012.05.002 PMID:22657536 22. Balasubramanian R, Garg R, Santha T, Gopi PG, Subramani R,
Chandrasekaran V et al. Gender disparities in tuberculosis: report from a
rural DOTS programme in