Invited Paper
Molecular
tilt angle and order parameter oflow molar mass ferroelectric
liquid crystal using JR spectroscopy
T. S. Perova, A. Kocot, and J. K. Vij
Trinity College, Univesity ofDublin, Department of Electronics and Electrical Engineering , Dublin2, Ireland
R. Zentel
Universitat Mainz, Institute fur Organische Chemie ,Germany
ABSTRACT
Fourier transform infrared spectroscopy (ETIR) of a ferroelectric liquid-ciystalline material: 4-(3)-(S>methy1-2..(S) chloropentanoyloxy-4'-octyloxy-biphenyl has been investigated in the wavenumber range 450-4000
cm
for various temperatures and as a function of direct bias voltage in its SmC* phase. Samples prepared in both homeotropic and homogeneous alignments have been studied. The order parameter was calculated for several isolated JR vibrations which are characteristic of different parts and orientations ofmolecules. The dependence ofthe molecular tilt angle on direct bias voltage and temperature has similar characteristics to those Obtained from electro-optic measurements.1. INTRODUCTION
Ferroelectric liquid cirstals (FLC) have attracted considerable attention due to their wide range of applications in electro-optical devices . Variousmethods have been used for investigating the switching mechanisms in ferroelectric liquid ciystal cell. However, the molecular mechanism responsible for this switching is not yet fully understood. Infrared spectroscopy is ideally suited for these investigations since information about different parts ofthe molecule can be revealed through studies ofthe intensity and frequency ofthe various vibrational bands. Zgonik Ct aL2 examined the orientational order in smectic phases of a ferroelectric liquid-crystalline material (abbreviated as 1O.S.ClIsoleu) by IR absorption spectroscopy. Their results showed that the molecular tilt ofthe core changes only slightly in going from the SmA to the SmC*. This has been interpreted in terms of cores that have already been tilted in the SmA phase. The reonentations of a PLC under applied electric field have also been studied. Kocot et aL used IR spectroscopy for the first time for determining the molecular tilt angle of a FLC material. The molecular tilt angle was defined as the angle between the transition dipole moment of the vibrational bands belonging to the central part of the molecule and the rubbing direction.
In this paper, we report results of investigations into of the second rank orientations] order parameter and of the
molecular tilt angle as a function of the applied direct bias voltage in SmA and SmC* for a ferroelectric low
molar mass LC: 443}(S)methyl-2(S)-chloropentanoyloxy4'octyloxy-biphenyl (designed as ZT) using JR
spectroscopy. The results are compared with those obtained by using polarizing microscopy.2. EXPERIMENTAL
The chemical constituent of ZT and the transition temperatures are given in Fig. 1. Samples were oriented both in the homeotropic and the homogeneous configurations between a set of two Si and also two ZnSe windows. The alignment achieved on ZnSe windows was confirmed using polarizing microscopy. The purpose of experiments on a homeotropic aligned sample is to determine the correct asignment of the vibrational band and the phase transition behaviour.
A homeotropically aligned samples of approximate thickness 12 m were prepared between two ZnSe windows. Both ZnSe windows were spin coated with 1% solution of ZLI 3334 Merck compound disolved in methanol. Samples with
CH (CH7
O
—CH C2H5
CI
Cl-I3
Fig. 1. Structure of ZT liquid crystal
homogeneous orientation were prepared between the optically polished silicon windows. These were spin coated by nylon 6/6 (0.2 percent solution in methanol) to obtain a uniform layer about 0.2 jun thickness. Both Si windows were rubbed subsequently in antiparallel directions. Mylar foils of 6 &m were used as spacers for homogeneously oriented sample. Distances between the windows were checked through interference fringe measurements. The cells were filled at a temperature above the clearing point due to the capillary effect. Since it was not possible to check whether the alignment of the sample between a set of two silicon windows using polarizing microscopy was trudy homogeneous, a similar sample was prepared between two glass piates in the manner analogues to that just described. The alignment determined by means of polarising microscopy was found to be homogeneous and it was reasonable to assume that the alignment was similariy homogeneous between a set oftwo Si windows.
The accuracy and the set point stability in temperatures were 0.5°C and 0.1°C, respectively. The infrared spectra were recorded using a Digilab FTS 60A spectrometer, with 0.5 cm" resolution. An IR-KRS5 polarizer was used to polarize the IR beam.
3.
RESULTS
AND DISCUSSION
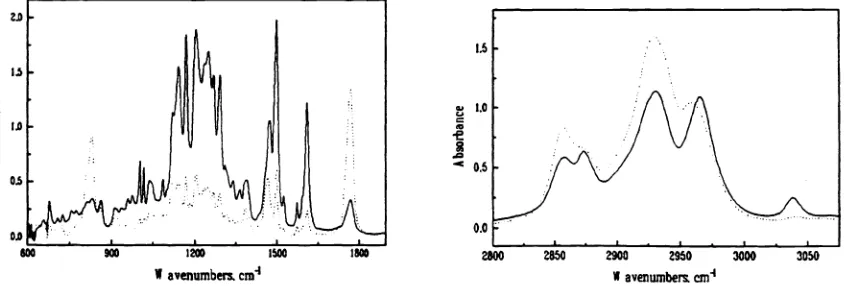
[image:2.604.71.493.515.658.2]The polarized IR spectra of a chiral SmC* phase of homogeneously aligned samples of ZT are shown in Fig. 2. The absorption bands are assigned to the characteristic vibrational modes taking into account the direction of the vibrational transition dipole moments. For the purpose of this paper, we considered a few chosen vibration bands: C=O stretch vibrations v =1767 cm4 and two C-C benzene ring vibrations (v=1497 and v1608 cnft).
Fig. 2. Polarized ETIR spectrum of the homogeneously aligned ZT liquid crystal at T323K. Solid line, 0°; dotted line 90°.
108/SPIEVol. 2731
E E
3X 310
) 3
Tenpature(K)
Fig. 4. The same as in Fig.3. for benzene ring CC stretching vibration.
Figures 3-5 also show that both types of molecular orientations show similar characteristics in terms of both the peak
intensity and the frequency maximum of the IR bands. For the C=O stretching vibrations, we observe a more
complicated contour of the band than that for an isolated C-C benzene stretching vibrations (at 1608 cm1) and CH aromatic out of plane vibration at 830 cm4 (see Fig. 6). Since these groups play an important role in the switching process, a detailed analysis of the C=O band should be carried out. This band has been deconvoluted into its costituent vibrations.
SPIE Vol. 2731 / 109
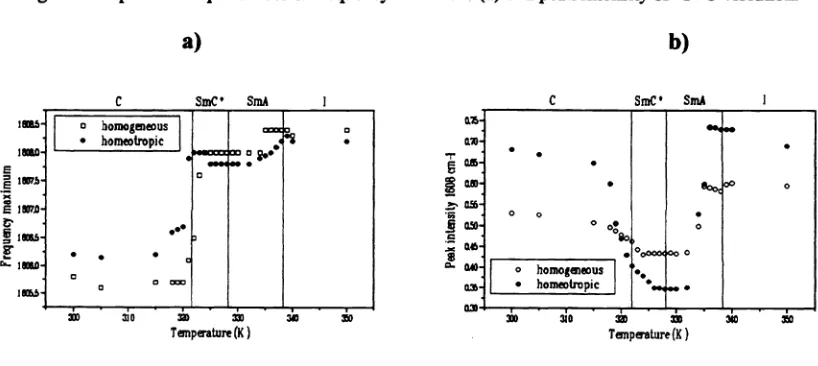
3.1. IR spectra for different phase
FTIR spectra were recorded for homogeneous and homeotropic aligned samples in the temperature range of 300350 K. The temperature dependence ofthe peak intensity and the frequency maximum of several bands are shown in Figures 3.. 5. The intensity and the peak position change significantly for the mesogen groups [benzene, biphenyl (1608, 1497,
1202, 830 cm), and ester (1767 cm) and slightly for alkyl groups (2960, 2932, 1460 cm etc) at the occurence of
the phase transition from crystalline to SmC* phase. This is interpreted in terms of a significant conformational change for the entire FLC molecule. Veiy minor changes in the spectra during SmC* to SmA phase transition were observed.
However, a noticeable difference in the peak intensity and the peak position is observed during the SmA4 pbae transition temperature. Figures 3-5 show that noticeable reorientations of the molecules start occuring at the
temperature a few degrees above ISmA phase transition and these stop at the temperature a few degrees below this transition temperature.
a)
b)
C SrnC' SmA
o homogeoua
• bomtropic
•
•.
o °
-r
[image:3.605.97.506.401.584.2]0.
Fig. 3. Temperature dependences of frequency maximum (a) and peak intensity of C=O vibration.
a)
b)
C SmC' SmA I
ieoai 10*0
E
1eT
Ie*0 r..ieoto
C SmC' SmA
I ° homogeous • horneotropic
00
. . !
am 310
3
333Tenpature(K)
$
0.
z
.
33
•
0$ S
0333 5 eoco 0
ath
0
0
OAO
a33
033
°
J o
L
°
homogus
homeotropic
•0000c
•• •IM
)0o
S
:
'
100 310
1
Teiopeature(K
1
31012
1.1
0.7
[image:4.599.65.472.80.266.2]0$
Fig. 5.Thesame as in Fig3 for C-H aromatic out of plane vibration.
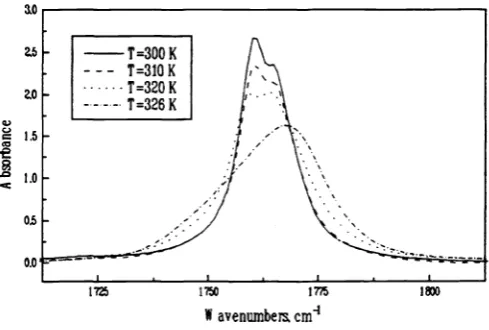
The analysis of the C=O stretching vibration suggests the existence of three possible conformations for the ester groups of the FLC molecule; the relative populations of which may vary significantly as a function of temperature (see Figs. 7 a and 7 b). One of the conformers exists primarily in the crystalline state, the other one exists primarily in the SmA and the isotropic phase. The relative populations of these two conformers are approximately equal in the SmC* phase. One
of
V
=
(C
-E a
Fig. 6. FTIR spectrum of homogeneously aligned ZT LC at different temperatures.
the constituent bands exists only in crystalline phase and changes dramatically during the phase transition from the
crystalline to the SmC* phase. This band completely disappeares at the temperature of 325K. These observed conformations correspond to different angles of the C=O bond with respect to the benzene ring. Kardan et al.4 have shown through the calculations that C=O stretching vibrational frequency varies when this angle changes. Hence for the SmC* phase we must consider that C=O band consists of 2 bands with frequency maxima at -4770 cm and -4758 cm'. Moreover from the dependence of the frequency maximum on temperature we see that the orientation of one of
these two conformational bands (1770 cm1) is quite stable when the temperature changes while the frequency
maximum of the other decreases when the temperature increases. This means that for the FLC molecules studied here, there is a preferable orientation for the C=O bond with respect to the mesogenic group. Possibly this gives rise to an
110ISP!E Vol. 2731
a)
SmC' SmA
b)
C SmC' SrnA
300
I
0
•I.
a a all.
C homogeous 003 [ • homeotropic
•
.
a000
o homogieous
homeotropic
31 310 331
TelipeatuTe(K)
310 310 310 300 3i0 320 330 340 350
Tonpature(X)
00Ix
[image:4.599.159.404.370.535.2]interesting, behaviour of this molecule with resiect to other carbonyl group containing LC molecules (see, for
example5 ). mis interestingbehaviour has also been observed during the measurements of dichroism on applied electric field (see the next section and our paper to be published later).
a)
b)
C I C SmC'SmA J
24
S
•
I I
17,
I •
1.11I
:
18 __________
:16 0 1
W*
I ]77
.J4
o
0 1 1765.,2
0 j75$•770
°8
1*:
.
C— :
I I
a 1758'-
3D C2 C a
0 ! •r—•'--- • ! . . .
310 ze 340 3%; 3O 330 3C
Temperature(K) Tnperathre(X)
Fig. 7. The dependences of parameters of deconvolution (intensity (a) and frequency maximum (b)) of CCO band on different temperatures..
3.2. IR Dichroism Measurements
In this section we present the results of IR measurements for a homogeneously aligned sample for parallel and
perpendicular polarisation with reference to the rubbing direction. These measurements allow us to evaluate the order parameter of the FLC system.
The second rank orientational order parameter S2
s2
=.(3cos2J3_1)
canbe expressed in terms of the dichroism ratio, R3:
R
——(1 +
2S2)
(1—S2)
(5)if
transition dipole moment is directed along the long molecular axis, i.e. a= 0 andR =
2(1—S2)
(2+S2)
(6)if
(X =900,where the dichroism ratio R is defined as
R_Jth1
—JA±dv
(7)LELZ !0A3IdS/ZLL •2E2joA sEiq PO1!P P!!ddE pilE a[n2JduIo3 Jo SUø!2OUflJ
s
oj2u
iji
iniou
pu
suow.iqt
SflOUA .iojioui.ied
.ip.iooq
jo
pnjs
uosaid 3M 'MON •uq3uMs °!.'1°P 31j2 UUflP S3jflOOjOW JO SUOT1E1U.IO-3142
JO 2UIMIE1S1pUflIfl
1OJ 3UEUOdWT!P
°fl
SSO1E ppUs!q
P!IddE oIfl UOspuq
juoiqit
ouios iojo
wsionpp
>rj Jooupuocbp
uosrpns
uij
ppIJ 3u33a13"
Jo3JJ
•r€: A OZ JO 22jOA se!qw
ifliAtoznidui
uoiumied
.ipio
jo
oupucbp
qi
in
popjpi
uoq
osj
seqinoimpq
2upsoiiui S!U1 1UUIU2!ffiuq
qi
stwo
pu
jqis
.IOwAff32iU
sisqd
uqjsAio
p
rnsjuow
puio
ipns JOousoid
Ajqssojmvduii
siip wpox
piedessp
suouuojuoo
oiqi
qi
jo
uo
o
upuods.ioo
puq
piii:j 3112 'UOtOOSsnoid
oqi mutoqs
sy
sdnoi2is
qjo
suoiwuuo
'p
tptt
popuuoo
q
pjno
jnsi
ui,j
•ES
1E
'seqd
'J3AMOq snpswos
o
q
MOUpu
2ups.iui
flSJ
IIE
11 ifiM oqp2IS3AUI
UI JO1EJip
2Eows
-'qI
Si ouugu2s
umio
ul
.rp.ioiuiid
2uunpqi
sid
UOtI!sue4 WOiJ OIfl uffl!1sAc1oo
oqiSjflOOW
ssuI
y1
IEjOW MOj JOJ UMOtjS
uq
Ap13OJjsq
sy
(doosoioiuiuisiijod
pim woijpoqsqso
s
j
ue.i
çz-
uij
osmjd uoiistmri 1n1adw3:I WO1JIfl
IwIsAcJ,o
cuis
smjd
JOJS2
IB!iWW SToiniduio
tn
UI
OAISO
SI OIAEIOq SU1 1TflVdUIO UOSUBII*D"SO
NZ
JflOA3
upSiui
jOMSO .p1p1Ornb
sijuow
yj
sip
.iojuqo
i''u
ioqs
isj
mp
pnuoo
ou!s
otpnj
jo
.ipio
iumied
ioj
r'u
H3
2unpis
opiq
JflOiAEIq S3jUI 2! qissoc!O
'poipiosp
SIUI
!A3L1 Cduiiou
ABUI J33UIBmdipjo
jo
nt
sq
13AMOH .iojuuq
1MO! SW!2c
o
unuq
2uu'o.iqt
oij
.ipio
Jumied
SI 2EIjMUIOSss
ioj
qi
iAue dnoi2ip.io
JWB1Ed SMio
u.idui
oui
wnwpuz
njet
jo
qi
.ipio
iouiid
sq
uq
punojoj
'r
o=
P"
'fl
H-D mojo
uejd
•spuEquO!1!SuEfl
siqd
3!d0120S1lfl
O 3SOj OJfl1EJ3dUI1qi
e
seiop
cIiqssqix
pimuosu.n
siqd
vms
32
-3m5
w
utp
iousop
'osEqd)W5
01U!IISI1)
OLfl iuolJ AjMOjSssip
p1dsItu!
u3q
Aj
1E1spuq
ioj
iumrd
.ipio
qi
g 2!dwog
us
s
s
spuEquoiqpt
zq
.iojSSU)1
uril9
JOtdurs
.ioj 1oun1Ed 13p101JO
3oupu3cbp 1tUE1dUI1tfl
SMO1jS 8Jn2Ij
Sjfl3OWJO UOflE1UUOAflEjI
pu
simduaiip
.rpio
marid
s
uoq
pwjno
IOJj1oss
138UOi1S pimpos
jj
suo1E1qPtsqj
iu
osioieip
jo
qj
iduies
pu2p
Ajsnoou2owoq Joiriiduii
ifl
uo 1uJE.IEd ip.iOqijo
upu3d3p
s
2i
gcc 0CCC
0Coro
I
L6tI—°--— QO9—o—— OO 99L1—v— '.O OCO 0000000000000000000000 a vvvvvvvvvvvvvvvvvvvvv 000000 oco
iuuiow
uopsim
juoiiqiA
OqIJO UOOO1!Pqi
puesix
six
Si2uoj
io3
Jojnojow
pucq1
do
'spc
pue Sij2ue
uottq
q1
iniow
puc TV sooucqiosqjiid
puc JIjnopudJod 01q1
1opp
(ptnodsi
OIOHJ
Sioq
oju
uoMq
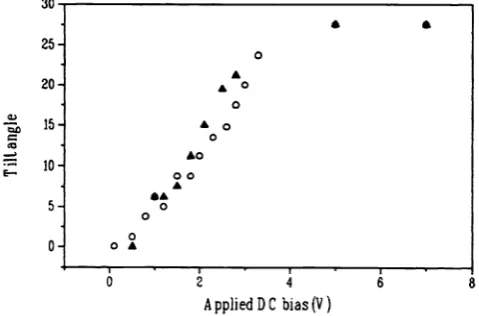
oqIThe molecular tilt angleobtainedfrom the JR spectra for the benzene ring stretching vibrations (1608 cm') and from electro- optical measurements by using polarizing microscopy is shown in Fig. 9. We find a close agreement between
the molecular and optical tilt angles in temperature range 320 238 K. As is seen from Fig. 9 the dependence of molecular tilt angle on temperature is almost independent of the direct bias voltage in the range 52O V. This is confirmed by the results of the dependence of the tilt angle on direct bias voltage (Fig. 10) for v=1608 cm1. The
results imply that the helix is unwound at a threshold voltage of less than 2 V and tilt angle does not change with a direct bias voltage greater than 5 V.
::
++ + V
20
0 a
15
+
10
5.
0 +
I I I I
320 322 324 326 328
[image:7.603.185.437.205.374.2]Temperature(K)
Fig. 9. The dependence of tilt angle on temperature for electro-optic measurements (+) and JR (v1608 cnf') measurements at different applied voltage (o 5 V; -15
V; 0 20 V).
The order parameter of the smectic C phase is found to be independent of direct bias voltage in the range 5.15 V as seen from Fig. 10.
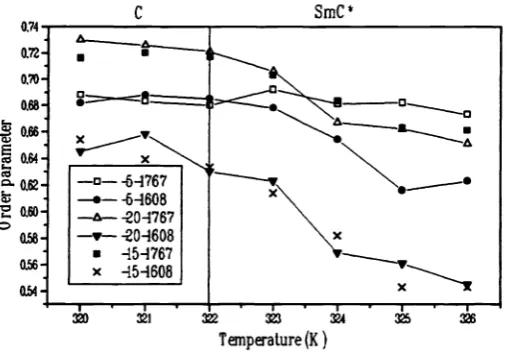
The dependence of the order parameter on temperature (in region 320-325 K) for various applied direct bias voltage is shown in Figs. 11. We can see from this Figure that the peculiarity at around 324.5 K still exist
4 4
25
0
20
0
-
15 £ 00 CD
£0
1
20
.
AppliedDC bias(V)
Fig. 10. The dependence of the tilt angle on DC bias for JR (o) and electro-optic measurements.
[image:7.603.193.433.502.660.2]Fig. 12 shows the plot of the order parameter vs direct bias voltage for T=323 K. The order parameter is found to increase significantly (quite noticeable for 1608 cm) when the helix is unwound by the bias voltage and then does not change very much for voltages greater than 5V.We conclude that the bookshe1f layer structure is formed in the cell for applied bias voltage more than 5
V
(see our paper9). [image:8.599.160.415.173.349.2]SmC
Fig. 11. The dependence of order parameter for different IR bands on temperatures at different applied voltage.
0.72
070.
0.68
.
060.64
.
0.62
0.60
Ô 15 2'O
[image:8.599.161.419.405.561.2]Applied DC bias(V)
Fig. 12. Order parameter on applied DC bias for two different JR bands.
4. CONCLUSIONS
An interesting results has been found for a FLC material 4.(3)-(S)-methyl-2.(S)-chloropentanoyloxy-4'.octyloxybiphenyl (ZT). The molecular structure given in Fig. 1 shows that one of the ends of this molecule has a short alkyl chain and two chiral carbon atoms. Such a structure produces molecular packing which does not allow the alkyl chain rotate
114/SPIEVo!.2731
C
Temperathre (K)
000
T=3iK0
0 0
o 1767
• 1608
•
••
•
•
•
freely. These rigid ailcyl chainstructures cause a higher orientation of the carbonyl and CH3 groups with respect to mesogemc group.
5.
REFERENCES
1. L.M. Blinov, Electrooptical and magnetooptical Properties ofLiquid Crystals, Wiley Interscience, New York, 1983.
2. M. Zgonic, M. Rey-I4on, C. Destrade, C. Leon and H.T. Nguyen, "Microscopic ordering in smectioc phases ofliquid crystals", J.Phys.France, 51, 2O152O22 (1990).
3. A. Kocot, G. Kruk, R. Wzralik and J.K. Vij, "Study of the molecular tilt angle and the order parameter of a ferroelectric liquid crystals mixture using JR spectroscopy", Liquid Crystals, 12, 1005.1012 (1992).
4. M. Kardan, B.B. Reinhold, S.L. Hsu, R Thakur and C.P. Lilya, "Spectroscopic characterization of the
Microstructures in Diskilke Liquid crystalline Molecules: Model Compound for Polymers", Macromolecules, 19, 616 620 (1986).
5. K.H. Kim, K. Ishikawa, H. Takezoe and A. FUkUdO, "Orientation of alkyl chains and hindered rotation of
carbonyl groups in the smectic .C p1 of antiferroelectric liquid crystals Studied by polarized Fourier transform
infrared spectroscopy", Phys.Rev.E, 51, 2166-2175 (1995).
6. A. Yasuda, K. Nito and E. Matsui, "Time-resolved FT-IR study of ferroelectric liquid ciystals with SiO
obliquely evaporated alignment layers", Liquid Crystals, 14,1725-1734(1993).
7. N.A. Clark, F. Hide, K. Nito, A. Yasudo and D.M. Walba, "Polarized infrared spectroscopy of molecular orientation and electric field-induced reorientation Dynamics in chiral smectic liquid crystals". Abstracts of the Fourth International Conference on Ferroelectric Liquid Crystals, Japan, 1993, p.385-386.
8. T.S. Perova and J.K Vij, "A unique alkyl chain behaviour in low molar mass ferroelectric liquid crystal studied by infrared dichroism" (to be submitted).
9. T.S. Perova, Yu. P. Panarin, J.K. Vij, "Infrared Dichroism for study of the Molecular Orientation in a Chiral Smectic liquid crystal Mixture", Ferroekctrics, 1996 (to be published).
+
Permanentaddress: Vavilov State Optical Institute, St.-Petersburg, Russia.