Neural Network Combination by Fuzzy Integral
for Robust Change Detection in Remotely
Sensed Imagery
Hassiba Nemmour
Signal Processing Laboratory, Faculty of Electronic and Computer Sciences, University of Sciences and Technology Houari Boumediene , 16111 Algiers, Algeria
Email:[email protected]
Youcef Chibani
Signal Processing Laboratory, Faculty of Electronic and Computer Sciences, University of Sciences and Technology Houari Boumediene , 16111 Algiers, Algeria
Email:[email protected]
Received 31 December 2003; Revised 5 December 2004
Combining multiple neural networks has been used to improve the decision accuracy in many application fields including pattern recognition and classification. In this paper, we investigate the potential of this approach for land cover change detection. In a first step, we perform many experiments in order to find the optimal individual networks in terms of architecture and training rule. In the second step, different neural network change detectors are combined using a method based on the notion of fuzzy integral. This method combines objective evidences in the form of network outputs, with subjective measures of their performances. Various forms of the fuzzy integral, which are, namely, Choquet integral, Sugeno integral, and two extensions of Sugeno integral with ordered weighted averaging operators, are implemented. Experimental analysis using error matrices and Kappa analysis showed that the fuzzy integral outperforms individual networks and constitutes an appropriate strategy to increase the accuracy of change detection.
Keywords and phrases:remote sensing, change detection, neural network, fuzzy integral.
1. INTRODUCTION
Analysis of multitemporal images of remote sensing is used for multiple purposes like environment monitoring and wide-area surveillance. These applications involve the iden-tification of changes in land cover and land use practices. Hence, even, a pair of spatially registered images acquired on the same ground area at different times is analyzed to identify areas that have changed. Commonly, the compari-son of independently produced classifications of data is used since it provides complete knowledge upon the change [1]. However, there are major problems associated with this tech-nique. On one hand, its accuracy is critically dependent upon the two individual classifications. On the other hand, it does not allow the detection of subtle changes within a land cover class [2]. Recently, an alternative approach based on simul-taneous classification of multitemporal data begins to be used to overcome these drawbacks and allow an automatic extraction of different kinds of change [3,4]. To develop such a change detector, one can adopt statistical classifiers that are widely used in remote sensing such as the
Multispectral images of two dates
Input layer
Hidden layers
Output layer
Change map
. . .
. . .
. . . ... .
. .
. ..
. ..
Figure1: Neural network architecture for change detection.
integral has enjoyed a strong success in several applications of land cover classification, handwritten recognition, and im-age sequence analysis [8,9,10,11,12]. This method com-bines objective evidences in the form of network outputs ac-cording to expectations about their relevance. These expecta-tions are estimated by using a fuzzy measure. In a first time, the experimental design includes architectural and training rule selection. Next, we carry out the combination of three neural networks using various forms of the fuzzy integral. Specifically, we use Sugeno integral, Choquet integral, and the extended Sugeno integral by two families of ordered weighted averaging operators (OWA-OR and OWA-AND). The rest of this paper is arranged as follows. Section 2 re-views the neural network change detector as well as its traing rules. It presents also the combination via the fuzzy in-tegral.Section 3summarises experimental results including architectural and training algorithm selection for neural net-works and the performance comparison evaluation of com-bination rules. Finally,Section 4discusses and gives the main conclusions of the paper.
2. COMBINATION OF NEURAL-NETWORK-BASED
CHANGE DETECTORS
2.1. Neural-network-based change detector
There are two approaches for change detection [2]. The first approach uses comparative analysis of independently pro-duced classifications of data, in which pixel labels of two in-dividual classifications are compared to detect changes. This approach gives complete information over the land cover change but errors in the two classifications appear in the final change map as missed or spurious changes. The sec-ond approach is based on simultaneous classification of mul-titemporal data. It overcomes some limitations of the first approach since the data are handled by the same classifier. Hence, land cover change classes are selected at the classi-fier input. For instance, if we are interested to assess changes from no urban to urban, we select pixels which were not in the urban class at t1 and are in this class att2. Similarly, if we want to extract a no-change class such as urban areas, we select pixels that belong to this class in both dates.
In this paper, we adopt the simultaneous analysis ap-proach using artificial neural network classifiers. Recall that an artificial neural network is considered as a mapping de-vice between an input set and an output set. Inside it is constructed from some processing units interconnected by weighted channels according to some architecture [5]. Thus, the neural network change detector has the following struc-ture.
(i) Network input: it receives input data extracted from two or more multitemporal images of the study area. Spectral channels of these images are spatially aligned and concatenated to form the input vector.
(ii) Network output:the network output can be encoded by several ways. In our case, we use one output node per land cover category which is either change or no-change class.
(iii) Network architecture:the number of hidden layers and their size are determined by the user. In general, for complex classification, like change detection, a net-work with two hidden layers achieves the best result in terms of the square error at convergence and the gen-eralization ability [6].
For instance, Figure 1 shows the architecture of a two-hidden-layer network for change detection. Recall that super-vised learning of this network aims to minimize the cost for all possible examples through the input-output relation by modifying iteratively synaptic weights (i.e., minimizing the mean squared errorEbetween actual and desired outputs of the network which are, respectively,YandYd):
E=
M
j=1
Yj−Ydj
2
, (1)
M is the number of the training patterns. Thereby, synaptic weights are updated at the iteration (t+ 1) by
w(t+ 1)=w(t) +∆w(t+ 1), (2)
compued for the backpropagation algorithm by
∆w(t+ 1)= −η∂E
∂w+α∆w(t), (3)
ηis the step size andαis the momentum. However, the main problem of the backpropagation is that many iterations are required to train a small network. Hence, an alternative algo-rithm based on the Kalman filtering has been proposed for accelering the training stage of the neural network. For this training rule, the weight change is computed by means of the following equation:
∆w(t+ 1)=kieiµi, (4)
eiis the error signal of the layericomputed at each node,µi
is the step size, andkiis the Kalman gain (more details about
this training rule are given in [13]).
2.2. Fuzzy measures and fuzzy integrals
In this section, we give the basic notions of the fuzzy measure and fuzzy integral.
(A) Fuzzy measure
LetZbe a finite set of elements, a set functiong: 2Z→[0, 1]
is called fuzzy measure if [7,8,9] (i) g(φ)=0,g(Z)=1, (ii) g(A)≤g(B) ifA⊂B.
The fuzzy measure does not follow the addition rule, that is, ifA,B⊂Z, thenA∩B=φ:
g(A∪B)=g(A) +g(B). (5)
However, while combining multiple sources, one must set the fuzzy measure of groups of sources. Therefore, Sugeno pro-posed thegλfuzzy measure so that
g(A∪B)=g(A) +g(B) +λg(A)g(B). (6)
(B)gλfuzzy measure
The so-calledgλfuzzy measure satisfies the following
prop-erty [7,8]: letZ = {z1,. . .,zn}be the set of available change
detectors. For each change detector zi to be combined, we
associate a fuzzy measuregk(zi) indicating its performance
in the class k. For a given pixel, let hk(zi) be the objective
evidence of the change detector zi for the class k. The set
of change detectors is then rearranged such that the follow-ing relation holds: hk(z1)≥ · · · ≥ hk(zn) ≥ 0. We obtain
an ascending sequence of change detectorsAi= {z1,. . .,zi},
whose fuzzy measures are constructed as
gk
A1=gk
z1, gk Ai =gk
Ai−1∪zi
=gk
Ai−1
+gk
zi
+λgk
Ai−1 gk zi . (7)
For each class k,λ is determined by solving ann-1 degree equation:
λ+ 1=
n
i=1
1 +λgk
zi
. (8)
Notice thatλ∈]−1,. . ., +∞[ withλ=0. It is important to stress that (7) allows us to construct the fuzzy measures in or-der to provide both the weight of a single change detector as well as the weight of a subset of change detectors. However, there is no rule which would be followed to attributegk
val-ues. In fact, they can be subjectively assigned by an expert, or computed from the training data [8]. In this paper,gkis
ex-pressed by the fuzzy accuracy per land cover class computed using a validation set.
(C) Sugeno integral
Sugeno integralIS, of a functionh:Z →[0, 1] with respect
to a fuzzy measuregoverZ, is computed by
IS(k)=Maxni=1
Minhk
zi
,gk
Ai
. (9)
This integral has been extended by using two special fami-lies of ordered weighted averaging operatorsOWAwhich are OWA-ANDandOWA-ORoperators [9].
(D) S-OWA-AND integral
With theOWA-ANDoperator, the objective evidenceshk(zi)
are transformed according to
˜ hk
zl
= 1−α l+ 1
l
i=1 hk
zi
+αMinzl∈Z
hk zl . (10)
The new evidences are then utilized in (9) to compute the new form of Sugeno integral termedIAND.
(E) S-OWA-OR integral
The OWA-ORperforms on the values of the fuzzy integral computed for each class before evaluating the final aggre-gated decision:
IOR(k)=1−β 2n
k⊂E
IS(k) +βMaxk⊂E
IS(k)
. (11)
Note thatEis the set of classes. Parametersαandβlie in the unit interval, and could provide somewhat different results when extending the fuzzy integral byOWAoperators [9]. (F) Discrete Choquet integral
The discrete Choquet integral of a functionh:Z→R+with respect togis defined as [10]
IC(k)= n
i=1
hk
zi
−hk
zi−1 gk Ai , (12)
where indices ihave been permuted so that 0 ≤ hk(z1) ≤
Network 1 Network 2 Networkn
Combiner Change map
t1
t2 ..
. . ..
Figure2: Neural network combination for change detection.
BEGIN
For each classk
Calculateλ; /∗using the importance of each network∗/
End For.
For each classkdo
For each neural networkzido
Computehk(zi);
Computegk(zi) usingλ
End For.
/∗Compute the fuzzy integral for the classk∗/
If (Choquet integral), then ComputeIC(k);
Else
If (Sugeno integral), then ComputeIS(k);
Else
If (S-OWA-AND integral), then Compute ˜h(zi), Compute
IAND(k);
Else
ComputeIS(k), ComputeIOR(k);
End For.
Assign the pixel to the class corresponding to the maximal integral. END.
Algorithm1: Algorithmic implementation.
2.3. Algorithmic implementation
The basic idea of multiple neural networks is to develop n independently trained networks with relevant features, and combine their outputs to produce an average consensus de-cision [9] as shown inFigure 2. The fuzzy integral seeks the maximum grade of agreement between objective evidences hk(zi) according to their performances represented by the
fuzzy measures gk(zi). In Algorithm 1, we adapt the
pseu-docode of combination given in [8] to the work presented here. We define the performance of a neural networkziin
the classkby
gk
zi
= Rk
Rk+Rc+Ro+Rr, (13)
whereRk denotes recognition rate,Rc commission rate,Ro
omission rate, andRrreject rate.
3. EXPERIMENTAL RESULTS 3.1. Description of the study area
and evaluation criteria
The study area is located to the east of Algiers, Algeria. It is a coastal region which comprises theIsserRiver and water-shed as well as several land cover types which are grouped as follows.
(i) Water bodies:portion of Mediterranean sea,Isserriver, lakes, and theIsserreservoir.
(ii) Vegetation:areas covered by all kinds of vegetation and mixed forest.
(iii) Constructions: areas covered by both dense and less dense settlements as well as single buildings.
(iv) Soil:all kinds of bare soil.
(a) (b)
Figure3: SPOT images of the eastern part of Algiers: (a)XS1band of the image acquired in 1989, (b)XS1band of the image acquired in
1991.
Table1: Classes of interest.
Class labels Class attribute (1989⇒1991) Training Test Validation
1 Water⇒water 400 750 100
2 Vegetation⇒vegetation 400 860 100
3 Construction⇒construction 400 1020 100
4 Soil⇒soil 400 950 100
5 Vegetation⇒soil 400 780 100
6 Construction⇒soil 400 660 100
7 Water⇒soil 400 530 100
8 X⇒clouds 400 420 100
Since the selection of the training data is crucial to the quality of the result, we used reference maps obtained from unsupervised classifications of available images. Unfortu-nately, these maps constitute the unique source of ground truth which can be used to select training data. In order to validate the results, the dataset for each land cover class was randomly split into three disjoint sets in order to be used, respectively, in the training stage, in the test stage, and for calculating fuzzy measures (Table 1). These data are linearly scaled between 0 and 1 by dividing radiometric values by 255. Change detection performance is evaluated by using the usual error (or confusion) matrix which highlights the good class allocations or accuracy rates per land cover class. In ad-dition, many accuracy measures can be derived from this ma-trix. We use then the overall recognition rate (ORR), which is computed by taking the ratio between the sum of the good allocations and the total number of test data, and the Kappa coefficient computed by the Khat. This latter is computed by using all elements of the error matrix. The more theKhatis closed to 1 (100%), the more the change detector is reliable [14].
3.2. Architectural and training rule selection
This experiment is conducted to seek the optimal neural net-work change detector in terms of architecture and training
90 80 70 60 50 40 30 20 10 0
Number of iterations 0
0.2 0.4 0.6 0.8 1
MSE
BP KF
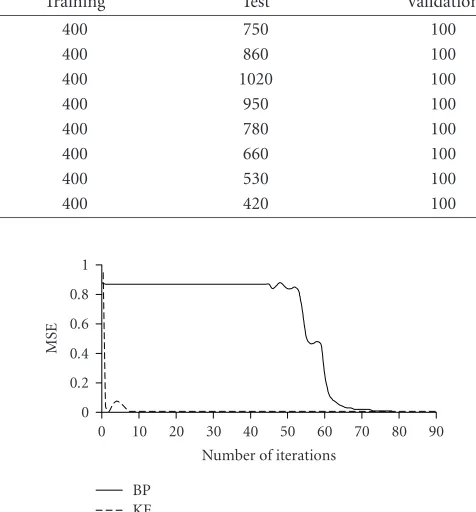
Figure4: Mean squared error versus the number of iterations.
rule. First, the backpropagation (BP) and Kalman filtering (KF) algorithms were used to train the same network in order to compare their performances. Both algorithms were started from the same initial weights with random values ranging from−0.01 through +0.01 while setup parameters were se-lected to maximize the performance of each algorithm.
500 400 300 200 100 0
Number of iterations 0
20 40 60 80 100
Khat
(%)
BP KF
Figure5: Khat according to the number of iterations.
0.04 0.03
0.02 0.01
0
FP ratio 0
0.2 0.4 0.6 0.8 1
TP
ra
tio
BP KF
Figure6: ROC curves.
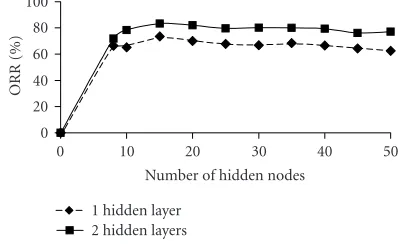
is confirmed by the second test which calculates the Khat for various iterations. The result is depicted inFigure 5. We notice that KF rule reaches its maximal value ofKhat after few iterations. In return, theKhat of the BP increases grad-ually across the time. In order to evaluate the ability to de-tect changes, we plot the ROC curves for both algorithms. These curves are formed by points whose coordinates are the false positive (FP) ratio (which expresses the amount of false alarms represented on thex-axis) and the true positive (TP) ratio (which expresses the amount of good detections represented on the y-axis). The change detection process is considered more effective if the area under the ROC curve and above the main diagonal is big.Figure 6presents the ob-tained curves which show that KF algorithm is more accurate in terms of change detection. On the other hand, we per-form another test to find the optimal architecture for change detection. Using the KF algorithm, we trained many neural networks comprising one and two hidden layers in which the number of nodes varies between 8 through 50. The result re-ported inFigure 7indicates that in all cases the network with two hidden layers outperforms the one-hidden-layer net. Moreover, for both architectures, the increase of the number of hidden nodes does not necessarily lead to an improvement of performance. In fact, the best results are obtained with ar-chitectures in which the number of nodes per hidden layer varies between 10 and 20. Roughly speaking, the KF rule im-proves the performance of the neural network in both train-ing and generalization stages. Nevertheless, different neural
50 40 30 20 10 0
Number of hidden nodes 0
20 40 60 80 100
ORR
(%)
1 hidden layer 2 hidden layers
Figure7: Influence of the number of hidden nodes over the change detection accuracy.
networks perform differently and make their errors in diff er-ent regions of input space; we then conjecture that the com-bination of multiple neural networks may improve change detection.
3.3. Accuracy assessment of combination rules
The optimal number of experts to be combined depends on the task at hand, and should be found experimentally. This is not the purpose of the present work, we want just to evaluate the usefulness of the combination concept for land cover change detection. However, it is important to stress that when combining only two networks, if a network has a poor accuracy in a given class, the accuracy of the combina-tion rule will be lower than that of the most precise network. Therefore, the number of combined networks must be supe-rior to 2. Furthermore, it has been shown in [8] that when using the fuzzy integral as a combination rule, the recogni-tion rate depends on thegvalues, if they change, the value of the fuzzy integral will change.
In the present work, three different networks having two hidden layers which contain, respectively, 10, 15, and 20 nodes were chosen to be combined according to the perfor-mances in terms of ORR given inFigure 7. The KF algorithm was used in the training stage which was stopped after 400 iterations. The values ofgcomputed using (13) as well as the λof each land cover class are reported inTable 2.gexpresses the degree of importance of a given network in a particular class. Moreover, allλvalues are closed to -1 because the sum of the different degrees of importance is greater than 1. In this case, the degree of importance may be interpreted as a plausibility value [8]. Banon [15] showed thatλ ≤ 0 ifg is a plausibility measure. On the other hand, parameters of S-OWA-ORandS-OWA-ANDwere experimentally fixed at 0.2 and 0.5, respectively.
Table2: Values ofgandλfor all land cover classes.
Classes 10 15 20 λ
1 0.975 0.962 0.975 −0.999
2 0.926 0.951 0.902 −0.999
3 0.741 0.857 0.612 −0.982
4 0.779 0.612 0.755 −0.969
5 0.678 0.761 0.735 −0.975
6 0.804 0.864 0.814 −0.994
7 0.901 0.865 0.867 −0.998
8 0.548 0.802 0.779 −0.881
Table3: Accuracy rate per land cover class obtained for the different change detectors.
Classes Individual networks % Combined networks %
10 nodes 15 nodes 20 nodes IC IS IAND IOR
1 99.60 99.20 100.00 100.00 100.00 100.00 100.00
2 91.15 94.61 90.38 93.07 93.07 94.23 93.46
3 63.33 90.00 94.81 95.18 96.66 85.18 96.29
4 74.80 76.40 76.00 89.60 90.40 92.40 94.40
5 69.28 73.64 72.50 84.64 84.28 83.21 84.28
6 78.07 81.92 71.92 63.46 90.38 90.00 91.53
7 65.65 70.43 67.39 80.86 78.26 77.82 79.56
8 86.08 78.26 81.17 88.69 90.43 94.78 93.04
Table4: ORR and Khat values obtained for the different change detectors.
Individual networks % Combined networks %
10 nodes 15 nodes 20 nodes IC IS IAND IOR
ORR 78.35 83.34 82.02 86.94 90.54 89.65 91.62
Khat 75.83 81.26 79.78 85.08 89.18 88.17 90.42
overall accuracy, with a gain more than 3% (withIC) and 8%
(with IOR) over the best individual network. More specifi-cally, theIORintegral presents the most satisfactory results in terms of ORR and Khat. However, a surprising outcome in the class Construction ⇒soil (class 6) which was the most critical one where the IC exhibited still the bad accuracy
(63.46%).
3.4. Visual inspection
As a result of implementing the different change detectors presented above, the maps depicted in Figure 8 were ob-tained. In this figure, only the change classes, which are namely, construction⇒soil, water ⇒soil, andvegetation⇒ soilare depicted since we are interested in change detection. It is easy to see that individual neural networks have limited generalization capacity. In fact, they cannot detect a large amount of areas of the class vegetation ⇒soil (see circles in Figures 8a and8b). Moreover, they produce an impor-tant number of spurious changes in the classconstruction⇒ soil (see rectangles in Figures8aand8b). On the contrary, fuzzy integrals provide much cleaner change detection maps, with fewer numbers of missed and isolated spurious changes. Thus, we infer that the combination rules discriminate better
between classes, which demonstrates once again the eff ective-ness of change detector combination.
4. DISCUSSION AND CONCLUSIONS
Construction⇒soil Vegetation⇒soil
Water⇒soil Other classes (a)
Construction⇒soil Vegetation⇒soil
Water⇒soil Other classes (b)
Construction⇒soil Vegetation⇒soil
Water⇒soil Other classes (c)
Construction⇒soil Vegetation⇒soil
Water⇒soil Other classes (d)
Construction⇒soil Vegetation⇒soil
Water⇒soil Other classes (e)
Construction⇒soil Vegetation⇒soil
Water⇒soil Other classes (f)
Figure8: Change detection maps obtained for the different change detectors: (a) network with 15 nodes in each hidden layer, (b) network with 20 nodes in each hidden layer, (c)Choquetintegral, (d)Sugenointegral, (e)S-OWA-ANDintegral, (f)S-OWA-ORintegral.
networks for change detection in remotely sensed imagery. Our contribution was twofold. First, extensive experiments were carried out to obtain the optimal architectural selec-tion for the neural network. In addiselec-tion, the performance of the backpropagation algorithm which is the standard rule for training neural networks was compared to that of Kalman filtering algorithm. The results indicated that Kalman filter-ing algorithm is superior to the backpropagation in terms of convergence rapidity and change detection accuracy. More-over, the use of artificial neural networks in remote sensing image processing was effectively highlighted for change de-tection. In a second step, we combined three different neu-ral networks by using a strategy based on fuzzy integneu-rals to increase change detection accuracy. The main advantage of this method is that it takes into account the reliability for individual networks as well as for a subset of networks. The conventional Sugeno and Choquet fuzzy integrals were used as combination operators. In addition, we implemented
two extensions of Sugeno integral based onOWA-AND and OWA-ORoperators. Notice that theOWA-ANDoperator re-quires that all change detectors make the right decisions, while theOWA-ORrequires that at least one change detec-tor give the right decision. This is the reason for whichIOR andISoutperformedIAND. The results obtained by
REFERENCES
[1] P. Deer,Digital change detection in remotely sensed imagery us-ing fuzzy set theory, Ph.D. thesis, Department of Computer Science, University of Adelaide, Adelaide, Australia, 1999, 185 pages,http://www.kvocentral.org/publications/1999.html. [2] E. F. Lambin and A. H. Strahlers, “Change-vector
analy-sis in multitemporal space: A tool to detect and categorize land-cover change processes using high temporal resolution satellite data,”Remote Sensing of Environment, vol. 48, no. 2, pp. 231–244, 1994.
[3] Y. Chibani and H. Nemmour, “Kalman filtering as a multi-layer perceptron training algorithm for detecting changes in remotely sensed imagery,” inProc. IEEE International Geo-science and Remote Sensing Symposium (IGARSS ’03), vol. 6, pp. 4101–4103, Toulouse, France, July 2003.
[4] H. Nemmour and Y. Chibani, “Comparison between object and pixel level approaches for change detection in multispec-tral images by using neural networks,” inImage and Signal Processing for Remote Sensing IX, vol. 5238 ofProceedings of SPIE, pp. 551–559, Barcelona, Spain, September 2003. [5] G. M. Foody, M. B. McCulloch, and W. B. Yates,
“Classifica-tion of remotely sensed data by an artificial neural network: is-sues related to training data characteristics,”Photogrammetric Engineering and Remote Sensing, vol. 61, no. 4, pp. 391–401, 1995.
[6] X. Dai and S. Khorram, “Development of a new automated land cover change detection system from remotely sensed im-agery based on artificial neural networks,” inProc. IEEE Inter-national Geoscience and Remote Sensing Symposium (IGARSS ’97), vol. 2, pp. 1029–1031, Singapore, Singapore, August 1997.
[7] D. L. Civco, J. D. Hurd, E. H. Wilson, M. Song, and Z. Zhang, “A comparison of land use and land cover change detection methods,” inProc. American Society for Photogrammetry and Remote Sensing (ASPRS ’02), pp. 12–12, Washington, DC, USA, April 2002.
[8] S.-B. Cho and J. H. Kim, “Combining multiple neural net-works by fuzzy integrals for robust classification,”IEEE Trans. Syst., Man, Cybern. C, vol. 25, no. 2, pp. 380–384, 1995. [9] S.-B. Cho, “Fuzzy aggregation of modular neural networks
with ordered weighted averaging operators,” International journal of approximate reasoning, vol. 13, no. 4, pp. 359–375, 1995.
[10] A. Verikas, A. Lipnikas, K. Malmqvist, M. Bacauskiene, and A. Gelzinis, “Soft combination of neural classifiers: a compar-ative study,”Pattern recognition letters, vol. 20, no. 4, pp. 429– 444, 1999.
[11] S.-B. Cho, “Fusion of neural networks with fuzzy logic and genetic algorithm,” Integrated Computer-Aided Engineering, vol. 9, no. 4, pp. 363–372, 2002.
[12] Z.-Q. L. Bruton, L. T. Bezdek, J. C. Keller, et al., “Dynamic image sequence analysis using fuzzy measures,”IEEE Trans. Syst., Man, Cybern. B, vol. 31, no. 4, pp. 557–572, 2001. [13] R. S. Scalero and N. Tepedelenlioglu, “A fast new algorithm
for training feedforward neural networks,”IEEE Trans. Signal Processing, vol. 40, no. 1, pp. 202–210, 1992.
[14] R. G. Congalton, “Accuracy assessment and validation of re-motely sensed and other spatial information,”International journal of Wildland Fire, vol. 10, no. 4, pp. 321–328, 2001. [15] G. Banon, “Distinction between several subsets of fuzzy
mea-sures,”Fuzzy Sets and Systems, vol. 5, no. 3, pp. 291–305, 1981.
Hassiba Nemmour received the M.S. de-gree from the Faculty of Electronic and Computer Sciences, USTHB University, Al-giers, Algeria, in 2003. Actually, she is a Ph.D. student in the same faculty. Her re-search interests include machine learning, soft computing, and remotely sensed image processing.
Youcef Chibaniwas born in Algiers, Alge-ria. He received the Master’s and State Doc-toral degrees in electrical engineering from the University of Science and Technology Houari Boumediene, Algiers, Algeria. He has been teaching and researching as an As-sistant Professor since 2002. His research in-terests include the use of the wavelet decom-position, neural networks, and support vec-tor machines in many applications as