Entry of H5N1 highly pathogenic avian influenza virus into Europe through migratory wild birds: A qualitative release assessment at the species level
P. Gale, A. Goddard, A.C. Breed, R.M. Irvine, L. Kelly and E.L. Snary
Animal Health and Veterinary Laboratories Agency, Weybridge, New Haw, Addlestone, Surrey, KT15 3NB, UK
Abbreviated Title: Avian influenza entry through wild birds
Correspondence: Dr Paul Gale, Animal Health and Veterinary Laboratories Agency, Weybridge, New Haw, Addlestone, Surrey, KT15 3NB, UK. E-mail:
paul.gale@ahvla.gsi.gov.uk
Abstract
Aims: To estimate qualitatively the probabilities of release (or entry) of Eurasian lineage H5N1 highly pathogenic avian influenza (HPAI) virus into Great Britain (GB), the Netherlands and Italy through selected higher risk species of migratory water bird.
Methods and Results: The probabilities of one or more release events of H5N1 HPAI per year (prelease) were estimated qualitatively for 15 avian species, including swans,
geese, ducks and gulls, by assessing the prevalence of H5N1 HPAI in different regions of the world (weighted to 2009) and estimates of the total numbers of birds migrating from each of those regions. The release assessment accommodated the migration times for each species in relation to the probabilities of their surviving infection and shedding virus on arrival. Although the predicted probabilities of release of H5N1 per individual bird per year were low, very low or negligible, prelease was high
for a few species reflecting the high numbers of birds migrating from some regions. Values of prelease were generally higher for the Netherlands than for GB, while ducks
and gulls from Africa presented higher probabilities to Italy compared to the Netherlands and GB.
Conclusions: Bird species with high values of prelease in GB, the Netherlands and Italy
generally originate from within Europe based on data for global prevalence of H5N1 between 2003 and 2009 weighted to 2009. Potential long distance transfer of H5N1 HPAI from North Asia and Eurasia to GB, the Netherlands and Italy is limited to a few species and does not occur from South East Asia, an area where H5N1 is endemic.
INTRODUCTION
Highly pathogenic avian influenza (HPAI) viruses can cause devastating disease in poultry with very high mortality rates in fully susceptible chickens and turkeys. Substantial risks to animal and public health are posed by HPAI viruses, as demonstrated by several major epizootics around the world over the last 25 years. This includes the on-going impact and threat presented by the Eurasian lineage of H5N1 HPAI viruses (referred to here as H5N1) with concerns of zoonotic
transmission and the virus then adapting enabling sustained human-to-human
transmission with pandemic potential (Imai et al. 2013). Globalisation and trade have increased the risk of spread of H5N1 around the world. Documented routes of
introduction of H5N1 include importation of live captive birds and poultry products, including meat, and trade in domestic poultry (Beato and Capua 2011). For example, two H5N1-infected Crested hawk eagles (Spizaetus nipalensis) were illegally
smuggled in hand luggage into Belgium from Thailand, and H5N1 has been isolated from duck meat imported into Korea (van den Berg et al. 2009).
H5N1 has been circulating in avian populations since 1996 after it first emerged in eastern Asia (Newman et al 2009). Mortality events involving large numbers of migratory birds at Qinghai Lake, China, in 2005 raised concerns about wild birds infected in one location trans-locating H5N1 over large distances during migration (Newman et al. 2009). Despite the confirmation of H5N1 in numerous wild bird carcasses, surveillance of live birds has not elucidated a reservoir among free-ranging migratory species and considerable uncertainty remains concerning the role of
migratory birds in the perpetuation and geographic spread of H5N1 (Newman et al. 2009). Wild birds, however, have been deemed responsible for the primary
Analysis of movement ranges and rates of 19 species of wild waterfowl monitored by satellite telemetry indicated that individual migratory wildfowl have the potential to disperse H5N1 over extensive distances, although Gaidet et al. (2010) concluded the likelihood of virus dispersal over long distances by individual wildfowl is low. Keawcharoen et al. (2011) concluded that there was a strong association between spread of H5N1 between poultry flocks in Thailand and the presence of infection in wild birds with the ability of an infected flock to infect other susceptible flocks 1.7-times higher in months when wild birds were infected. During the second half of 2005, H5N1 virus spread rapidly from central Asia to eastern Europe. Gilbert et al. (2006) concluded that the spread of H5N1 virus from Russia and Kazakhstan to the Black Sea basin was consistent in space and time with the hypothesis that birds in the Anatidae family (ducks, geese and swans) have seeded the virus along their autumn migration routes. However, Stoops et al. (2009) concluded that even in an enzootic region of Indonesia the role of migratory birds in transmission of H5N1 is limited. Given this uncertainty in the role of wild birds in the global transmission of H5N1, a release assessment was undertaken to qualify the probabilities of release (or entry) of H5N1 into Great Britain (GB), the Netherlands and Italy (as examples of European countries) at the level of selected species of migratory water birds from different regions of the world. In general, there is a lack of comprehensive data on H5N1 infection in wild bird species so that extrapolation across species and genera is often required. Therefore a specific aim of the release assessment was to identify
METHODS
The approach used was based on the framework set out by the World Organization for Animal Health (OIE 2004). The release assessment describes the probability of entry of the virus into a given European Union (EU) country from other regions of the world. The pathway is presented in Figure 1. The variables (i.e. probabilities and numbers of birds) were expressed qualitatively as negligible, very low, low, medium,
high and very high (EFSA 2006; FAO/WHO 2009). The definitions of the probabilities, i.e. the probabilities of an event occurring, were taken from EFSA (2006) namely; negligible, so rare that it does not merit to be considered; very low, very rare but cannot be excluded; low, event is rare but does occur; medium, event occurs regularly; high, event occurs very often; and very high, event occurs almost certainly.
Accommodating regional differences between the countries of origin of the migratory birds
To accommodate variations in the global prevalence of H5N1 and the origins of wild water birds migrating to Europe, together with their chances of survival and shedding H5N1 virus on arrival, the world was divided into ten regions as set out in Table 1. Selection of species of wild bird for the release assessment
swan was recovered in Scotland in April 2006 (Blissit 2007) with a large number of other countries having also reported H5N1 detection from wild swans (Terregino et al. 2006; Newman et al. 2009). Therefore in total, 19 HRS species were initially considered in the release assessment. However, after initial data collection, three wader species, namely Black-tailed godwit (Limosa limosa), Ruff (Philomachus pugnax) and Lapwing (Vanellus vanellus), together with Red-crested pochard (Netta rufina) were excluded because of lack of data on their shedding of virus and survival during H5N1 infection. Therefore, the release assessment was completed for the 15 species of HRS water bird listed in Table 2.
Estimating the numbers of HRS birds migrating from each region to GB, the Netherlands and Italy
Monthly counts of HRS birds were obtained for the Netherlands (Hustings et al. 2008) and GB (Austin et al. 2008). The total number (N) of birds migrating to each country per year was estimated for each species as the highest monthly count minus the lowest monthly count (Table 2). For example, mean counts of Eurasian wigeon increase from none in July (2006) to about 600,000 individuals in December (2006) in the Netherlands (Hustings et al. 2008) and the total number (N) of individuals of this species entering the Netherlands was therefore 600,000 per year. Counts of Mallard peak in October in GB at 121,545 (for October 2006) but there is a resident
BTO/EURING (2010) provided maps of the global ring recoveries from individual birds previously ringed in GB, the Netherlands or Italy. It was assumed here that individuals of each bird species return to GB, the Netherlands or Italy in the same proportions as represented by the ring recoveries from each of the ten different regions of the world. Thus, the total numbers of birds entering GB, the Netherlands and Italy each year (see Table 2) were multiplied by the ring recovery proportions from each region (pregion) to give the number of migratory birds entering each of the
three countries from each of the 10 regions of the world. These bird numbers (N x pregion) were then converted to a qualitative estimate (n) according to the categories
shown in Table 3. BTO/EURING (2010) did not provide ring recovery data for Bewick’s swan and Whooper swan and so other sources were used (Wernham et al. 2002; Brazil 2008; Rees 2006).
Estimating the probability of release of H5N1 per individual bird at the species level from each region of the world
Qualitative estimation of prevalence of H5N1 in the ten regions of the world
The probability that H5N1 is present at any given time in a given region is represented by pprev. The estimate of pprev was based on data from 2003 to 2009 weighted to 2009.
Thus the number of individual H5N1 outbreaks in poultry and wild birds from 2003-2009 as reported by OIE (2010a,b, 2012) for each country of the world was used to estimate pprev in that country (Table 1). To weight to 2009, countries with ongoing,
unresolved outbreaks as of December 2009 were assessed as having a very high pprev
and for countries with outbreaks that had been ongoing during 2009 but had been resolved by December 2009, pprev was defined as high. For countries that reported
those countries that had only one reported outbreak of H5N1 since 2003, providing it had been resolved before 2009. For countries with no history of H5N1 HPAI
outbreaks in the period 2003-2009 pprev was assessed as negligible. Countries that
shared a border with any country experiencing an unresolved outbreak (to December 2009) had their pprev increased by one level (e.g. low becomes medium) to account for
the likelihood of local wild bird movement and trade in live poultry and poultry products between neighbouring countries. The latter could include live bird markets and illegal trade across border crossings as reviewed by van den Berg (2009). The pprev
estimates from all the countries making up the region as a whole were combined to provide an average estimate of the regional prevalence of H5N1 (Table 1). Extra weighting was given to those countries with higher probability values to take into account the fact that the numbers of outbreaks in poultry in some countries were higher by orders of magnitude than in other countries (OIE 2010a). Since wild birds could come from anywhere within the region, an average value of pprev is appropriate.
The estimation of pprev also considered the differing qualities of surveillance systems
and veterinary infrastructures in each country and the possibility of under reporting. Thus although pprev for certain countries in Western Europe was assessed as medium
(e.g. GB, Germany, Denmark and France) because they had reported more than one outbreak between 2003 and 2008, Western Europe was given an overall low pprev
reflecting the fact that there was compulsory active and passive surveillance for HPAI in wild birds and poultry in EU countries during the time of this study and H5N1 outbreaks have been rapidly controlled (EC 2007/268/EC).
Probability that an individual HRS wild bird, at the time of migration, is infected
Given H5N1 is present in a region, only a small proportion of migratory birds within that region will be infected. Some may have recovered from previous infection and others will not have been exposed at all. The probability that an individual bird, at the time of migration, is infected, given H5N1 is present in the region is given by pbird.
Kou et al. (2009) used PCR to determine the prevalence of H5N1 in wild birds in China. In Qinghai province, 4.25% (61 of 1435) of individual waterbirds tested from September 2005 to September 2007 were positive (Kou et al. 2009). The results from Qinghai province may be unrepresentative because a massive H5N1 outbreak had occurred in wild birds at Lake Qinghai in April 2005. In the other 13 provinces of China (excluding Qinghai), the overall prevalence was 0.75%, with 14 of 1863 waterbirds (including Northern pintail, Mallard and Tufted duck) testing H5N1 positive. Of the 733 migratory birds, including a selection of waders and herons, sampled in Indonesia between October 2006 and September 2007, 1.4% were seropositive (for H5) although none were positive by RT-PCR (Stoops et al. 2009). Siengsanan et al. (2009) reported that the prevalence of infection with H5N1 virus in wild birds in Thailand from 2004 to 2007 was 0.96% (60/6,263 pooled samples, representing 15,660 individual wild birds). The annual prevalence varied considerably with a peak of 2.7% in 2004 dropping to 0.5% in 2005. Most positive samples were from peridomestic resident species, and infected wild bird samples were found only in provinces where poultry outbreaks had occurred. Keawcharoen et al. (2011) reported a 0.78% H5N1 prevalence (RT-PCR) in wild birds in Thailand between January 2004 and December 2007. Gaidet et al. (2010) estimate that for an individual migratory waterfowl there are only 5-15 days per year when infection could result in the
evidence, it was therefore assumed that, in general, pbird is low for all bird species. The
significance of this is discussed.
Estimating migration durations for birds from different regions of the world to GB,
the Netherlands and Italy
The duration of migration for each species from each region was estimated in Table 4 based on the migration distance, the number of stopover events, the average time per stopover event and the speed of direct flight. Direct distances between a major city in each of the three European countries (Table 4) and in each of the five regions of the world from which the HRS birds migrate (Table 3) were obtained (MapCrow 2012). Milan was chosen because it is nearer (compared to southern Italy) to northern Europe and NAEA where most of the water birds migrate from. Similarly London was chosen for GB because it is nearer to Europe and Asia than the more westerly parts of GB. The actual flight times may be relatively short compared to the stopover times, which may range from a few days to four weeks (Gaidet et al. 2008; Newton 2008). In this respect, exact distances between the countries have less effect on the predicted migration times in Table 4 than the number of stopovers. There is no relationship between the size of a bird and how fast it flies (Stanford University 2010). On the basis of satellite tracking data for swans, geese and duck species (Pennycuick et al. 1999; Newton 2008; Gaidet et al. 2008) a direct flight speed of 40 km h-1 was
assumed. Gulls tend to fly at slower speeds (Stanford University 2010) and a speed of 20 km h-1 was assumed. Long stopover periods break up the migration of most duck,
goose and swan species and an average time of 13.75 days per stopover was
outside Europe. No stopovers are allocated for within continental Europe with a single stopover for birds migrating from Eastern Europe to GB (Table 4). The number of stopovers assumed here are realistic worst case estimates and a Garganey migrating from Nigeria to Russia, for example, used three stopovers (Gaidet et al. 2008).
Probability of H5N1-infected HRS birds surviving the duration of migration
The published survival times in days postinoculation (dpi) of H5N1-infected bird species were compared with the duration of migration to estimate the probability (psurv) of that bird surviving long enough to complete the migration. The unit for psurv is
the probability of survival per individual H5N1-infected migrating bird. The durations of migration broadly fall into periods of 1, 4 and > 15 days (Table 4). In the case of Whooper swans, 9 of 9 died between 4 and 6 dpi (Brown et al. 2008a) with 13 of 14 Mute swans dying between 5 to 14 dpi (Brown et al. 2008a; Kalthoff et al. 2008). The probability of a swan species surviving the migration from Western Europe to GB, the Netherlands or Italy was therefore judged to be high because those migrations can be covered in 0.7 to 1.2 days (Table 4). In contrast, while swans can migrate from Eastern Europe to the Netherlands or Italy in 1.1 to 1.2 days (Table 4), they take 15.5 days to migrate from Eastern Europe to GB (assuming one stopover). This is
consistent with the long stopover in the Netherlands made by a Bewick’s swan (Rees 2006). Therefore the probability of swan survival from Eastern Europe to the
2010) and survival from all regions of the world was assumed to be high. The higher susceptibility of the Aythya diving ducks was taken into account. Clinical signs developed at 3 or 4 dpi in Aythya ducks (Keawchareon et al. 2008) by which time they could have migrated within Western Europe and from Eastern Europe to Italy and the Netherlands (Table 4) and therefore psurv for periods of 1 - 2 days is assumed
to be high. Keawchareon et al. (2008) reported that 4 (1 severe) of 8 Common pochard and 7 (3 severe) of 8 Tufted duck developed clinical signs and it was therefore assumed that psurv for 4 days is medium and low for Common pochard and
Tufted duck, respectively. It was assumed that gulls have a high probability of surviving up to 4 days during which time they can migrate within Europe and a
medium probability of survival for >4 days since 3 of 5 and 2 of 3 gulls died between 5 and 10 days (Brown et al. 2006; Brown et al. 2008b).
Probability of shedding H5N1 after migration
Pharyngeal shedding of H5N1 by gulls and ducks occurs for longer than cloacal shedding (Brown et al. 2006). Cloacal shedding is less common than pharyngeal shedding in duck species (Keawcharoen et al. 2008). The release assessment,
therefore, focuses on pharyngeal shedding. Pharyngeal shedding by ducks, geese and swans continues for 7 - 8 dpi peaking at 3 - 4 dpi (Hulse-Post et al. 2005; Kalthoff et al. 2008; Brown et al. 2006; Brown et al. 2008a) while gulls shed virus for slightly longer periods of 6 - 10 dpi (Brown et al. 2006; Brown et al. 2008b). The duration of shedding (post inoculation) for each H5N1-infected bird species is compared with the duration of migration to estimate the probability (pshed) of that bird still shedding virus
on arrival after migration. The unit for pshed is the probability of shedding per
respectively, for pshed. Thus, for all species, pshed values were high for birds coming
from Western Europe and Eastern Europe to GB, the Netherlands and Italy but low for birds from NAEA. Similarly, for birds coming from Western Africa and ESA, the pshed
values were low for those going to GB and the Netherlands, but medium for birds going to Italy. A negligible was not assigned to pshed for any species because
Keawcharaoen et al. (2008) detected RNA in H5N1-infected Common pochard for up to 21 days after inoculation.
Combining the probabilities to estimate the probability of release per bird
The probability of release of H5N1 per individual bird (prelease_indiv) on arrival in GB,
the Netherlands or Italy is estimated for each species from each region of the world by combining the probabilities pprev, pbird, psurv and pshed (Figure 1). In general, it is
assumed that if any two probabilities are low, then prelease_indiv is very low. This reflects
the fact that in quantitative terms, multiplying two small fractions gives a very small fraction. Extending this, if any three probabilities are low, then prelease_indiv is negligible.
Similarly low x high is assumed to be low as is low x medium. Thus, if one of the probabilities is low and the other three are medium or high, then prelease_indiv is low. This
is based on medium x medium giving a medium and high x high giving a high, and in this respect the risk assessment does not underestimate the risks. A negligible in any one of the terms gives a negligible value to prelease_indiv based on the FAO/WHO (2009)
assignment of negligible to a probability that is indistinguishable from zero such that the event can be discounted from the analysis.
Estimating the probability of release of H5N1 at least once per year (per species) The probability of release (prelease) of H5N1 at least once (i.e. through one or more
combining prelease_indiv (Table 5) and the corresponding n for that species from that
region (Table 3) on a case by case basis (Snary et al. 2012). RESULTS
Estimated number of birds from each region coming to Europe
Qualitative estimates of the number of birds of each species coming into GB, the Netherlands and Italy from each of the ten regions are presented in Table 3. Overall numbers were non-negligible from Western Europe, Eastern Europe, NAEA, Western Africa and ESA with high numbers for species such as Greater white-fronted goose, Eurasian wigeon, Common teal, Mallard, Tufted duck and Black-headed gull
generally only coming from Western Europe. The exception is for Eurasian wigeon in the Netherlands where high numbers come from NAEA which has a high value of pprev
(Table 1). Numbers of birds coming into GB, the Netherlands and Italy from Western Africa and ESA are negligible for geese and swans and low or very low for most ducks and Black-headed gull from Western Africa (Table 3).
Predicted probabilities of release per individual bird
The probabilities of release per individual bird at the species level (prelease_indiv) are
presented in Table 5 for GB, the Netherlands and Italy. Since there is only one migration per year for these water bird species, the units of prelease_indiv are per bird per
year. The probabilities were negligible or very low for most species/region
combinations, the exceptions being birds from Eastern Europe to the Netherlands and Italy, and for some species from Africa to Italy for which the probabilities predicted were low (Table 5).
The probability of release (prelease) of H5N1 through one or more individual birds (i.e.
at least once) per year was estimated for each species of bird migrating to GB, the Netherlands and Italy from each of the 10 regions of the world (Table 6) using the prelease_indiv values in Table 5 and the corresponding number (n) of birds in Table 3.
Collating the probabilities according to each qualitative category shows some apparent differences for the three countries. In particular, the Netherlands and Italy have 23 and 26 probabilities, respectively, for particular species/region combinations which are medium or high compared to only nine for GB. GB has 66 negligible, very low or low probabilities compared to only 52 and 49 for the Netherlands and Italy, respectively.
DISCUSSION
In this study, the probabilities of release of Eurasian lineage H5N1 HPAI virus through migratory wild water birds entering three European countries from different regions of the world are estimated at the species level. All 15 species of bird studied here are highly migratory, breeding in the summer months in the high Arctic tundra of Greenland, Iceland, northern Europe, northern Asia and Siberia. In autumn, these birds migrate to winter in Europe. The exception is the Garganey which winters in Africa and migrates north through Europe in the spring, returning in the autumn. Some populations of ducks and gulls also winter in Africa and this was taken into account through the BTO/EURING (2010) data.
The predicted magnitudes of prelease in Table 6 vary according to the bird species and
its region of origin. Thus only those birds originating from Europe, NAEA and Africa present non-negligible probabilities of H5N1 release to the three EU countries
to certain species, namely Greater white-fronted goose, Greylag goose, Eurasian wigeon, Common teal, Mallard, Tufted duck and Black-headed gull, originating from Western and Eastern Europe. Thus a conclusion is that if H5N1 is not present in other European countries, the probabilities of release of H5N1 in GB, the Netherlands and Italy through migratory waterbirds are considerably lower. Indeed, values of prelease for
birds from NAEA, WA, and ESA have a greater proportion of negligible, low and
very low magnitudes compared to those from Europe. Values of prelease for birds from
South East Asia present negligible risk for GB, the Netherlands and Italy (despite the
very high prevalence of H5N1 assigned to this region (Table 1)) reflecting the
negligible numbers of birds (Table 3) and negligible probabilities for prelease_indiv from
this region (Table 5). Indeed, comparing Table 5 and Table 3 it can be seen that in general, the highest values of prelease_indiv (namely those birds from Eastern Europe
going to the Netherlands and Italy, and birds going from Africa to Italy) do not match with the highest bird numbers (namely those from Western Europe or NAEA in the case of Eurasian wigeon).
In view of the high numbers of some species, e.g. Eurasian wigeon and Mallard (Table 3), it may not be surprising if at least one individual bird is infected and still shedding H5N1 on arrival each year. Thus high values for prelease in Table 6 are not
unexpected. It should be noted that entry of H5N1 may never be detected because it may not result in exposure and infection of poultry or detection by wild bird
surveillance activities. Furthermore, the probabilities of exposure and incursion in poultry, given release of H5N1 through HRS wild birds has occurred, will vary from country to country.
surviving migration and still shedding virus on arrival. The release assessment also does not consider the ability of an H5N1-infected bird to undertake migration. There is evidence for the Northern pintail that the proportion migrating from Japan was significantly lower among birds that used wetlands where H5N1 was detected in Whooper swans compared to those that used other sites, and that two of the birds delayed migration by >30 days after other birds had departed (Yamaguchi et al. 2010). Such a delay for an H5N1-infected Northern pintail from Western Africa to Italy, for example, would postpone arrival to outside the period of 1 - 4 dpi during which oropharyngealshedding of virus occurs (Brown et al. 2006).
There is considerable variation between individual birds of the same species in their migration behaviour and the length and number of stopovers. This may also reflect the environmental and food supply conditions. However, the duration times for migration presented in Table 4 are believed to represent realistic worst cases. Thus it is
estimated that ducks migrating from Western Africa to Italy take 4.1 days (Table 4) which is in good agreement with the 4 days recorded by Gaidet et al. (2008) for Garganey flying from Nigeria to Crete. Similarly for ducks migrating from East Africa, migration times of 19.1 days to GB and 19.0 days to the Netherlands are predicted (Table 4). This only allowed for one stop-over in the flight to GB. These times are shorter than the 33 days observed for a single Garganey duck to fly from Nigeria to Romania with three main stopovers (Gaidet et al. 2008). The approach here predicts that swans migrating from Warsaw to the Netherlands would take 1.1 days (Table 4) which is consistent with the 2 days reported by Rees (2006) for Bewick’s swans to migrate from Eastern Europe to Denmark. Similarly Bewick’s swans
Although the Bewick’s swans studied by Rees (2006) migrated from arctic Russia to GB in 3 months the approach here predicts 19.2 days for Moscow to GB (Table 4). This reflects the long stop-over in the Netherlands in the study of Rees (2006). NAEA is a vast area from which medium and high numbers of some HRS birds migrate to GB, the Netherlands and Italy each year (Table 3). For NAEA, Moscow was chosen in preference to Omsk, for example, because it is further west and the shorter distances make the release assessment more worst case.
The bio-geographic conditions differ in GB, the Netherlands and Italy and explain some of the differences in the values predicted for prelease in Table 6. First, the number
of species/region combinations with high prelease was greater for the Netherlands than
for GB, and GB had considerably more negligible, very low and low estimates of prelease (Table 6). This reflects the greater abundance of water birds wintering in the
Netherlands (Table 2) and the fact that no stopovers were allowed for in the release assessment between Eastern Europe and the Netherlands (Table 4). In contrast, one stopover was allowed for between Eastern Europe and GB. Second, the prelease values
for Italy from geese and swans were in general lower than those for the Netherlands from a given region reflecting the fact that Italy has very few geese and
Bewick’s/Whooper swans over-wintering. For example, 750,000 geese (including 600,000 Greater white-fronted geese) winter in the Netherlands compared to around 16,000 in Italy (Table 2). Third, the prelease values from duck species and the
While the values of prelease for all geese and swan species from Africa are negligible,
reflecting their negligible abundances there (Table 3), prelease is in general
non-negligible for the ducks species and the Black-headed gull originating from Western Africa. Only two species, namely Northern pintail and Garganey, migrate from ESA to GB, the Netherlands and Italy in non-negligible numbers (Table 3). The magnitude of prelease predicted for Northern pintail arriving in Italy from ESA was estimated to be medium, but very low for GB and the Netherlands (Table 6). Since 2006, H5N1 has been considered endemic in Egypt (OIE 2012) which is relatively close to Italy. No Northern pintails ringed in Italy have so far been recovered in Egypt and the general direction of migration of Northern pintail from Egypt is north-east and not towards Italy (BTO/EURING 2010). Thus, migration of Northern pintail specifically from Egypt does not present a significant probability of release of H5N1 to Italy.
According to Keawchareon et al. (2008) and Yamaguchi et al. (2008), the Mallard is a potential candidate for being a long distance vector of H5N1. The results here suggest Mallard, together with Eurasian wigeon and Greater white-fronted goose, would be better long distance vectors of H5N1 than the other species considered based on prelease
values (Table 6) for birds coming in from NAEA. The Tufted duck was the wild bird species with the highest number of reported H5N1 infections (44 confirmed) in the 2006 outbreak in Denmark (Preben Willeberg, pers comm. 4 Feb 2010). Keawcharoen
et al. (2008) concluded that Tufted ducks are more likely to act as sentinels of H5N1 than to be long-distance vectors. Indeed this is consistent with the results in Table 6 which show prelease in GB/Nethlerlands/Italy is medium or high through Tufted ducks
from Europe but negligible through birds from NAEA despite medium numbers coming to the Netherlands from NAEA (Table 3). This reflects the negligible
pochard is also a less likely candidate as a vector than Mallard according to
Keawchareon et al. (2008), because those individuals that excreted most virus also developed severe neurological disease. However, the predicted values for prelease for
Common pochard are similar to those for Mallard from Eastern Europe and NAEA (Table 6). This discrepancy with the conclusion of Keawchareon et al. (2008) perhaps reflects the fact that the release assessment here did not take into account the ability of an infected bird to migrate.
While most Mute swans are killed by H5N1 a few adults may survive, shedding virus for several days without showing severe clinical symptoms (Kalthoff et al. 2008). The values of prelease for Mute swans from outside Europe are negligible. However, prelease
for Mute swans from Western Europe to GB and from Eastern Europe to Italy is
medium (Table 6). H5N1 was confirmed in 16 Mute swans wintering in the south of Italy in 2006 (Terregino et al. 2006). Those birds are believed to have migrated from the Black Sea region of eastern Europe. The prediction of a low prelease for Whooper
swans arriving in GB albeit from Western Europe (Table 6) is interesting in the light of the H5N1-infected bird found dead on the east coast of Scotland on 29 March 2006 (Blissitt 2007). It is possible that the swan was actually infected within GB and that it was effectively a sentinel – dead swans being large and white are conspicuous
Whooper swans (see Teifke et al. 2007) such that the local pprev at that time would
have been high.
Mixing of different wildfowl species is well documented (see Fig 15 of Rees 2006). Horizontal transmission from one bird to another in the migration chain is difficult to incorporate in this release assessment. However transmission through a “baton effect” between different individual birds at stopover sites would be accommodated by the values of pprev used for Western Europe, Eastern Europe and NAEA in this release
assessment.
Although there are quantitative data available for many of the parameters, a qualitative approach was adopted here because of the uncertainty both in the
geographic ranges of the birds and the timings reflecting the lengths of the stopovers and duration of migration. The uncertainty in the magnitude of pbird in particular
supports using a qualitative assessment over a quantitative assessment. Thus, the magnitude of pbird will vary depending on the species of bird reflecting differences in
their behaviour, contact with poultry, habitat preference and susceptibility to infection. H5N1 prevalences differed significantly among groups of different wild bird species in Thailand (Keawcharoen et al. 2011) and ideally separate exposure-consequence assessments should be conducted for each species in each region of the world to estimate probabilities of infection. Given the vast size of NAEA in particular and the spatial variation in H5N1 in wild birds in countries such as China, Indonesia and Thailand in SEA (Kou et al. 2009, Stoops et al. 2009; Keawcharoen et al. 2011), together with the estimation that there are only 5-15 days per year during which infection could result in a dispersal of H5N1 over 500 km (Gaidet et al. 2010), the assumption in this release assessment that pbird is low, given H5N1 is present in that
that pbird is low is that the predicted prelease_indiv (per bird per year) from any region was
not greater than low (Table 5) despite the high or medium probabilities of some birds surviving and shedding H5N1 on arrival. It should be noted that the value of prelease
(Table 6) reflects the total number (n) of birds of each species coming from each region of the world (Table 3). Thus, although prelease_indiv for Eurasian wigeon from
NAEA is estimated to be very low for the Netherlands (Table 5), prelease is high (Table
6) reflecting the high numbers of Eurasian wigeon coming from NAEA (Table 3). In conclusion, the probabilities of one or more H5N1-release events per year vary according to bird species and region of origin reflecting the number of birds from each region and the probability that a bird is infected in the region of origin, and still alive and shedding H5N1 on arrival. Birds with high probabilities of releasing H5N1 in GB, the Netherlands and Italy generally originate from within Europe itself. Thus if H5N1 is not present in European countries, the probabilities of release of H5N1 in GB, the Netherlands and Italy through migratory waterbirds are considerably lower. If the disease situation changes, then it would be important to revisit the assessment. ACKNOWLEDGEMENTS
This study has been performed with support from the EU Commission (grant SSPE-CT-2007-044429: Improved diagnosis and early warning systems for avian influenza outbreak management – FLUTEST). We thank Dr Rowena Kosmider of AHVLA for helpful discussion.
REFERENCES
Atkinson, P.W., Clark, J.A., Delany, S., Hamalla Diagana, C., du Feu, C., Fiedler, W.,
Austin, G., Collier, M., Calbrade, N., Hall, C. and Musgrove, A. (2008) Waterbirds in the UK 2006/07. The Wetland Bird Survey (WeBS) by BTO, WWT, RSPB and JNCC. (http://www.bto.org/webs/news/AR06_07/index.htm).
Beato, M.S. and Capua, I. (2011) Transboundary spread of highly pathogenic avian influenza through poultry commodities and wild birds: a review. Rev. sci. tech. Off. Int. Epiz. 30, 51-61.
Beekman, J.H., Nolet, B.A. and Klaassen, M. (2002) Skipping swans: Fuelling rates and wind conditions determine differential use of migratory stopover sites of
Bewick’s swan Cygnus bewickii. Ardea 90, special issue 437-460.
Blissitt, M. (2007) H5N1 avian influenza virus found in a whooper swan in Scotland.
Government Veterinary Journal 17, 10-13.
Brazil, M. (2008) The Whooper Swan. T & AD Poyser, London.
BTO/EURING (2010) Bird migration website http://www.bto.org/birdtrack/ and
www.euring.org). Accessed 30 July 2010.
Brown, J.D., Stallknecht, D.E. and Swayne, D.E. (2008a) Experimental infection of swans and geese with highly pathogenic avian influenza virus (H5N1) of Asian lineage. Emerg Infect Dis 14, 136-142.
Brown, J.D., Stallknecht, D.E. and Swayne, D.E. (2008b) Experimental infections of herring gulls (Larus argentatus) with H5N1 highly pathogenic avian influenza viruses by intranasal inoculation of virus and ingestion of virus-infected chicken meat. Avian Pathology 37, 393-397.
EC (2007/268/EC) Commission Decision on the implementation of surveillance programmes for avian influenza in poultry and wild birds to be carried out in the Member States and amending Decision 2004/450/EC. 13 April 2007 (http://eur-lex.europa.eu/LexUriServ/LexUriServ.do?uri=OJ:L:2007:115:0003:0017:EN:PDF). Accessed 8/9/13.
EFSA (2006) Opinion “Migratory birds and their possible role in the spread of highly pathogenic avian influenza”. The EFSA Journal 357, 1-46.
FAO/WHO (Food and Agricultural Organization of the United Nations World Health Organisation) (2009). Risk characterisation of microbiological hazards in foods. Guidelines. Microbiological Risk Assessment Series, No. 17.
Gaidet, N., Newman, S.H., Hagemeijer, W., Dodman, T., Cappelle, J., Hammoumi, S., De Simone, L. and Takekawa, J.Y. (2008) Duck migration and past influenza A (H5N1) outbreak areas. Emerg Infect Dis 14, 1164-1166.
Gaidet, N., Cappelle, J., Takekawa, J.Y., Prosser, D.J., Iverson, S.A., Douglas, D.C., Perry, W.M., Mundkur, T and Newman, S.H. (2010) Potential spread of highly pathogenic avian influenza H5N1 by wildfowl: dispersal ranges and rates determined from large-scale satellite telemetry. J Appl Ecology 47, 1147-1157.
Gilbert, M., Xiao, X., Domenech, J., Lubroth, J., Martin, V. and Slingenbergh, J. (2006) Anatidae migration in the western Palearctic and spread of highly pathogen avian influenza H5N1 virus. Emerg Infect Dis 12, 1650- 1656.
Hustings, F., Koffijberg, K., van Winden, E., van Roomen, M., SOVON Ganzen-en Zwanenwerkgroep and Soldaat, L. (2008) Waterbirds in the Netherlands in 2006/2007 (http://www.sovon.nl/pdf/Mon_2008-04Wavorap.pdf ).
Kalthoff, D., Breihaupt, A., Teifke, J.P., Globig, A., Harder, T., Mettenleiter, T.C. and Beer, M. (2008) Highly pathogenic avian influenza virus (H5N1) in experimentally infected adult mute swans. Emerg Infect Dis 14, 1267-1270.
Keawcharoen, J., van Riel, D., van Amerongen, G., Bestebroer, T., Beyer, W.E. et al., (2008) Wild ducks as long-distance vectors of highly pathogenic avian influenza virus (H5N1). Emerg Infect Dis 14, 600-607.
Keawcharoen, J., van den Broek, J., Bouma, A., Tiensin, T., Osterhaus, A.D.M.E., Heesterbeek, H., et al. (2011) Wild birds and increased transmission of highly pathogenic avian influenza (H5N1) among poultry, Thailand. Emerg Infect Dis 17, 1,016- 1,022.
Imai, M., Herfst, S., Sorrell, E.M., Schrauwen, E.J.A., Linster, M., De Graaf, M., Fouchier, R.A.M., Kawaoka, Y. (2013) Transmission of influenza A/H5N1 viruses in mammals. Virus Research 178, 15-20.
Kou, Z., Li, Y., Yin, Z., Guo, S., Wang, M., Gao,. X., Li, P., Tang, L., et al. (2009) The survey of H5N1 flu virus in wild birds in 14 provinces of China from 2004 to 2007. PLOS ONE 4(9), 0006926.
MapCrow (2012) Travel distance calculator (www.mapcrow.info). Accessed 20 June 2012.
Newman, S.C., Iverson, S.A., Takekawa, J.Y., Gilbert, M., Prosser, D.J., Batbayar, N., Natsagdorj, T. and Douglas, D.C. (2009) Migration of whooper swans and
outbreaks of highly pathogenic avian influenza H5N1 virus in Eastern Asia. Plos ONE
Newton, I. (2008) The migration ecology of birds. Academic Press.
Office International des Epizooties (OIE) (2004). Applying the OIE risk analysis framework. In: Handbook on Import Risk Analysis for Animals and Animal Products. Volume 1, Introduction and qualitative risk analysis. Paris: World Organisation for Animal Health, pp. 31-53.
Office International des Epizooties (OIE) (2010a) Outbreaks of avian influenza (subtype H5N1) in poultry. From the end of 2003 to 20 September 2009
http://www.oie.int/downld/AVIAN%20INFLUENZA/Graph%20HPAI/graphs %20HPAI%2020_09_2009.pdf. Accessed 2 July 2012.
Office International des Epizooties (OIE) (2010b) World Animal Health Information Database (WAHID) http://web.oie.int/wahis/public.php?page=home. Accessed July 2010.
Office International des Epizooties (OIE) (2012) Avian influenza facts and figures: H5N1 timeline. (http://web.oie.int/eng/info_ev/en_AI_factoids_H5N1_Timeline.htm). Accessed 2 July 2012.
Pennycuick, C.J., Bradbury, T.A.M., Einarsson, O. and Owen, M. (1999) Response to weather and light conditions of migrating whooper swans Cygnus Cygnus and flying height profiles, observed with the Argos satellite system. Ibis 141, 434-443.
Rees, E. (2006) Bewick’s swan. T & AD Poyser, London.
Siengsanan, J., Chaichoune, K., Phonaknguen, R., Sariya, L., Prompiram, P.,
Kocharin, W., Tangsudjai, S., Suwanpukdee, S. et al. (2009) Comparison of outbreaks of H5N1 highly pathogenic avian influenza in wild birds and poultry in Thailand.
Journal of Wildlife Diseases 45, 740-747.
entering the United Kingdom. PLoS ONE 7(2): e27918. doi:10.1371/journal.pone.0027918
Stanford University (2010) How fast and high do birds fly?
http://www.stanford.edu/group/stanfordbirds/text/essays/How_Fast.html
Stoops, A.C., Barbara, K.A., Indrawan, M., Ibrahim, I.N., Petrus, W.B., Wijaya, S., Farzeli, A., Antonjaya, U., et al. (2009) H5N1 surveillance in migratory birds in Java, Indonesia. Vector Borne Zoonotic Dis 9, 695-702.
Teifke, J.P., Klopfleisch, R., Globig, A., Starick, E., Hoffmann, B., Wolf, P.U., Beer, M., Mettenleiter, T.C. and Harder, T.C. (2007) Pathology of natural infections by H5N1 highly pathogenic avian influenz virus in mute (Cygnus olor) and whooper (Cygnus Cygnus) swans. Vet Pathol 33, 137-143.
Terregino, C., Milani, A., Capua, I., Marino, A.M.F. and Cavaliere, N. (2006) Highly pathogenic avian influenza H5N1 subtype in mute swans in Italy. Vet Record 158, 491 Van den Berg, T. (2009) The role of the legal and illegal trade of live birds and avian products in the spread of avian influenza. Rev. Sci. Tech. Off. Int. Epiz. 28(1), 93-111. Wernham, C.V., Toms, M.P., Marchant, J.H., Clark, J.A., Siriwardena, G.M. and Baillie, S.R. (eds) (2002). The migration atlas: movements of the birds of Britain and Ireland. T&AD Poyser, London.
Yamaguchi, N., Hiraoka, E., Fujita, M., Hijikata, N., Ueta, M., Takagi, K., Konno, S., Okuyama, M., et al. (2008) Spring migration routes of mallards (Anas platyrhynchos) that winter in Japan, determined from satellite telemetry. Zool Sci 25, 875-881.
Tables
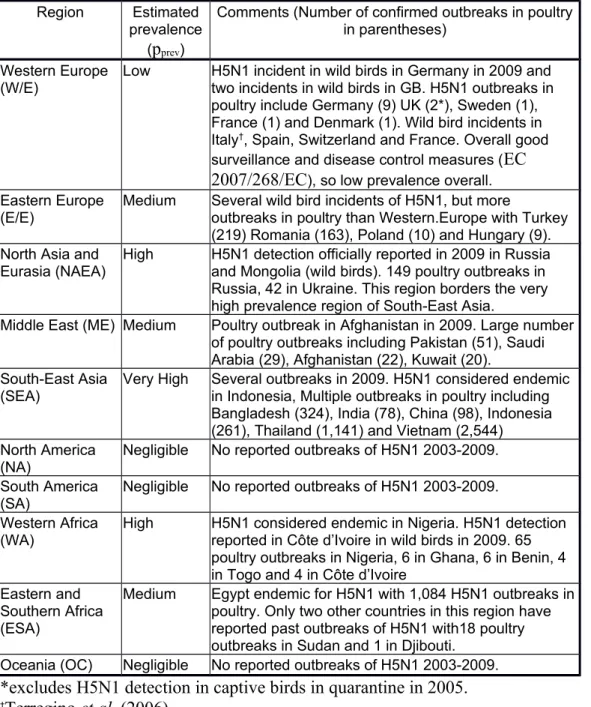
Table 1: Qualitative estimate of the prevalence of H5N1 in regions of the world between
2003 and 2009 based on data from OIE (2010a,b, 2012). The value of pprev is weighted to
2009.
Region Estimated prevalence
(pprev)
Comments (Number of confirmed outbreaks in poultry in parentheses)
Western Europe
(W/E) Low H5N1 incident in wild birds in Germany in 2009 and two incidents in wild birds in GB. H5N1 outbreaks in poultry include Germany (9) UK (2*), Sweden (1), France (1) and Denmark (1). Wild bird incidents in Italy†, Spain, Switzerland and France. Overall good
surveillance and disease control measures (EC 2007/268/EC), so low prevalence overall. Eastern Europe
(E/E) Medium Several wild bird incidents of H5N1, but more outbreaks in poultry than Western.Europe with Turkey (219) Romania (163), Poland (10) and Hungary (9). North Asia and
Eurasia (NAEA)
High H5N1 detection officially reported in 2009 in Russia and Mongolia (wild birds). 149 poultry outbreaks in Russia, 42 in Ukraine. This region borders the very high prevalence region of South-East Asia.
Middle East (ME) Medium Poultry outbreak in Afghanistan in 2009. Large number of poultry outbreaks including Pakistan (51), Saudi Arabia (29), Afghanistan (22), Kuwait (20).
South-East Asia
(SEA) Very High Several outbreaks in 2009. H5N1 considered endemic in Indonesia, Multiple outbreaks in poultry including Bangladesh (324), India (78), China (98), Indonesia (261), Thailand (1,141) and Vietnam (2,544)
North America (NA)
Negligible No reported outbreaks of H5N1 2003-2009. South America
(SA) Negligible No reported outbreaks of H5N1 2003-2009. Western Africa
(WA)
High H5N1 considered endemic in Nigeria. H5N1 detection reported in Côte d’Ivoire in wild birds in 2009. 65 poultry outbreaks in Nigeria, 6 in Ghana, 6 in Benin, 4 in Togo and 4 in Côte d’Ivoire
Eastern and Southern Africa (ESA)
Medium Egypt endemic for H5N1 with 1,084 H5N1 outbreaks in poultry. Only two other countries in this region have reported past outbreaks of H5N1 with18 poultry outbreaks in Sudan and 1 in Djibouti.
Oceania (OC) Negligible No reported outbreaks of H5N1 2003-2009. *excludes H5N1 detection in captive birds in quarantine in 2005.
Table 2: Numbers of migratory birds (per year) entering GB, the Netherlands and Italy calculated as the difference between totals of monthly counts (maximum - minimum)
HRS Bird Species GB, Wetland Bird Survey
data of Austin et al. (2008) The Netherlands (Hustings et al. 2008) Italy, peak national count in January between 1990 and 2005. Atkinson et al. (2006)
Bewick’s Swan Cygnus columbianus 3,775 13,000 0
Whooper Swan Cygnus cygnus 7,428 2,000 0
Mute Swan Cygnus olor 11,542 5,000 3,248
Greater White-fronted Goose (European race) Anser albifrons albifrons
1,341 600,000 11,049
Greylag Goose Anser anser 72,980 150,000 5,392
Red-breasted Goose Branta ruficollis 4 7 4
Eurasian Wigeon Anas penelope 324,097 600,000 123,936
Common Teal Anas crecca 126,498 50,000 97,529
Mallard Anas platyrhynchos 97,872 180,000 208,000
Northern Pintail Anas acuta 25,344 20,000 12,781
Garganey Anas querquedula 38 (May) + 47 (Aug)* 80 (Apr) + 110 (Aug)* 223
Northern Shoveler Anas clypeata 11,200 10,000 22,811
Common Pochard Aythya ferina 24,160 45,000 42,189
Tufted Duck Aythya fuligula 46,429 150,000 7,725
Black-headed Gull Larus ridibundus 150,555 150,000 217,468
Table 3: Qualitative estimation of number of HRS species migrating from different regions of the world to GB, the Netherlands and Italy (per year) (n). Negligibles are excluded.
W/E E/E NAEA WA ESA
GB NL IT GB NL IT GB NL IT GB NL IT GB NL IT
Bewick’s swan L L L L VL L
Whooper swan L L VL VL VL VL
Mute swan M L VL VL VL L
Greater white-fronted goose VL H L VL M L VL M
Greylag goose VL H L L L
Red-breasted goose VL VL VL VL
Eurasian wigeon H H M M M M M H M L L L
Common teal H M M L L L L L L L VL VL
Mallard M H H L L L L M M VL L
Northern pintail M M L L L L L L L L L L VL VL L
Garganey VL VL VL VL VL VL VL VL VL VL VL VL VL VL VL
Northern shoveler L L M VL L L L L L VL VL L
Common pochard L M M L L L L M M VL VL VL
Tufted duck M H L L M L L M L VL
Black-headed gull H H H L M M L L L L L
W/E Western Europe, E/E Eastern Europe, NAEA North Asia and Eurasia, WA Western Africa, ESA Eastern and Southern Africa. Negligible numbers from Middle East, South East Asia, North America, South America and Oceania.
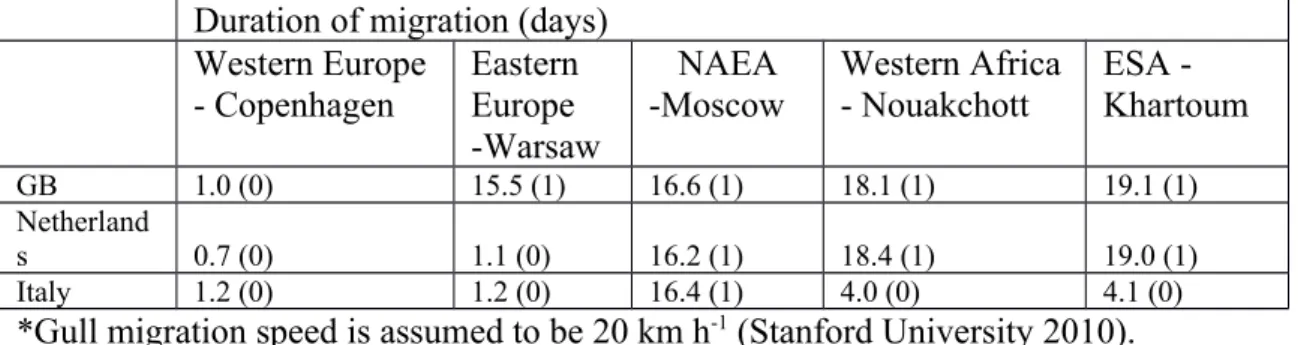
Table 4: Estimated durations of migration for *duck, goose and swan species migrating from different regions of the world to GB, the Netherlands and Italy (assuming flight speed of 40 km h-1 and 13.75 days per stopover). Assumed
numbers of stopovers are given in parentheses. Duration of migration (days)
Western Europe - Copenhagen
Eastern Europe -Warsaw
NAEA -Moscow
Western Africa - Nouakchott
ESA - Khartoum
GB 1.0 (0) 15.5 (1) 16.6 (1) 18.1 (1) 19.1 (1)
Netherlands 0.7 (0) 1.1 (0) 16.2 (1) 18.4 (1) 19.0 (1)
Italy 1.2 (0) 1.2 (0) 16.4 (1) 4.0 (0) 4.1 (0)
Matrix used to combine probabilities in estimation of prelease_indiv.
Neg Very low Low Medium High Very high
Neg Neg Neg Neg Neg Neg Neg
Very low Neg Neg Neg Very low Very low Very low
Low Neg Neg Very low Low Low Low
Medium Neg Very low Low Medium Medium Medium
High Neg Very low Low Medium High High
Table 5: Predicted probability of release (prelease_indiv) of H5N1 per individual bird per year into GB, the Netherlands and Italy. Species/region combinations which
are represented by negligible numbers of birds are omitted
*Region of origin W/E E/E NAEA WA ESA
Bird species GB NL It GB NL It GB NL It GB NL It GB NL It
Bewick’s swan VL VL N L N N
Whooper swan VL VL N L N N
Mute swan VL VL VL N L L
Greater white-fronted goose VL VL VL VL L L VL VL
Greylag goose VL VL VL L
Red-breasted goose VL VL VL
Eurasian wigeon VL VL VL VL L L VL VL VL VL VL L
Common teal VL VL VL VL L L VL VL VL VL VL L
Mallard VL VL VL VL L L VL VL VL VL L
Northern pintail VL VL VL VL L L VL VL VL VL VL L VL VL L
Garganey VL VL VL VL L L VL VL VL VL VL L VL VL L
Northern shoveler VL VL VL VL L L VL VL VL VL VL L
Common pochard VL VL VL VL L L VL VL VL VL VL L
Tufted duck VL VL VL N L L VL
Black-headed gull VL VL VL VL L L VL VL VL VL L
*W/E Western Europe, E/E Eastern Europe, NAEA North Asia and Eurasia, WA Western Africa, ESA Eastern and Southern Africa. Negligible numbers of birds from Middle East, South East Asia, North America, South America and Oceania.
Table 6: Predicted probability of release (prelease) of H5N1 into GB, the Netherlands and Italy at least once per year for 15 species of water bird from 10 regions.
Negligible probabilities omitted.
*Region of origin W/E E/E NAEA WA ESA
Bird species GB NL It GB NL It GB NL It GB NL It GB NL It
Bewick’s swan L L M
Whooper swan L L L
Mute swan M L VL L M
Greater white-fronted goose VL H L VL H M VL M
Greylag goose VL H L M
Red-breasted goose VL VL VL
Eurasian wigeon H H M M H H M H M L L M
Common teal H M M L M M L L L L VL L
Mallard M H H L M M L M M VL M
Northern pintail M M L L M M L L L L L M VL VL M
Garganey VL VL VL VL L L VL VL VL VL VL L VL VL L
Northern shoveler L L M VL M M L L L VL VL M
Common pochard L M M L M M L M M VL VL L
Tufted duck M H L H M VL
Black-headed gull H H H L H H L L L L M
*W/E Western Europe, E/E Eastern Europe, NAEA North Asia and Eurasia, WA Western Africa, ESA Eastern and Southern Africa. Negligible probabilities for birds from Middle East, South East Asia, North America, South America and Oceania.
Figures
Figure 1: Pathway used to estimate probability of release of H5N1 into a European country from