© 2014, IJCSMC All Rights Reserved
790
International Journal of Computer Science and Mobile Computing
A Monthly Journal of Computer Science and Information Technology
ISSN 2320–088X
IJCSMC, Vol. 3, Issue. 6, June 2014, pg.790 – 795
RESEARCH ARTICLE
Implementation of WSN Based Air
Pollution Monitoring System using Data
Mining Technique
Ms. Snehal Sakarde
1, Mr. Manoj Choudhari
2, Mrs. Shweta Gode
31
Department of Computer Science and Engineering, Smt. BC College of Engineering, Nagpur, India 2
Department of Computer Science and Engineering, Smt. BC College of Engineering, Nagpur, India 3
Department of Computer Science and Engineering, Smt. BC College of Engineering, Nagpur, India 1
[email protected]; 2 [email protected]; 3 [email protected]
Abstract— In the Industrial environment there are various technical parameters which have to be maintained. If it is not maintained in the range then it will lead a large catastrophe. So, we need to maintain the climate. There is some parameter which is important like temperature, humidity, air flow etc. But, due to huge variation in the environment these parameters are vary continuously. If we analyse the variation we need to discover the meaning full data which will help us to generate the pattern and rule. There is large quantity of data received from sensor and stored in server. So, the data mining technique need to apply to get meaning full data and rule.
Keywords— Data mining, clustering: Hierarchical Clustering Algorithm, K- means Clustering Algorithm
I. INTRODUCTION
Ambient Intellectualization is a vision where environment becomes intelligent, friendly, context-aware and responsive to any type of human requirements. In such a world, networking and computing technology coexist with people in a universal, friendly and pervasive way. Numerous miniature and interconnected intelligent devices create a new intelligence and interact with each other seamlessly.
In the industries, we know that there is much hardware equipment which is working in a proper environment. If the environment is not proper then there might be possible to lead causing important damages or in worth case human deaths. Temperature as well as humidity, air flow these are some important environment parameter which is needed monitoring and controlling time to time.
In the context of the industrial applications, the scope of this paper covers industrial processes such as pulp & paper, and petrochemical operations, with applications geared mainly towards process monitoring and control, process parameter value inference, detection of abnormal situation and their diagnostic and a general improvement of the process understanding through discovery of correlations between processes monitor [3-7].
© 2014, IJCSMC All Rights Reserved
791
mining this paper studied some algorithm for proposed applications for finding out the good one algorithm to get desired result and improve the performance of the applications.
In the WSN based intellectual climate system we are collecting the technical data from different nodes which are distributed in the different locations. The data collecting from different nodes are varied continuously whether it is temperature data or humidity data or anything else, some data which is useless but we need use full data from coming data from different nodes then we have to apply the data mining technique to get appropriate data or for generating the patterns meaningful data can be discovered or making some rules to maintain the climate for industries. In this paper use ZigBee protocol for transmission and receiving the data from different nodes. The most research work is to monitoring the application and the task is to implement the algorithms for different modules for collecting and monitoring the huge amount of data [15-16].
II. LITERATURE REVIEW
Many air pollution systems in various areas we reported in recent literatures. Many air pollution systems in various areas were In 2011, Wenhu Wang, Yifeng Yuan, Zhihao Lingetal [11]. in order to comply with requirements of oil and gas industry, an air quality monitoring system was proposed based on ZigBee wireless sensing technology. It uses ZigBee wireless network to send results to the monitoring center so that, if some abnormal situations happens, a quick warning will be generated to remind staff to take effective measures to prevent major accidents and protect human lives in industry.
In 2011, Dan Stefan Tudose, Traian Alexandru Patrascu, Andrei Voinescu, Razvan Tataroiu, Nicolae Tapus [9]. proposed an environmental air pollution monitoring system that measures CO2, NO2, CO, HC & NH4 concentration using mobile sensors in urban environment. The acquired information about air pollution in surroundings is then stored on central on-line repository system periodically. It uses a wireless GSM modem connection for transferring data to a central computer. Also, the application can share the data publicly by displaying it on a dedicated web site.
Some of the above mentioned air pollution and quality monitoring systems based on sensors that reports pollutants levels are already exist and these are publicly available. But these systems are not mobile systems and perform measurements at fixed locations. Thus they do not cover the entire area of a city. Some of these systems uses wired modem, router, or short range wireless access point to transfer data to pollutant server resulting in bulky and costly systems.
III. DATA MINING TECHNIQUES
Data mining has been defined [15] as ―the nontrivial extraction of implicit, previously unknown, and potentially useful information from data‖. It employs various computer techniques such as supervised or unsupervised learning algorithm techniques, in order to automatically search large data and derive patterns that can be used for either predictive (classification/regression) or descriptive tasks (clustering, association rule mining, etc.). Data mining can be performed on data represented in quantitative, textual, or multimedia forms [5]. Data mining applications can use a variety of parameters to examine the data. They may include various association patterns where one event is connected to another event, such as purchasing a tooth paste and purchasing tooth brush, sequence or path analysis (patterns where one event leads to another event, such as coming of festive sessions and purchasing of cloths), classification (identification of new patterns), forecasting (discovering patterns from which one can make reasonable predictions regarding future activities), and clustering (finding and visually documenting groups of previously unknown facts).
IV. AIR POLLUTION MONITORING
Air pollution leads to instability, harmful and undesirable effects in the environment [8]. With the rapid growth of industrialization, environmental pollution has become a large area of concern. The primary pollutants are:
Carbon Monoxide (CO): Carbon monoxide is a very poisonous gas. It is produced by incomplete combustion of fuel such as coal or wood, natural gas [8]. Vehicular exhaust is one of the primary sources of carbon monoxide. Road vehicles produce 91% of all CO emissions. When inhaled it can reduce the oxygen carrying capacity of one„s blood and can cause headache or fatigue.
© 2014, IJCSMC All Rights Reserved
792
Sulfur Oxides (SOx): Especially Sulfur dioxide (SO2) which is produced in various industrial processes. The oxidation of SO2 in the presence of catalysts like NO2 forms H2SO4, which is acid rain and causes damage to environment [8].
For the control of the air pollution in the environment it needs continuous monitoring of the quantity of gases present in the environment. This helps government officials, tourist and insurance companies, international organizations, and individuals to access the pollution data.
V. K-MEANS CLUSTERING ALGORITHM
In 2012, Abhay Kumar, Ramnish Sinha [17] proposed K- means algorithm in which predicting the likely behavior from observed behavior would be entirely legitimate if the relations hip were found in the data. The most common data mining techniques for finding hidden patterns in data are clustering and classification analysis.
K-Means Clustering Algorithm is a data mining or machine learning algorithm used to cluster observations into related observations groups without any proper knowledge of those relationships. The K-Means Algorithm is one of the easies t and very important clustering techniques which are commonly used in changing field.
The K-means approach to clustering s tarts out with a fixed number of clusters and allocates all records into exactly the number of clusters. Another class of methods works by agglomeration. This method start out with each data point forming its own cluster and gradually merge them into larger and larger clusters until all points have been gathered together into big cluster.
The main Moto behind the data analysis is to discover the meaningful data. The procedure follows a simple and easy way to classify a given data set through a certain number of clusters. The main idea is to define k centers, one for each point belonging to available data set associate to nearer center. When no point is pending, the first step is completed and an early group age is done. At this point we need to re-compute k new centroids as barycenter of the clusters resulting from the previous step. After getting these new centroids, A new data is to be done between the same data set points and the nearest new center. We notice the generated loop that the k center change their location step by step until no more changes are done or in other words centers do not move any more. Overall this algorithm aims at minimizing an objective function knows as squared error function given by:
J (v) =
„Ci‟ is the number of data points in it cluster. „C‟ is the number of cluster centers.
Let X={x1,x2,x3,……,xn} be the set of data points and N={v1,v2,…………,vc} be the set of centers. Randomly select „c‟ cluster centers.
Compute the spaces between each data point and cluster centers.
Assign the data point to the center of the cluster whose distance from the center of the cluster is minimum of all the cluster centers.
Re-compute the new center of the cluster using: i= (1/Ci)
Where „Ci‟ represents the number of data points in ith cluster.
Recomputed the distance between each data point and new obtained cluster centers. If no data point was elevated then stop, otherwise repeat from step 3.
© 2014, IJCSMC All Rights Reserved
793
Fig.1Flowchart for K-Means Algorithm Process
Advantages of K-Means Algorithm:
It is relatively Efficient, Fast, Robust and easy to understand.
When data set are distinct or well separated from each other then it will produce best result.
K-Means may produce strongest clusters than hierarchical clustering especially if the clusters are globular.
VI. SYSTEM ARCHITECTURE AND NETWORK MODEL
The proposed Control System (CS) consists of WSN based intellectual climate system module and decision making module. WSN based intellectual climate monitoring
System [1-2] collects a large number of packet records using the rule base technique. Decision making module is used to discover the knowledge base data for generating patterns and rule.
© 2014, IJCSMC All Rights Reserved
794
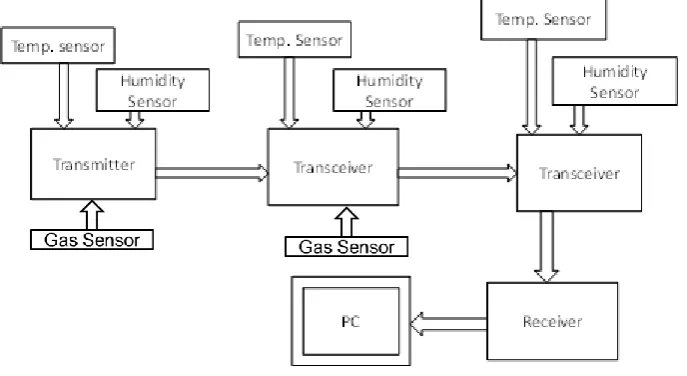
Here, the new climate monitoring system is proposed in which we used one transmitter, two transceiver and one receiver and server. Transmitter and transceiver consist of temperature sensor and humidity sensor. With the help of transmitter temperature T1 and humidity H1 send to transceiver then transceiver1 received the data of transmitter at the same time take some time to forward the signal to next node. For time being transmission is stopped. Then sense the environmental data of it. So, transceiver has four parameter T1, H1, G1, T2, H2 and it forward to next transceiver which is also sense two more parameter. Now transceiver has six parameter that is T1, H1, G1, T2, H2,and the same procedure followed like previous one but only it transfer to receiver. After collecting the whole data on receiver it forward to Server with the help of MAX 232. On serial port data collect through hyper terminal and then we capture the data continuously; it is huge amount of data whatever the variation occurs second by second it reflected on server.
VII. RESULT ANALYSIS
A. Online data collection on Matlab
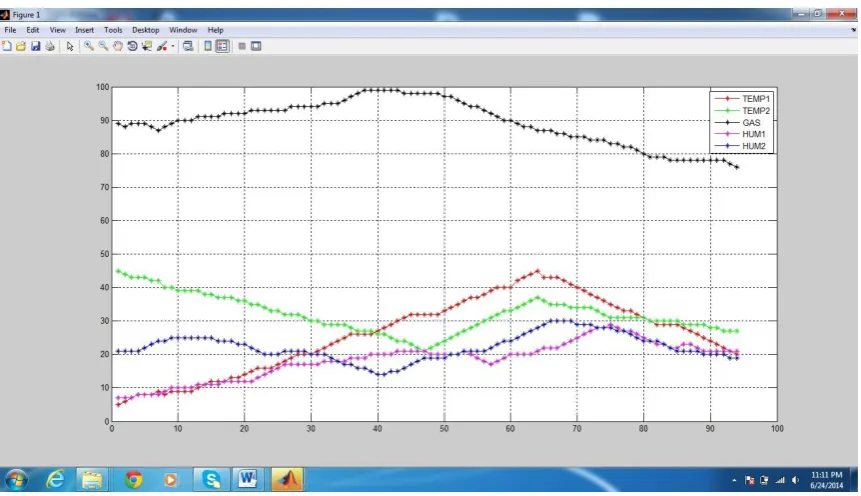
Fig 3. shows the online data collection on MatLab and at the same time data automatically plotted in the graph which represents temperature in degree with respect to time. The six parameter in which temperature T1, T2, Gas and humidity H1, H2, are collecting on MatLab.
Fig 3 Sample Trace file of WSN network
Fig 4 Clusters formation of temperature, humidity and Gas
Above figure4 shows the data which is online data collect through the receiver on server and at the same time plotting of each parameter on MatLab. All the data from different node received from different location with the help of transmitter and transceiver and we saw the huge amount of variation time by time. The parameters we taken as temperature as well as humidity and it will show symbolically on the graph. The square symbol shows in Five color is temperature and the circular symbol shows the humidity of different location.
© 2014, IJCSMC All Rights Reserved
795
through the hyper terminal. Clusters formation of temperature, Gas and humidity which is taken from different location of the manufacturing unit. There are various heat generated equipments used. So, the environment of the industries is continuously changed in the form of temperature and humidity we need to find out the range of the temperature and humidity and checked how many time temperature goes down and how much time it goes up.
REFERENCES
[1] Y. Ma, M. Richards, M. Ghanem, Y. Guo and J. Hassard, “Air Pollution Monitoring and Mining Based on Sensor Grid
in London”, Sensors 2008, Vol. 8(6), 3601-3623.
[2] G. Hassard , M. Ghanem , Y. Guo , J. Hassard , M. Osmond , and M. Richards, “Sensor Grids For Air Pollution
Monitoring”, in the Proceedings of 3rd UK e-Science All Hands Meeting, 2004.
[3] Cristophe Couvreur, “The EM Algorithm: A Guided Tour”, 1996
[4] M. Popa, A. S. Popa, et al,” Remote Temperature Monitoring and Regulating System for Indoor Locations”, 2009. [5] H. Karl and A. Willig, Protocols and Architectures for Wireless Sensor Networks, John Wiley and Sons Ltd, The
Atrium, Southern Gate, Chichester, West Sussex, England, 2005.
[6] D. Culler, D. Estrin, and M. Srivastava, “Overview of Sensor Networks”, IEEE Computer, August 2004.
[7] K. Martinez, J. K. Hart, and R. Ong, “Environmental sensor networks”, IEEE Computer Journal,Vol. 37 (8), 50-56,
August 2004.
[8] Amnesh Goel, Sukanya Ray, Prateek Agrawal, Nidhi Chandra, ―Air Pollution Detection Based On Head Selection
Clustering and Average Method from Wireless Sensor Network‖, 2012 Second International Conference on Advanced Computing & Communication Technologies, pp. 434-438, Jan. 2012
[9] Dan Stefan Tudose, Traian Alexandru Patrascu,Anderi Vionescu, Razvan Tataroiu, Nicolae Tapus, “MobileSensors in
Air pollution Measurement” 2011 8th Workshop on Positioning Navigation and Comm., pp. 166-170 Apr.2011.
[10] Parna Khot, Ashok K. Krishnamurthy et al,” A Parallel Data Mining Toolbox Using MatlabMPI”, 2006.
[11] Wenhu Wang, Yifeng Yuan, Zhihao Ling, “The Research and Implement of Air Quality Monitoring System Based on
ZIGbee”, 2011 7th International Conference on Wireless Communication Networking and Mobilr Computing pp.1-4, Sept. 2011.
[12] Li Wang, “Application of Data Warehouse Technology in Digital Mine Information System”, 2011
[13] J.A. Ferre, A. Pawlowski, et al,” A Wireless Sensor Network for Greenhouse Climate Monitoring”, 2010
[14] Hero Modares, Rosli Salleh, et al, “Overview of security issues in wireless sensor networks”, 2011.
[15] Fani A. Tzima, Kostas D. Karatzas, Pericles A. Mitkas, Stavros Karathanasis, ―Using data-mining techniques for PM10 forecasting in the metropolitan area of Thessaloniki, Greece‖, Proceedings of International Joint Conference on Neural Networks, pp. 2752-2757, Aug. 2007
[16] Manish Verma, Mauly Srivastava, et al. “A comparative study of various Clustering Algorithms in data mining”,
IJERA, Vol. 2,Issue 3,May-Jun 2012.