Available Online atwww.ijcsmc.com
International Journal of Computer Science and Mobile Computing
A Monthly Journal of Computer Science and Information Technology
ISSN 2320–088X
IJCSMC, Vol. 5, Issue. 1, January 2016, pg.254 – 260
A New Method to Calculate an Irregular Area
of a Lake using Image Processing Techniques
Dr. Taleb Obaid
1, Dr. Abbas H. Hassin Alasadi
2, Mr. Moslem K. Mohsen
11 Dept. of Computer Information Systems, College of Information Technology, University of Basra, Basra, Iraq 2 Dept. of Computer Science, College of Science, University of Basra, Basra, Iraq
[email protected], [email protected], [email protected]
Abstract— Monte Carlo methods are a class of computational algorithms that rely on repeated random
sampling to compute their results. These methods implemented in varsity application, which is used for solving certain stochastic or deterministic problems. In practical application it is crucial to calculate the surface area for environmental objects such as lakes, Islands, and Oil slick. In this work we focus on computing the surface area for different shapes of lakes.
Suppose we have an irregular region whose area can't be calculated with convectional mathematical methods. Such regions might be approximated using a Monte Carlo simulation. The idea behinds Monte Carlo simulation is to surround the irregular shape (lake) by a regular shape such as rectangle, triangle, or circle. The areas of these regular shapes are easily to be calculated.
We started to shoot randomly K points (darts) in a surrounded regular area. Let N represents the number of points that ended up in the irregular region (lake); such that K ≤ N. We could estimate the lake area using the following formula:
Lake
Area
=
(K /
N)
*
Area
Surrounded
The suggested proposal calculates any irregular shapes using an image processing techniques have been implemented using clusters algorithm. The simulated results have been compared with the regular shapes beside other available studies. The results appeared quite satisfactory results.
Keyword- Monte Carlo Simulation, Image Processing, cluster algorithm
I. INTRODUCTION
Nowadays, Monte Carlo methods are widely used to solve complex physical and mathematical problems particularly those involving multiple independent variables where more conventional numerical methods would demand challenging amounts of memory and computer time. Its core idea is to use random samples of parameters or inputs to explore the behavior of a complex system or process. Because of their reliance on repeated computation of random or pseudo-random numbers, these methods are most suited to calculation by a computer and tend to be used when it is unfeasible or impossible to compute an exact result with a deterministic algorithm, see [1-3].
Calculating the size, or area, of a lake can be done in a couple of different ways. You can estimate the surface area (lake size) by treating the lake as a the closest geometric figure, such as a circle, rectangle or triangle, or you can try to directly count the square footage of the lake by using graph paper on a scaled area map. The latter method may be more precise and represent the only method when a lake doesn't practically fit any basic shape, for more details see [5, 6].
Our proposal concentrates on the image processing technique that can be collected all the unified color spots of interested area. Clustering technique may be used. The cluster analysis or clustering is the task of grouping a set of objects in such a way that objects in the same group (called a cluster) are more similar (in some sense or another) to each other than to those in other groups (clusters). There are a countless number of examples in which clustering plays an important role [6].
The method may be implemented to measure any colored area such as house, garden, and swimming pool on any shape of the image using Google Maps. A rough estimate to the surface area of the interest objects could be easily founded [7, 8].
II. MONTE CARLO SIMULATION
Monte Carlo simulation is a versatile method for analyzing the behavior of some activity, plan or process that involves uncertainty. If you face a problem with uncertain or variable factors you can benefit from using Monte Carlo simulation in order to understand the impact of uncertainty, and develop plans to mitigate or otherwise cope with risk; for details see [2, 3]. Monte Carlo technique used of integration of a function by using sequences of random numbers. That is, Monte Carlo integration methods are algorithms for the approximate evaluation of definite integrals, usually multidimensional ones.
We implemented this technique in present work to approximate the surface area of an irregular shape such as a lake; as the following:
Step 1: we define a domain of inputs: surround the irregular region by a regular shape such as rectangle, triangle, or circle. So, the suitable shapes that will circumscribe the interested irregular shape (lake).
Step 2: we randomly generate scatter individual point's location within the shape.
Step 3: perform a computation on each input and test whether it falls within the irregular shape or not. Step 4: At the end, we aggregate the results into our final result, the approximation of the irregular shape area.
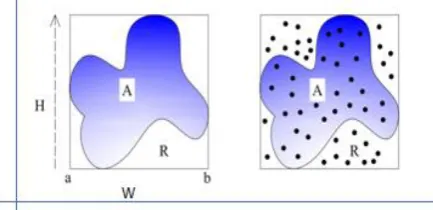
Let us consider a colored image of an irregular shape (lake) as shown in the Figure (1). The colored area A
is surrounded by a white rectangle R. The idea is to shoot randomly N dart (cannonball) in a square with a known area (H×W), where H is the image height, W (= b - a) represent the width of the image. Let K represents the number of darts that ended up in the lake. In this work, we consider that we sent one dart in each pixel, so.
Lake Area R … (1)
Where K represents the number of colored pixels, N is the total pixels of the image, R the size of the image.
Figure (1): Irregular area (A), surrounded by rectangular area (R)
III. SCANNED IMAGE ANALYSIS
Predicting the area of the scanned image may pose a challenge unless you take note of a scanning parameter called DPI or PPI (dots or pixels per inch) that is often referred to as the scanner resolution. This parameter determines how much detail from the original image is stored in the scanned, digital image. The higher the DPI value, the larger and more detailed the scanned image will be, for more details see [9, 10].
1. Use a ruler to measure the physical dimensions (width and height), in inches, of the original image on the paper.
2. Read the DPI or PPI resolution setting for the scanner from the scanner console or scanner properties window in your image scanner software. Note that some scanner software may use the word "resolution" instead of DPI or PPI to refer to the scanner resolution.
3. Multiply the physical dimensions by the scanner resolution to obtain the digital dimensions in pixels. For example, a physical 8.5-by-11-inch image scanned at a resolution of 300 DPI or PPI would produce a digital image 2550 pixels by 3300 pixels.
4. Multiply the width in pixels by the height in pixels to obtain the area of the digital image. For example, an 8.5-by-11-inch image scanned at 300 PPI would produce a 2550 pixels x 3300 pixels image, which covers an area of 8,415,000, or 8.4 mega square pixels.
According to the assumptions above, the proposed algorithm will be as follows:
IV. RESULTS AND DISCUSSION
Visual Basic program have been designed for input / output interfacing as shown in Figure (2). For computing a surface area of a required lake an image file name may be entered in the textbox once click on the "Browse" tab. The interface application includes a quiet simple input textboxes that consist of three windows. The interface application contents many windows.
The first window enable us to loads the required image file name. This window includes some additional information such as "Number of Iteration" and "Number of Clusters". Output group controls include "Elapse Time" and "Total Points" textboxes and other control tab as "Exit" and "Clear Data" controls.
The second window shows the details of each cluster beside two control tabs as "Calculate Area" and "Clear Data". Once click "Calculate Area" the number of points (pixels) for each cluster will appear in third window entitle "The Number of Pixel in each Cluster".
Input:
1. Read an image and convert into matrix. 2. Input Threshold (T)
Output: Area of the lake
Algorithm:
1. Extract the RGB values from each pixel and save it into a new matrix
2. Compute the size of new matrix
In order to be quiet satisfactory of the output results, we already loaded many images files of different lakes to calculate the surface area of those lakes. The result shown all information concerned each lake such as the number of pixels for each cluster that represent specific segments of the image. However, the area may be calculated using Eqn. (1).
We tested our proposal with the familiar examples such as calculating the area of a circle surrounded by a square. Figure (3), shows a circle with radius r = 1 inscribed within a square. The area of the circle is r2 = 12 = , and the area of the square is 22 = 4. The ratio () of the area of the circle to the area of the square is
Our proposal gives 3224 pixels of the colored region (circle) and 4090 pixels of the total image (rectangle 64 x 64), so, the ratio () of the areas is
=
Our second comparison the green portions of Wachovia Bank Logo [11], to its entire area as given in Figure (4). Paul Hale was computed the green portion using the mathematical computations and the approximated result was 1:7.89, so, the area will be calculated according equation 1, as:
=
Our proposal gives 490 pixels of the green region and 4096 pixels of the entire image, so the area will be as: =
The result are in good agreements for both above examples so, the differences between the mathematical solution and our proposal are 0.171% and 1.2% , respectively.
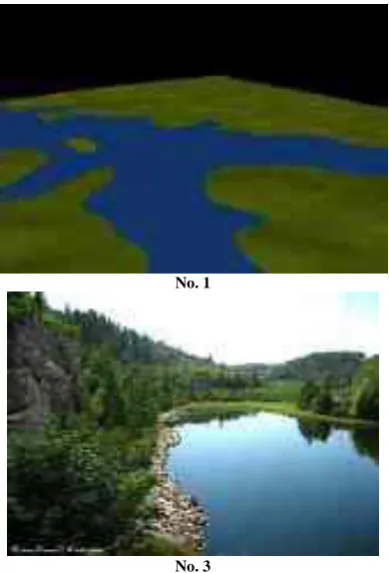
According to the suggested proposal, we selected four lake samples for performing our calculations for the images given in Figure (5). The results of the algorithm with threshold = 64 is shown in Table (1). Table (2) shows the result of the algorithm with threshold = 128.
From Table (1) and Table (2), we can see the effect of threshold value on the result of calculating the blue color of a given lake. In Table (1) we used threshold = 64, therefore the number of blue color was a little bit large according of each image. This is because of the nature and the color depth of a given image. Image No.2 has (66992) pixels as a total number of pixels and (38332) pixels of blue color. Let us take a look to image No. 2, we can see the blue color gradates from the sky to the lake. So, there is no guarantee to calculate the exact number of blue color which belongs to the lake boundary. To solve this problem we need enlarge the threshold value as shown in Table (2).
V. CONCLUSION
The surface area is one of the most important factors in many environmental application fields. Analysis to estimate lake volume, water surface area and perimeter as lake decreased during the summer because water volume is crucial to human being and the living creatures. To determine changes in water availability required to calculate the surface area of the lake besides the depth of the lake.
Figure (2): The Interface Application
No. 1
No. 3
No. 2
No. 4
Figure (5): Selected Samples
TABLE (1)
RESULTS OF SUGGESTED ALGORITHM (THRESHOLD=64).
Image
# Image fmt
Image size #
Pixels DPI
Area of Image /inch2
# Blue
Area of Blue /inch2
% Blue/Image Width Height Width Height Area
No.1 JPG 160 120 19200 96 1.667 1.250 2.084 4484 0.4865 23.3445 No.2 BMP 316 212 66992 108 2.926 1.963 5.744 38332 3.2864 57.2188 No.3 JPG 162 122 19764 96 1.687 1.271 2.144 7719 0.8376 39.0559 No.4 TIFF 300 200 60000 96 3.125 2.083 6.509 39614 4.2984 66.0233
TABLE (2)
RESULTS OF SUGGESTED ALGORITHM (THRESHOLD=128).
Image #
Image fmt
Image size #
Pixels DPI
Area of Image /inch2 # Blue
Area of Blue/ inch2
% Blue/Image Width Height Width Height Area
No.1 JPG 160 120 19200 96 1.667 1.250 2.084 310 0.0336 0.1823
No.2 BMP 316 212 66992 108 2.926 1.963 5.744 28777 2.4672 42.9558
No.3 JPG 162 122 19764 96 1.687 1.271 2.144 5052 0.5482 25.5690
REFERENCES
[1] Bank, J., Carson, J., Nelson, B., and Nicol D. “Discrete-Event System Simulation”, Prentice Hall, 2005. [2] Law, A. M. and Kelton, W. D. “Simulation Modeling and Analysis”, New York, McGraw-Hill, 2000. [3] Raychaudhuri, Samik. "Introduction to Monte Carlo simulation." In Simulation Conference, 2008. WSC
2008. Winter, pp. 91-100. IEEE, 2008.
[4] K.A.Ahmed, R.G. Thanoon, A.R. Abdurrahman, "Observing the rising and falling of water level in Mosul Dam Lake using remote sensing data and Geographical Information System", Al-Rafidain Engineering Vol.20 No. 4 August 2012
[5] Crowder C.D., “How To Calculate The Area of an Irregular Shape”, July 28, 2010, ehow Contributor. [6] Wang H. and Suter D., “Color Image Segmentation Using Global Information and Local Homogeneity”.
Proc. VIIth Digital Image Computing: Techniques and Applications, Sun C., Talbot H., Ourselin S. and Adriaansen T. (Eds.), 10-12 Dec. 2003, Sydney.
[7] Lanclos J. “How to Measure Area With Google Maps” , eHow Contributor
[8] Abu-Faraj, M. and Ghatasheh, N. "Using Image Processing Functions to Determine the Edges of the Dead Sea and Calculate the Declining Rate", IJCSI International Journal of Computer Science Issues, Vol. 10, Issue 6, No 2, November 2013.
[9] Ian T., Jan J. and Lucas J. , " Fundamentals of Image Processing ", Printed in The Netherlands at the Delft University of Technology, 1998.
[10] Wetzel, R.G. and G.E. Likens. Limnological Analyses. 2000. Springer-Verlag, New York.