GRID CONNECTED PV-FC HYBRID SYSTEM AND
POWER MANAGEMENT CONTROL
A . Chanikyachandra Gupta, S. H. Suresh Kumar, Dhananjaya. M
1
P.G.Student,
2,3Asst.Prof, Dept.of EEE GITAS, BOBBILI, VZM (India)
ABSTRACT
This paper presents a method to operate a grid connected hybrid system. The hybrid system composed of a Photovoltaic (PV) array and a Proton exchange membrane fuel cell (PEMFC) is considered. Two operation modes, the unit-power control (UPC) mode and the feeder-flow control (FFC) mode, can be applied to the hybrid system. In the UPC mode, variations of load demand are compensated by the main grid because the hybrid source output is regulated to reference power. Renewable energy is currently widely used. One of these resources is solar energy. The photovoltaic (PV) array normally uses a maximum power point tracking (MPPT) technique to continuously deliver the highest power to the load when there are variations in irradiation and temperature. The disadvantage of PV energy is that the PV output power depends on weather conditions and cell temperature, making it an uncontrollable source. Furthermore, it is not available during the night In the FFC mode, the feeder flow is regulated to a constant, the extra load demand is picked up by the hybrid source, and, hence, the feeder reference power must be known. he system can maximize the generated power when load is heavy and minimizes the load shedding area. When load is light, the UPC mode is selected and, thus, the hybrid source works more stably. The changes in operating mode only occur when the load demand is at the boundary of mode change; otherwise, the operating mode is either UPC mode or FFC mode. Besides, the variation of hybrid source reference power is eliminated by means of hysteresis. The proposed operating strategy with a flexible operation mode change always operates the PV array at maximum output power and the PEMFC in its high efficiency performance band, thus improving the performance of system operation, enhancing system stability, and decreasing the number of operating mode changes.in the MATLAB simulink environment.
I
ndex Terms
:
Micro Grid, Grid-Tied Mode, Coordination Control Operations, PV System, Fuel
Cell Power Generation.
I INTRODUCTION
power, the hybrid source output becomes controllable. However, PEMFC [6], in its turn, works only at a high
efficiency within a specific power rangePFCLow PFCup .
The hybrid system can either be connected to the main grid or work autonomously with respect to the grid-connected mode or islanded mode, respectively. In the grid-grid-connected mode, the hybrid source is grid-connected to the main grid at the point of common coupling (PCC) to deliver power to the load. When load demand changes, the power supplied by the main grid and hybrid system must be properly changed.
The power delivered from the main grid and PV array as well as PEMFC must be coordinated to meet load demand. The hybrid source has two control modes: 1) unit-power control (UPC) mode and feeder-flow control (FFC) mode. In the UPC mode, variations of load demand are compensated by the main grid because the hybrid source output is regulated to reference power. Therefore, the reference value of the hybrid source output
f MS
P Re must be determined. In the FFC mode, the feeder flow is regulated to a constant, the extra load demand
is picked up by the hybrid source, and,[16-17] hence, the feeder reference power PFeeder Re f must be known. The proposed operating strategy is to coordinate the two control modes and determine the reference values of the UPC mode and FFC mode so that all constraints are satisfied. This operating strategy will minimize the number of operating mode changes, improve performance of the system operation, and enhance system stability.
II
GRID
OPERATION
Wherever the basic main diagram of a AC/DC micro grid shows it will consists two renewable energy sources one is P.V the output of P.V array is connected to the boost converter[3].
Fig.1. Block Diagram of Micro Grid
renewable energy device is wind generation with DFIG is connecting to ac sources through A.C bus. Three phase bidirectional DC/AC main converter wit R-L-C connected between DC bus and AC bus[7].
The hybrid grid can operate in two modes One is grid-tied mode and isolated mode the present work is did in grid-tied mode The boost converter and WTG are controlled to provide the maximum power. the main converter is to provide stable dc bus voltage and required reactive power and to exchange power between the ac and dc buses. When the output power of the dc sources is greater than the dc loads, the converter acts as an inverter and injects power from dc to ac side. When the total power generation is less than the total load at the dc side, the converter injects power from the ac to dc side. When the total power generation is greater than the total load in the hybrid grid, it will inject power to the utility grid.
III
MODELLING
OF
P.V
SYSTEM
Generally, a PV module comprises of a number of PV cells connected in either series or parallel the classical equation of a PV cell describes the relationship between current and voltage of the cell (neglecting the current in
the shunt resistance of the equivalent circuit of the cell) as
Fig.2. Equivalent circuit of PV cell
exp 1
A I R V I I
Iph L O ph se ph
exp 1
s o rs p ph p O n V K I n I n I
Where Io denotes the PV array output current, V is the PV output voltage, is the cell photocurrent that is proportional to solar irradiation, is the cells reverse saturation current that mainly depends on the temperature, is a constant, n and are the numbers of series strings and parallel strings in the PV array, respectively.
3.1 MPPT (P&O method)
Fig.3. Flow chart for MPPT algorithm.
3.2 Dynamic Modeling of Boost Converter
The main objective of the boost converter is to track the maximum power point of the PV array by regulating the solar panel terminal voltage using the power voltage characteristic curve.
Fig.4. Boost Converter
0 )
1
( 1
1
D V ESRi
dt di L
Vin C
iD1 iC1 iL1
in
IV. MODELING OF BATTERY
Battery acts as a constant voltage load line on the PV array and is charged both by PV array and induction generator .the battery is modeled as a nonlinear voltage source whose output voltage depends not only[8-9] on the current but also on the battery state of charge(SOC), which is non linear function of the current and time :
V. FUEL CELL MODEL
PEM fuel cell electrochemical process starts on the anode side (Fig 1.) where H
2 molecules are brought by flow plate channels. Anode catalyst divides hydrogen on protons H+ that travel to cathode through membrane and electrons e- that travel to cathode over external electrical circuit. At the cathode hydrogen protons H+ and electrons e- combine with oxygen O
2 by use of catalyst, to form water H2O and heat. Described reactions can be expressed using equations:
) ( 2 2 2 1 ) ( 2 2 2 2 2 Cathode O H e H O Anode e O H H
Amount of chemical energy released in these reactions depends on hydrogen pressure, oxygen pressure and fuel cell temperature. Using change in Gibbs free energy, this amount can be expressed as:
)] ln( 5 . 0 )
[ln( PH 2 PO2
RT g
g f fc
o
g
where Δg0f is change in Gibbs free energy at standard pressure, R universal gas constant, T fc PEM temperature and pO2 and PH2 are gas pressures. Because electrical work done by fuel cell is equivalent to released chemical energy, value of open circuit fuel cell voltage E meets equation:
F E gf 2
where F is Faraday's constant.
To attain actual cell voltage (on electrical couplings) vfc, voltage drops caused by activation, concentration and ohmic losses have to be deducted from open circuit voltage (Fig 2).
Cathode and anode activation losses are result of breaking and forming electron-proton chemical bonds, and parasitic electrochemical reactions[11-13] caused from hydrogen proton migration through membrane at zero current. Their voltage drop was calculated using formula:
) 1 ( 1 0 i C a
act V V e
V
where activation voltage drop at zero current density v0 depends on fuel cell temperature, cathode pressure and water saturation pressure Va=f( Tfc, Pca, Psat)Voltage drop va inserts in (5) correlation with current density i and depends on fuel cell temperature, oxygen pressure and water saturation pressure Va=f(Tfc,Po2,Psat) and c1 is activation voltage constant.
i dt
A dt i Q Q K i R V V b b b b O
b exp
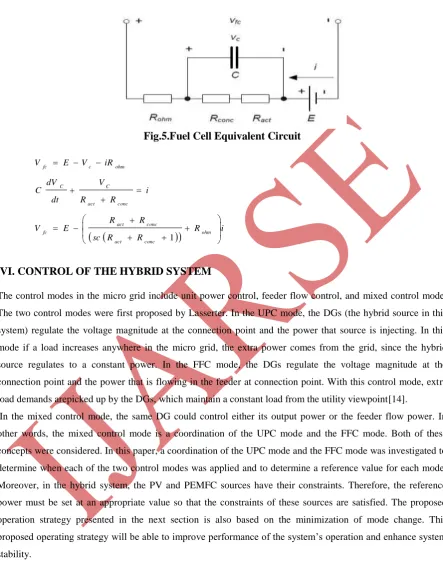
5.1 Fuel Cell Equivalent Electric Circuit
Fig.5.Fuel Cell Equivalent Circuit
sc R R
R iR R E V i R R V dt dV C iR V E V ohm conc act conc act fc conc act C C ohm c fc 1
VI. CONTROL OF THE HYBRID SYSTEM
The control modes in the micro grid include unit power control, feeder flow control, and mixed control mode. The two control modes were first proposed by Lasserter. In the UPC mode, the DGs (the hybrid source in this system) regulate the voltage magnitude at the connection point and the power that source is injecting. In this mode if a load increases anywhere in the micro grid, the extra power comes from the grid, since the hybrid source regulates to a constant power. In the FFC mode, the DGs regulate the voltage magnitude at the connection point and the power that is flowing in the feeder at connection point. With this control mode, extra load demands arepicked up by the DGs, which maintain a constant load from the utility viewpoint[14].
In the mixed control mode, the same DG could control either its output power or the feeder flow power. In other words, the mixed control mode is a coordination of the UPC mode and the FFC mode. Both of these concepts were considered. In this paper, a coordination of the UPC mode and the FFC mode was investigated to determine when each of the two control modes was applied and to determine a reference value for each mode. Moreover, in the hybrid system, the PV and PEMFC sources have their constraints. Therefore, the reference power must be set at an appropriate value so that the constraints of these sources are satisfied. The proposed operation strategy presented in the next section is also based on the minimization of mode change. This proposed operating strategy will be able to improve performance of the system’s operation and enhance system
stability.
6.1 Operating Strategy of the Hybrid System
output power and the constraints PFCLow ,PFCup andPFMAX are fulfilled. Once the constraints ( and ) are known, the control mode of the hybrid source (UPC mode and FFC mode) depends UPC mode[16], the reference output power of the hybrid source depends on the PV output and the constraints of the FC output. The
algorithm determining PMSRe f is presented in Subsection A and is depicted in Fig.
.
6.2 Operating Strategy for the Hybrid System in the UPC Mode
In this subsection, the presented algorithm determines the hybrid source works in the UPC mode. This algorithm allows the PV to work at its maximum power point, and the FC to work within its high efficiency band. In the
UPC mode, the hybrid source PMS Re f regulates the output to the reference value. ThenPPV PFC PMSRe f
Equation (11) shows that the variations of the PV output will be compensated for by the FC power and, thus, the total power will be regulated to the reference value.
However, the FC output must satisfy its constraints and, hence, PMS Re f must set at an appropriate value. Fig. 4 shows the operation strategy of the hybrid source in UPC mode to determine PMS Re f . The algorithm includes two areas: Area 1 and Area 2.
In Area 1, PPV is less than PPV1 , and then the reference Power PMS1Re f is set atPFCup where
UP FC f MS
LOW FC UP FC PV
P P
P P
P
Re 1 1
output will change from PFCup to PFCLow . As a result, the constraints for the FC output always reach Area 1. It is noted that the reference power of the hybrid source during the UPC mode is fixed at a constantPFCup . Area 2 is for the case in which PV output power is greater ThanPPV1 . As examined earlier, when the PV
output increases. To PPV1, the FC output will decrease to its lower limit PFCLow . If PV output keeps increasing, the FC output [17-18] will decrease below its limit PFCLow . In this case, to operate the PV at its maximum power point and the FC within its limit, the reference power must be increased. As depicted in Fig. 4,
if PV output is larger than PPV1 , the reference power will be increased by the amount of PMS , and we obtain
MS f
MS f
MS P P
P 2Re 1Re
Similarly, if PPV is greater than PPV2 , the FC output becomes less than its lower limit and the reference
power will be thus increased by the amount of PMS . In other words, the reference power remains unchanged
and equal to PMS2Re f if is less than PPV2 and greater than PPV1. where
MS PV
PV P P
P 2 1
it is noted thatPMS is limited so that with the new reference power, the FC output must be less than its upper
limit PFCup . Then, we have
LOW FC UP FC MS P P
P
In general, if the PV output is between PPVi andPPVi 1 , then we have PPVi PPVi1 PMS
MS f
MSi f
MSi P P
P Re 1Re
Equations (17) and (18) show the method of finding the reference power when the PV output is in Area 2. The
relationship between PMSi Re f and PPVi is obtained by using , and then
Min FC PVi f
MSi P P
P Re i=1,2.3
The determination of PMSRe fin Area 1 and Area 2 can be generalized by starting the index from 1. Therefore, if the PV output
PVi PV
PVi P P
P 1
Min FC PVi f
MSi P P
Then we have
PVi PV
PVi P P
P 1
MS PVi
PVi P P
P 1
In brief, the reference power of the hybrid source is determined according to the PV output power. If the PV
output is in Area 1, the reference power will always be constant and set atPFCup . Otherwise, the reference value will be changed by the amount of PMS , according to the change of PV power. The reference power of the hybrid source in Area 1 and Area 2 is determined by respectively. Fig. 5. shows the control algorithm diagram for determining the reference power automatically. The constant must satisfy (16). If increases the number of change of will decrease and thus the performance of system operation will be improved
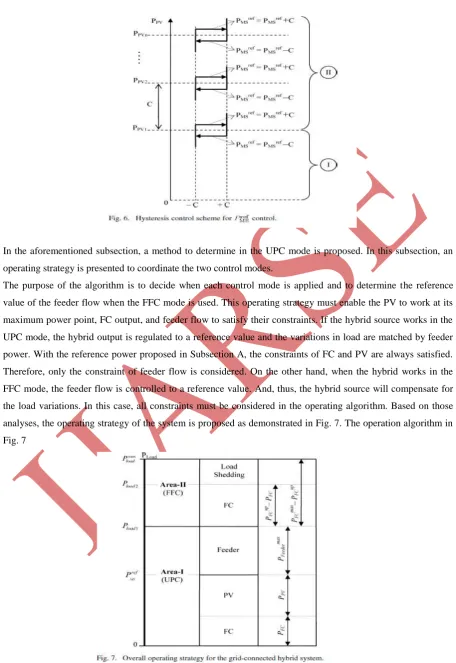
Fig.6.Control Alogatharam
.
However, C should be small enough so that the frequency does not change over its limits 5%). In order to improve the performance of the algorithm, a hysteresis is included in the simulation model. The hysteresis is used to prevent oscillation of the setting value of the hybrid system reference power . At the boundary of change in , the reference value will be changed continuously[19] due to the oscillations in PV maximum power tracking. To avoid the oscillations around the boundary, a hysteresis is included and its control scheme to control is depicted in Fig.6.
6.3 Overall Operating Strategy for the Grid-Connected Hybrid System
In the aforementioned subsection, a method to determine in the UPC mode is proposed. In this subsection, an operating strategy is presented to coordinate the two control modes.
The operation algorithm in Fig. 7 involves two areas (Area I and Area II) and the control mode depends on the load power. If load is in Area I, the UPC mode is selected. Otherwise, the FFC mode is applied with respect to Area II. In the UPC area, the hybrid source output.
If the load is lower than , the redundant power will be transmitted to the main grid. Otherwise, the main grid will send power to the load side to match load demand. When load increases, the feeder flow will increase correspondingly. If feeder flow increases to its maximum , then the feeder flow cannot meet load demand if the load keeps increasing. In order to compensate for the load demand, the control mode must be changed to FFC with respect to Area II. Thus, the boundary between Area I and Area II is
f MS Feeder Load P P
P 1 Re
When the mode changes to FFC, the feeder flow reference must be determined. In order for the system operation to be seamless, the feeder flow should be unchanged during control mode transition. Accordingly, when the feeder flow reference is set at , then we have
Max Feeder f
Feeder
P
P
Re
In the FFC area, the variation in load is matched by the hybrid source. In other words, the changes in load and PV output are compensated for by PEMFC power. If the FC output increases to its upper limit and the load is higher than the total generating power, then load shedding will occur. The limit that load shedding will be reached is
PV UP FC Max
Feeder
Load P P P
P 2
Equation shows that is minimal when PV output is at kW. PLoad 2Min PFeeder Max PFCUP
Equation means that if load demand is less than , load shedding will never occur.
From the beginning, FC has always worked in the high efficiency band and FC output has been less than . If the load is less than , load shedding is ensured not to occur. However, in severe conditions, FC should mobilize its availability, to supply the load. Thus, the load can be higher and the largest load is
Max
FC Max
Feeder Max
Load
P
P
P
If FC power and load demand satisfy, load shedding will never occur. Accordingly, based on load forecast, the installed power of FC can be determined by following to avoid load shedding. Corresponding to the FC installed power, the width of Area II is calculated as follows:
UP FC Max FC ii
Area P P
P
In order for the system to work more stably, the number of mode changes should be decreased. As seen in Fig. 7, the limit changing the mode from UPC to FFC is , which is calculated Equations shows that depends on
Max Feeder
P
and PMSRe f ,Max Feeder
P
is a constant. Thus depends on Fig. 4 shows that in Area-2PMS Re fdepends on . Therefore, to decrease the number of mode changes, PMS Re f changes must be reduced. Thus,
MS
P
MS
P
must satisfy condition and, thus, the minimized number of mode change is reached when PMS is
maximized
Low FC UP FC Max
MS P P
P
In summary, in a light-load condition, the hybrid source works in UPC mode, the hybrid source regulates output
power to the reference valuePMSRe f , and the main grid compensates for load variations. PMS Re f is determined by the algorithm shown in Fig. 4 and, thus, the PV always works at its maximum power point and the PEMFC always works within the high efficiency
band PFCLow PFCup. In heavy load conditions, the control mode changes to FFC, and the variation of load will be matched by the hybrid source. In this mode, PV still works with the MPPT control, and PEMFC operates within its efficiency band until load increases to a very high point. Hence, FC only works outside the high
efficiency band PFCLow PFCMax in severe conditions. With an installed power of FC and load demand satisfying , load shedding will not occur. Besides, to reduce the number of mode changes, must be increased and, hence, the number of mode changes is minimized when is maximized, as shown in . In addition, in order
for system operation to be seamless, the reference value of feeder flow must be set at PFeeder Max .
VII.SIMULATION RESULTS
Fig.8.shows the output voltage of PV array corresponding solar irradiation it will constant using P&O method. the voltage drop occur during the load and source condition .the boost controller quickly recovers this drop and gives constant voltage.
Fig.8. PV Output Voltage Fig.9. PV Output Current Waveform
Fig.10. PEM output voltage waveform PEM output current waveform
The fig shows the output voltage wave of boost converter in this voltage depends PV or Fuel cell. Under load and source change conduction in will control and to maintain constant voltage.
Fig.11. Output voltage waveform of Boost converter Fig.12. Output waveform Boost converter power
The fig shows the power generated from distribution generation. Different waveforms shows it will depends on line parameters.
Fig.15. Power generated from DG after islanding Fig,16. Output waveform voltage at Grid
Fig,16. Output waveform voltage at Feeder Fig,16. Output waveform of Feeder current
PARAMETERS FOR PHOTOVOLTAIC PANEL
symbol Description Value
q A k
S T
Rated open circuit voltage Electron charge
Ideality factor Boltzman constant
Series resistance of a PV cell Parallel resistance of a PV Short-circuit current
Reference temperature Energy of a band gap for silicon
Number of cells in parallel Number of cells in series Solar radiation level
Surface temperature of the PV
403
1.602× C
1.50
1.38× J/K
3.27A 301.18 K 1.1e V
VIII. CONCLUSION
This paper has presented an available method to operate a hybrid grid-connected system. The hybrid system, composed of a PV array and PEMFC, was considered. The operating strategy of the system is based on the UPC mode and FFC mode. The purposes of the proposed operating strategy presented in this paper are to determine the control mode, to minimize the number of mode changes, to operate PV at the maximum power point, and to operate the FC output in its high-efficiency performance band. With the proposed operating algorithm, the system works flexibly, exploiting maximum solar energy; PEMFC works within a high-efficiency band and, hence, improves the performance of the system’s operation. The system can maximize the generated power when load is heavy and minimizes the load shedding area. When load is light, the UPC mode is selected and, thus, the hybrid source works more stably. The changes in operating mode only occur when the load demand is
at the boundary of mode change PLoad 1; otherwise, the operating mode is either UPC mode or FFC mode.
Besides, the variation of hybrid source reference powerPMSRe f is eliminated by means of hysteresis. In addition, the number of mode changes is reduced. As a consequence, the system works more stably due to the minimization of mode changes and reference value variation.
REFERENCES
[1] R. H. Lasseter, “MicroGrids,” in Proc. IEEE Power Eng. Soc. Winter Meet., Jan. 2002, vol. 1, pp. 305–308. [2] S. A. Daniel and N. AmmasaiGounden, “A novel hybrid isolated generating system based on PV fed
inverter- assisted wind-driven induction generators,” IEEE Trans. Energy Conv., vol. 19, no. 2, pp. 416– 422, Jun. 2004
[3] C.Wang and M. H. Nehrir, “Power management of a stand-alone wind/photovoltaic/fuel cell energy system,” IEEE Trans. Energy Conv., vol.23, no. 3, pp. 957–967, Sep. 2008.
[4] F. Liu, S. Duan, F. Liu, B. Liu, and Y. Kang, “A variable Step size INC MPPT method for PV systems,” IEEE Trans. Ind. Electron., vol. 55, no. 7, pp. 2622–2628, Jul.
[5] L. Piegari, R. Rizzo, "Adaptive perturb and observe algorithm for photovoltaic maximum power point tracking," Renewable Power Generation, IET, vol. 4,no. 4, pp. 317-328, July 2010.
[6] T.Kerekes*,R.Teodorescu*M.Liserre**,R.Mastromauro, A. Dell’Aquila**MPPT algorithm for Voltage Controlled PV Inverters.
Buildings Conference Montreal, August 20-24, 2004 Refereed Paper
[8] M. D. Anderson and D. S. Carr, “Battery energy storage technologies,”Proc. IEEE, vol. 81, no. 3, pp. 475– 479, Mar. 1993.
[9] Z. M. Salameh, M. A. Casacca, and W. A. Lynch, “A mathematical model for lead acid batteries,” IEEE Trans. Energy Convers., vol. 7, no1, pp. 93–98, Mar. 1992.
[10] Non conventional energy sources by G.D. Rai.
[11] M.Ptrinic and Z.Jakopovic Modeling andsimulation of System.PEM cell-power converter system
[12] J.T.Pukrushpan, A. G. Stephanopoulos, H. Peng, Control of Fuel Cell Power Systems, 2nd printing, Springer-Verlag, London Limited, 2005. ISBN: 1-85233-816-4
[13] G. Hoogers, Fuel cell technology handbook, CRC Press LLC, 2003. ISBN 0-8493-0877-1
[11] N. Mohan, T. M. Undeland, and W. P. Robbins, Power Electronics, Converters, Applications and Design, 2nd ed. New York: Wiley, 2003.
[12] R. H. Lasseter, “Microgrids,” in Proc. IEEE Power Eng. Soc. Winter Meeting, Jan. 2002, vol. 1, pp. 305–
308.
[13] R. H. Lasseter and P. Piagi, “Control and design of microgrid components,” Jan. 2006, PSERC final project
reports.
[14] P. Piagi and R. H. Lasseter, “Autonomous control of micro grids,” presented at the Power IEEE Eng. Soc.
General Meeting, Montreal, QC, Canada, 2006.
[15] F. Katiraei and M. R. Iravani, “Power management strategies for a microgrid with multiple distributed generation units,” IEEE Trans. Power Syst., vol. 21, no. 4, pp. 1821 1831, Nov. 2006for a direct-hydrogen
hybrid versus a direct-hydrogen load-following fuel cell vehicle. SAE Papers 2003-01-0416.
[16] B.-G. Yu, M. Matsui, and G.-J. Yu, “A correlation-based islanding detection method using current-magnitude disturbance for PV system,”IEEE Trans.Ind. Electron., vol. 58, no. 7, pp. 2935–2943, Jul.2011. [17] C.Mi, H. Bai, C. Wang, and S. Gargies, “Operatio,design and controlof dual H-bridge-based isolated
bidirectional DC-DC converter,” IET Power Electron.,vol. 1, no. 4, pp. 507–517, 2008.
[18] R. Rao, S. Vrudhula, and D. N. Rakhmatov, “Battery modeling for energy- aware system design,”
Computer, vol. 36, no. 12, pp. 77–87, Dec.2003
[19] M. Chen and G. A. Rincon-Mora, “Accurate electrical battery model capable of predicting runtime and I-V performance,” IEEE Trans. EnergyConvers., vol. 21, no. 2, pp. 504–511, Jun. 2006.