Scissors Mode in Gd Nuclei
J. Kroll1,a, B. Baramsai2, J. A. Becker3, F. Beˇcv´aˇr1, T. A. Bredeweg4, A. Couture4, A. Chyzh2,3, D. Dashdorj2,3, R. C. Haight4, M. Jandel4, M. Krtiˇcka1, G. E. Mitchell2, J. M. O’Donnell4, W. Parker3, R. S. Rundberg4, J. L. Ullmann4, D. J. Vieira4, C.L. Walker2, J. B. Wilhelmy4, J. M. Wouters4,
C. Y. Wu3.
1 Charles University in Prague, CZ-180 00 Prague 8, Czech Republic 2 North Carolina State University, Raleigh, NC 27695
and Triangle Universities Nuclear Laboratory, Durham, NC 27708
3 Lawrence Livermore National Laboratory, Livermore, CA 94551 4 Los Alamos National Laboratory, Los Alamos, New Mexico 87545
Abstract. Spectra ofγrays following neutron capture at isolated resonances of 6 sta-ble Gd isotopes were measured with highly segmented BaF2detector DANCE at the Los Alamos LANSCE spallation neutron source. The main emphasis was put on studying the γ-cascade decay of neutron resonances to get unique information on photon strength. An analysis of the accumulatedγ-ray spectra within the extreme statistical model leads to an inescapable conclusion that scissors mode resonances are built not only on the
ground-state, but also on excited levelsin all product nuclei studied. The results on summed
B(M1)↑strength and energy of the scissors mode are compared with systematics of scis-sors mode parameters for theground-statetransitions deduced from nuclear resonance fluorescence measurements. A specific feature of our experiments is the investigation of scissors mode of odd nuclei, for which the nuclear resonance fluorescence provides only limited information.
1 Introduction
In medium and heavy mass nuclei detailed spectroscopic information exists only for levels at low excitation energy near the ground state and often for resonances above the neutron separation energy Sn. Due to the rapid increase of the level density with excitation energy, it is extremely difficult to resolve the populating or depopulating transitions in order to obtain reliable spectroscopic information in intermediate energy region belowSnthat is usually called alevel quasicontinuum. It is believed that
γdecay of the nucleus in the quasicontinuum is described by the extreme statistical model in terms of the nuclear level density and a set of photon strength functions (PSFs) for different multipolarities. Probably the most direct way to examine these quantities is via study of the properties ofγ-ray spectra originating from the radiative neutron capture reaction at isolated resonances.
The combination of the pulsed neutron beam at LANSCE (Los Alamos Neutron Science CEnter) and the highly segmented, highly efficient γcalorimeter DANCE (Detector for Advanced Neutron Capture Experiments) provides an ideal opportunity to study theseγ-ray spectra.
In this contribution we describe a measurement of the series of stable Gd isotopes using the DANCE calorimeter. A major goal of these experiments is to useγ-ray spectra measured for various multiplicities to determine the appropriate PSFs with special interest in the behavior of the scissors mode which is expected to play an important role inγ-decay of Gd nuclei.
In Sec. 2 the experimental technique to measure theγ-ray spectra is described. The modeling of the statisticalγcascades is discussed in Sec. 3. Information about the PSFs that can be obtained from
a e-mail:[email protected] DOI: 10.1051/
C
Owned by the authors, published by EDP Sciences, 2012 epjconf 20122104005/
EPJ Web of Conferences
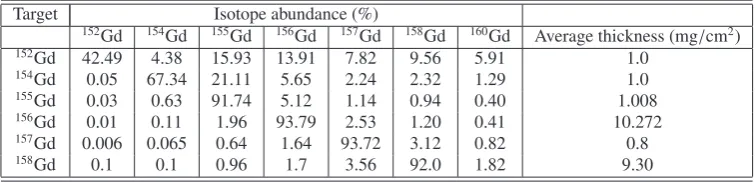
Table 1.Isotopic composition and the average thickness of the Gd targets used in the measurements.
Target Isotope abundance (%)
152Gd 154Gd 155Gd 156Gd 157Gd 158Gd 160Gd Average thickness (mg/cm2)
152Gd 42.49 4.38 15.93 13.91 7.82 9.56 5.91 1.0
154Gd 0.05 67.34 21.11 5.65 2.24 2.32 1.29 1.0
155Gd 0.03 0.63 91.74 5.12 1.14 0.94 0.40 1.008
156Gd 0.01 0.11 1.96 93.79 2.53 1.20 0.41 10.272
157Gd 0.006 0.065 0.64 1.64 93.72 3.12 0.82 0.8
158Gd 0.1 0.1 0.96 1.7 3.56 92.0 1.82 9.30
the measuredγ-ray spectra and its comparison with the other available data is presented in Sec. 4. It should be mentioned that the results for158Gd product nucleus were already published [1]. The results
for other isotopes are still preliminary. A summary is given in Sec. 5.
2 Experimental setup and measurements
2.1 Experimental setup
The experiment was performed at the neutron source LANSCE [2]. The 800-MeV H−beam from the LANSCE linac is injected into the proton storage ring where it is immediately converted to H+by stripping through a thin foil. The proton pulsed beam is then extracted with a repetition rate of 20 Hz and strikes a tungsten spallation target. A white spectrum of neutrons with energies from subtermal up to about 1 MeV is obtained. These neutrons are sent to flight path 14 at the Manuel Lujan Jr. Neutron Scattering Center.
The DANCE detector array is installed at 20 m on this flight path. It is designed for studying neutron capture cross sections on small samples [3, 4]. DANCE consists of 160 BaF2 scintillation
crystals surrounding a sample and covering a solid angle of' 4π. A6LiH shell about 6-cm thick is placed between the sample and the BaF2crystals in order to reduce the scattered neutron flux striking
the crystals. The remaining background due to scattered neutrons that penetrate the6LiH shell and
interact with the BaF2crystals can be subtracted, see below. Besides the BaF2crystals, the DANCE
setup includes three additional detectors that are used to monitor the neutron flux, and one detector for monitoring the external background.
Targets were made of enriched gadolinium deposited via electroplating on a beryllium foil glued to an aluminum ring. The isotopic composition of the targets is listed in Table 1 together with their average thicknesses.
2.2 Data processing
The DANCE acquisition system [5] is based on waveform digitization of signals from all 160 detectors using four-channel Acqiris DC265 digitizers with a sampling rate of 500 MS/s (megasamples/second). The digitizers are arranged in 14 compact PCI crates with six DC265 modules per crate. Thus one crate can handle 12 BaF2detectors with two channels - one for fast and the other for slow signal component
- per detector. Each crate contains an embedded computer running under the Linux operating system, and a front-end acquisition program using the framework known as Maximum Integrated Data Acqui-sition System (MIDAS) [6]. The intensity of the signal from a specific crystal is collected in using a digitizer channel with suitably adjusted gains. The ratio of the fast and slow components of the signal is used for discrimination against theα-background from natural radioactivity of Ra in the BaF2
crys-tals [4].
The energy calibration of the DANCE crystals was performed with a combination ofγ-ray sources:
0 200 400 600
M = 2
I
n
t
e
n
s
i
t
y
(
a
r
b
.
u
n
i
t
s
)
0 250 500 750
M = 4 158
Gd
0 2 4 6 8 0
250 500 750 1000
E (MeV) M = 3
0 2 4 6 8 0 150 300 450
E (MeV) 20.6 eV 58.4 eV J = 2
-M > 4
0 400 800 1200
153 Gd
M = 2
I
n
t
e
n
s
i
t
y
(
a
r
b
.
u
n
i
t
s
)
0 400 800 1200
M = 4
0 2 4 6
0 500 1000 1500 2000
E (MeV) M = 3
E (MeV)
0 2 4 6
0 150 300 450 12.4 eV
36.9 eV 39.3 eV
M > 4
Fig. 1.Examples of sum-energy spectra obtained for resonancesJπ=2−
at energies 20.6 and 58.4 eV of the158Gd isotope (left) and the sum-energy spectra corresponding to the resonancesJπ =1/2+at energies 12.4, 36.9 and 39.3 eV of the153Gd isotope (right). The cluster multiplicities of theγcascades,M, are indicated. The spectra are normalized to the intensity in theEtotalpeak for multiplicitiesM=2−7.
was conducted on a run-by-run basis to provide the energy alignment of all crystals in the off-line analysis.
Typical spectra of sums of depositedγ-ray energies in crystals that fire are shown, for the case of
157Gd and152Gd targets, in Fig. 1. As onlys-wave neutron capture plays a role at low neutron energies
in this mass region, we observe only Jπ = 1/2+resonances for even Gd targets andJπ = 1− & 2− for odd Gd targets. Each spectrum consists of (i) the “total” peak at the full energy available from the neutron capture reaction
Etotal=Sn+En, (1)
whereEn is the energy of the incoming neutron in the center of mass, and (ii) a low energy tail that corresponds to cascades for which a part of the emitted energy escaped the detector array. The shape of the spectrum at low sum energies (below about 3 MeV), is strongly influenced by the background from naturalβactivity in the BaF2crystals, especially for low multiplicities.
Often an emitted captureγray does not deposit its full energy in one crystal. Thus the number of crystals that fire is usually higher than the true multiplicity of a capture event. Therefore all contiguous crystals that have fired during an event are combined to “clusters” and considered as the response of the detector array to a singleγ-ray. The number of clusters observed in a capture event is called the “cluster” multiplicity. This multiplicity is much closer to the true multiplicity of theγcascade than is the “crystal” multiplicity (the total number of crystals that fire). The capture events were then sorted using gates on neutron energy and on the cluster multiplicity.
Only events within a certain range of detected sum energiesEΣ(around theEtotalpeak) were taken
into account. During the analysis of the γ-decay in Gd isotopes a narrow, typically 1 MeV wide, interval ofEΣ was chosen for construction of multistep cascade (MSC) spectra, see below. The use of a wider interval improves statistics but leads to significant smearing of the structures seen in the spectra. Additional narrowing of the interval has virtually no impact on the spectral shape.
There is a small background contribution in the spectra that mainly originates fromγrays fol-lowing the capture of scattered neutrons in the BaF2 detectors. The size of the background can be
estimated using the number of counts forEΣ above theEtotalregion in the sum-energy spectra,
EPJ Web of Conferences
3 Simulation of the
γ
-decay of Gd isotopes
3.1 Simulation of spectra
Under various assumptions about the level density and PSFs theγcascades following resonant neutron capture were generated using the DICEBOX algorithm [7]. The response of the DANCE detector to each generated cascade was subsequently obtained from a simulation based on the GEANT4 package. The exact geometry and chemical composition of the detector system were included in the GEANT4 simulations [8]. The resulting quantities can be compared with their experimental counterparts. In this contribution we concetrate only on the analysis of so-called MSC spectra, see Sec. 4.1, that allows us to obtain the information on the PSFs and level densities.
The DICEBOX algorithm generates a complete decay scheme of an artificial nucleus. Below some critical energy,Ecrit, all of the characteristics of the decay scheme, i.e., energies, spins and parities of
levels, as well as their decay properties, are taken from existing experimental data. The choice of the critical energy should be made with care to guarantee that all of the information for energies belowEcrit
is complete. AboveEcritthe level system of the nucleus and its complete decay scheme are generated
using ana priorichosen level density functionρ(E,J, π) and PSFs for multipolaritiesE1,M1, andE2. All higher multipolarities are neglected. Partial radiation widthΓaγbfor a transition between an initial levelaand a final levelbis given by
Γaγb=
X
XL
ξ2
XL
f(XL)E2L+1
γ
ρ(Ea,Ja, πa)
, (2)
where f(XL) stands for photon strength function for transitions of type X (electric or magnetic) and multipolarityL, andξXLis a random number generated from a normal distribution with a zero mean and unit variance. This random number ensures that the individual widthsΓaγbfluctuate according to the Porter-Thomas distribution [9]. The sum in Eq. (2) is over all allowed types and multipolarities of transitions. Internal electron conversion, which is important in transitions between the lowest excited states in Gd isotopes, is correctly treated in the DICEBOX code [7]. Hereafter the simulated system of all levels and their decay scheme is called anuclear realization. Due to the Porter-Thomas fluctuations there exists an infinite number of nuclear realizations that differ from each other even for fixed models of PSFs and level density.
Various models of PSFs and level density can be tested with the DICEBOX code. The fluctuations involved in generating theγdecay allow us to determine all of the uncertainties that arise when simu-lations are performed with the same models. Cascades starting from resonances with a given spin and parity were simulated. Typically 20 nuclear realizations, each with 100,000 cascades, were simulated for eachJπof initials-wave resonances. In our trial-and-error approach, by assuming various models for the PSFs and the level density, we can assess the degree of agreement of the simulated observables with the experimental data and draw conclusions about which of these models is most likely to be valid.
3.2 Photon Strength Functions
3.2.1 Electric-dipole transitions
Decay of the neutron resonances is dominated by dipole transitions. It is well known that forγ-ray energies above neutron separation energies the electric-dipole (E1) transitions play a major role. The PSF at these energies in axially deformed nuclei seems to be consistent with the sum of two Lorentzian terms
fSLO(E1)(Eγ)= 1 3(π~c)2
2
X
i=1
σGiEγΓ
2
Gi (E2
γ−EG2i)
2+E2
γΓG2i
. (3)
nuclei were adopted from [10]. If the parameters were not available for studied nucleus, parameters from a neighboring nucleus were adopted. This PSF shape combined with the Brink hypothesis [11], which says that the PSF shapes are independent on excitation energy, is known as the Brink-Axel or Standard Lorentzian (SLO) model.
Since the shape of theE1 PSF below the neutron separation energy is not well known, additional models are employed. Usually one of two models is used. The first one was, known as KMF model, was proposed in [12] for spherical or weakly deformed nuclei, but is often also used for deformed nuclei
fKMF(E1)(Eγ,T)= FK 3(π~c)2
2
X
i=1
σGiEGiΓGiΓ(Eγ,T) (E2
γ−EG2i)
2 , (4)
where the factorFK =0.7 [12, 13] and theγ-ray- and temperature-dependent widthΓ(Eγ,T) is given by
Γ(Eγ,T)=ΓGi
E2γ+4π2T2 EG2
i
, (5)
with temperatureT =T(E)≡ √(E−∆)/a, the excitation energyEof a final level, the pairing energy
∆, and the shell-model level density parametera.
A second model was proposed for spherical nuclei by Chrien [14] in order to match the behavior of the SLO model at energies near the GEDR maximum and the KMF model at very low Eγ. This phenomenological model was later generalized for deformed nuclei by Kopeckyet al.[15] by intro-ducing an empirical enhancement factork0. This model is known as the EGLO (Enhanced Generalized
Lorentzian) model. In this case the expression for the PSF is
fEGLO(E1) (Eγ,T)=
2
X
i=1
σGiΓGi 3(π~c)2
4π2FKΓ
Gi T
2
E5
Gi
+ EγΓ(Eγ,T)
(E2
γ−EG2i)
2+E2
γΓ(Eγ,T)2
(6)
Here theγ-ray- and temperature-dependent width is given by
Γ(Eγ,T)=
"
k0+
Eγ−Eγ0
EG−Eγ0
(1−k0)
#
ΓGi E2
γ+4π2T2 E2
Gi
. (7)
The recommended value ofEγ0is 4.5 MeV [13, 15]. In Ref. [13] the systematics of the parameterk0
was adjusted to reproduce the total radiation width of neutron resonances. As the total radiation width depends on the number of levels below neutron separation energy the suggested systematics ofk0
depends on the proposed level density model. We left the parameterk0free to vary in our simulations.
The energy dependence of the EGLO model is very similar to the KMF model fork0≈1.5.
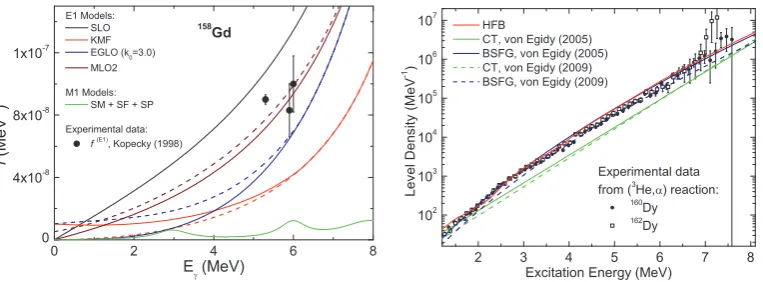
Many other models ofE1 PSF can be found in the literature. RIPL-3 database [16] suggests espe-cially the MLO family of models to be used. As the description of these models is rather complicated, the reader is referred to their detailed description in Ref. [16].
As seen from Eqs. (4) and (6) the shapes of both the KMF and EGLO models depend on tempera-ture (or excitation energy) of the decaying nucleus and violate the strict form of the Brink hypothesis. Similar temperature dependence ofE1 PSF is also a feature of the MLO family of models. The energy dependence of the PSFs predicted by these models is shown in Fig. 2 for the parametrization used for
157Gd target. To keep the figure reasonably clear we show only the shape of one of the MLO models
(MLO2) here.
3.2.2 Magnetic-dipole transitions
EPJ Web of Conferences
0 2 4 6 8
0 4x10
-8 8x10
-8 1x10
-7 E1 Models:
SLO KMF EGLO (k
0 =3.0) MLO2
M1 Models: SM + SF + SP
Experimental data: f
(E1)
, Kopecky (1998)
f
(
M
e
V
-3
)
E (MeV) 158
Gd
2 3 4 5 6 7 8
10 2 10
3 10
4 10
5 10
6 10
7
HFB
CT, von Egidy (2005) BSFG, von Egidy (2005) CT, von Egidy (2009) BSFG, von Egidy (2009)
Experimental data f rom (
3
He,) reaction: 160
Dy 162
Dy
L
e
v
e
l
D
e
n
s
i
t
y
(
M
e
V
-1
)
Excitation Energy (MeV)
Fig. 2.Left: Some of the PSFs used in simulations of158Gd. There are shown two curves for KMF, EGLO and MLO2 models which indicate the temperature dependence of these models - the lower curve corresponds to
T =0 while the upper one toT = p(Sn−Eγ−∆)/a. Experimental data adopted from Kopecky (1998) [13] for f(E1) at energies 5.9, 6.0 and 5.3 MeV correspond to155,157,159Gd, respectively. Parametrization of M1 PSF corresponds to that given in Ref. [1]. Right: Level density models used in simulations of158Gd. The different absolute values predicted by the various level density models originate from the different paramerization of the spin-cutoffparameter used in von Egidy (2005) [17] and von Egidy (2009) [30]. The resonance spacing ofs-wave resonances is the same in all cases. Models of level density are compared with experimental data for even-even Dy isotopes [32].
energy. TheM1 strength corresponding to the spin-flip mode was measured for several rare-earth nu-clei (including158Gd) from inelastic proton scattering [18]. A double-humped structure was observed between 5 and 10 MeV and we adopted this form of SF resonance in our simulations. Sometimes a sum of the strengths from the two models, fSP(M1)andfSF(M1), is used. We tested all these models and we usually adjusted the absolute value of the PSFs to obtain the ratio of f(E1)/f(M1)≈7 at about 7 MeV.
This value seems to be reasonably well determined from average resonance capture experiments [19].
3.2.3 Scissors mode
In 1976, Hilton [20] and later Lo Iudice and Palumbo [21] and Iachello [22] predicted an isovector M1 collective vibrational mode in deformed nuclei. This mode, known as the scissors mode (SM), was experimentally observed for the ground-state transitions by Bohleet al.[23] from high-resolution electron inelastic scattering at low momentum transfer in156Gd. The parameters of the mode for
tran-sitions to the ground state were intensively investigated using the (γ,γ0) reaction in rare-earth
nu-clei [24]. These experiments revealed substantial fragmentation of the mode and concluded that the strength of the mode (or more precisely the total M1 strength in the energy rangeEγ ≈ 2.5−4.0 MeV) for the ground-state transitions in even-even rare-earth nuclei is proportional to the square of the deformation [25]; for well deformed nuclei this strength reachesB(M1)≈3µ2
N[24]. In odd nuclei the observed strength was significantly lower - about one half or one third of the strength observed in even-even nuclei. But it is believed that significant fraction of the strength in odd nuclei escaped the detection due to very high level density in the region of SM in odd nuclei [26]. The centroid of the scissors mode strength is located near 3 MeV and is almost constant in rare-earth nuclei. In our simulations the scissors mode was represented by a single Lorentzian resonance term.
The analysis of data on two-stepγcascades (TSC) [27, 28] in162Dy revealed that the scissors mode
3.2.4 Electric-quadrupole transitions
In addition to dipole transitions, electric quadrupole (E2) transitions might also play a role in the decay of neutron resonances. We found thatE2 transitions aboveEcritare not important in the interpretation
of our data. We simply assumed the validity of the single-particle model (f(E2)=const.) in our simu-lations. The strength of f(E2)=const.was taken to reproduce the ratio with respect to dipole strengths
at about 7 MeV from average resonance capture data [19].
3.3 Nuclear Level density
Besides the PSFs a model for level density (LD) beweenEcritandSnis needed to simulateγ-decay of
the nucleus. We mainly used the back-shifted Fermi Gas (BSFG) model [17]
ρ(E,J, π)= f(J)f(π) e
2√a(E−E1)
12·21/2σ
ca1/4(E−E1)5/4
, (8)
whereaandE1are adjustable parameters, and the Constant Temperature (CT) model [17]
ρ(E,J, π)= f(J)f(π) 1 Te
(E−E0)/T, (9)
where the free parameters are temperatureT and the energy E0. In both models the spin probability
distribution function has the form
f(J)=exp −J
2
2σ2 c
!
−exp −(J+1)
2
2σ2 c
!
. (10)
We have also adopted the parametrization of these two models from Ref. [30] that differs from Ref. [17] mainly in form of the spin-cutoffparameterσc. A strong even-odd spin staggering in the spin
distri-bution of even-even nuclei at low excitation energies is also included in Ref. [30]. Both of these parametrizations led to virtually the same results in our analysis. No parity dependence was assumed in the BSFG and CT models, which corresponds to f(π)=1/2.
In addition to the closed-form models, we tested also the level density calculated within the Hartree-Fock-Bogoljubov (HFB) approach. Here, the level density is available in tabulated form as a function of energy for levels with each spin and parity [16, 31]. The calculated level densities usually suffer from difficulties in reproducing the average neutron resonance spacing. In order to bring the cal-culations into agreement with experimental data, the HFB level density was renormalized to reproduce the resonance spacing at the neutron separation energy. After such a renormalization there is typically a very good agreement between the HFB level density and the BSFG model at energies aboveEcrit,
see the right panel of Fig. 2.
All known levels belowEcritare taken into account in the simulations. The level density formula
is thus applied only above this energy. It is interesting to note that the adopted BSFG and HFB level density models in even-even Gd nuclei are in an excellent agreement with level densities obtained from3He-induced measurements in neighboring even-even Dy isotopes [32], see Fig. 2.
4 Properties of
γ
decay
4.1 MSC spectra
EPJ Web of Conferences
0 50 100 150 200 250
M = 2
I
n
t
e
n
s
i
t
y
(
a
r
b
.
u
n
i
t
s
)
0 400 800 1200 M = 4
158 Gd
0 2 4 6 0
200 400 600 800
E (MeV) M = 3
0 2 4 6
0 500 1000 1500
E (MeV) 20.6 eV 58.4 eV J = 2
-M > 4
0 200 400 600
153 Gd
M = 2
I
n
t
e
n
s
i
t
y
(
a
r
b
.
u
n
i
t
s
)
0 1000 2000 3000 M = 4
0 2 4 6
0 500 1000 1500 2000
E (MeV) M = 3
E (MeV)
0 2 4
0 500 1000 1500 2000
12.4 eV 36.9 eV 39.3 eV M > 4
Fig. 3.Experimental MSC spectra obtained for selectedJπ=2−
neutron resonances of158Gd (left) and selected
Jπ=1/2+neutron resonances of153Gd (right) isotopes.
to minimize statistical uncertainties as well as uncertainties from simulations, the spectra were binned into coarse bins with a width of 150 keV. As already noted, the background contribution to the MSC spectra is very small for strong resonances.
A large number (several hundreds) of model combinations (parametrizations) of PSFs and level densities was tested in simulations and compared with the experimental MSC spectra. It is very difficult to quantify the agreement between simulations and experimental spectra as individual bins in the MSC spectra are mutually correlated in a complicated way. As a consequence, the degree of agreement was only checked visually.
For all multiplicities, only one normalization parameter is needed for comparison of experimental and simulated MSC spectra. We normalized spectra to the same number of counts in theEtotalpeak,
which includes almost all multiplicities. As already noted, in practice we considered multiplicities M = 2−7. The experimental MSC spectra from resonances with the same spin are similar but not identical, due to Porter-Thomas fluctuations of the primary transitions. This is illustrated for158Gd and 153Gd isotopes in Fig. 3.
For the same reason the simulated MSC spectra for different nuclear realizations obtained with the same model of PSFs and level density are not identical. To characterize uncertainties due to Porter-Thomas fluctuations the predicted MSC spectra are plotted as a gray band. Each such band has a width of two sigma (the average±one sigma) and was obtained from analysis of 20 independent nuclear realizations. The size of fluctuations among the MSC spectra for different resonances seems to be well reproduced by the simulations. The spectra from different nuclear realizations are almost identical for higher multiplicities (M≥4), while some differences are predicted for lower multiplicities, especially forM=2.
4.2 Comparison of experimental and simulated spectra
Models that do not include a resonance structure near 3 MeV in a PSF are unable to reproduce the humps situated at this energy observed in theM =2−4 MSC spectra in none of Gd isotopes. Typical examples of simulated MSC spectra with no resonance structure are shown in Fig. 4.
Simulations also show that the resonance structure cannot be ofE1 character, see Fig. 5. On the other hand, a resonance structure near 3 MeV in the M1 orE2 PSF is able to describe experimental MSC spectra. We assume in the following that such a resonance structure is in theM1 PSF, i.e., it is the scissors mode (SM).
To reach a reasonable agreement with the experimental data the SM must be postulated also on excited states, i.e. it must follow - at least approximately - the Brink hypothesis. An example of simu-lations with theM1 which violates the Brink hypothesis is shown in Fig. 6.
We found that the MSC spectra are rather sensitive to the energy of the scissors mode,ESM. The
0 50 100 150 200 250
M = 2
In te n s i ty ( a r b . u n i ts ) 0 400 800 1200 M = 4
158 Gd
0 2 4 6 0
200 400 600 800
E (MeV) M = 3
0 2 4 6
0 500 1000 1500
E (MeV) 20.6 eV 58.4 eV J = 2
-M > 4
0 200 400 600 153 Gd
M = 2
In te n s i ty ( a r b . u n i ts ) 0 1000 2000 3000 M = 4
0 2 4 6
0 500 1000 1500 2000
E (MeV) M = 3
E (MeV)
0 2 4
0 500 1000 1500 2000 12.4 eV 36.9 eV 39.3 eV M > 4
Fig. 4.Comparison of experimental MSC spectra with the simulations (grey band) that assume the entire absence of the SM in PSFs. The model combination of fKMF(E1), f
(M1)
SP =1×10−
9MeV−3+f(M1) SF , f
(E2)
SP =5×10−
11MeV−5
PSFs with BSFG model [17] of LD is compared with the experimental data obtained for the selectedJπ =2− neutron resonances of158Gd nucleus (left) and selectedJπ=1/2+neutron resonances of153Gd nucleus (right).
0 200
M = 2
I n t ens i t y ( ar b. uni t s ) 0 1000 158 Gd M = 4
0 2 4 6 0
1000
E (MeV) M = 3
E (MeV)
0 2 4 6
0 1000 66.7 eV 81.5 eV J = 1
-M > 4
0 2x10 4 4x10 4
M = 2
In te n s i t y ( a r b . u n i ts ) 0 4x10 4 8x10 4 M = 4
0 2 4 6
0 5x10 4 1x10 5
E (MeV) M = 3
E (MeV)
0 2 4
0 2x10 4 4x10 4 101.1 eV 409.1 eV M > 4
159 Gd
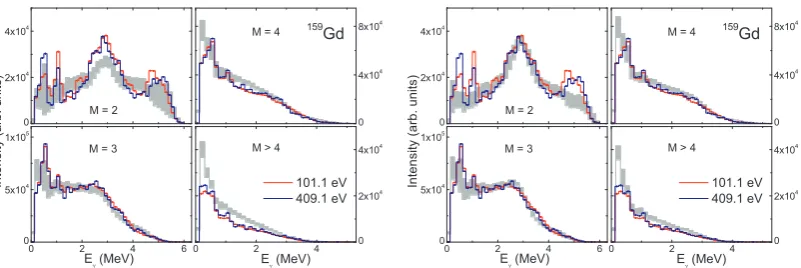
Fig. 5.Comparison of experimental MSC spectra with the simulations (grey band) which assume the presence of the Lorentz-like resonance structure at 3 MeV inE1 instead ofM1 PSF is shown for158Gd (left) and159Gd (right)
isotopes.
the scissors mode, which is given by the productσSM.ΓSM, is much weaker. The position of the mode must be very close to 3 MeV. We estimate that in all Gd isotopes, except the155Gd nucleus, it cannot be lower than about 2.8 MeV or higher than about 3.1 MeV. In case of155Gd very preliminary results indicate a position between 2.6 and 2.8 MeV. If the resonance energy is outside this range the shapes of the bumps in the MSC spectra forM=2−4 are not reproduced. This restriction on theESM- at least in even-even nuclei - leads, for example, to a disagreement between the present experimental data and simulations with the PSF deduced from (3He,α) reaction in neighboring even-even Dy nuclei, see [1]. Rather surprisingly, predictions based on very different damping widths yielded similar results. The spectra seem to allow any value betweenΓSM=0.7 and 1.3 MeV.
In majority of Gd isotopes we were unable to reach a reasonable agreement between the simulated and experimental spectra for any model combination incorporating the SLO model for theE1 PSF. On the other hand, a reasonably good agreement is achieved with the KMF, as well as with the EGLO model (with the dimensionless constantk0 adjusted to 1.5-3.5), in combination with a “composite” model of theM1 PSF: f(M1)= f(M1)
SM +f (M1) SF + f
(M1)
EPJ Web of Conferences
0 200
M = 2
I nt ens i t y ( a r b . uni t s ) 0 1000 158 Gd M = 4
0 2 4 6 0
1000
E (MeV) M = 3
E (MeV)
0 2 4 6
0 1000 66.7 eV 81.5 eV J = 1
-M > 4
0 200 400 600 153 Gd
M = 2
In te n s i ty ( a r b . u n i ts ) 0 1000 2000 3000 M = 4
0 2 4 6
0 500 1000 1500 2000
E (MeV) M = 3
E (MeV)
0 2 4
0 500 1000 1500 2000 12.4 eV 36.9 eV 39.3 eV M > 4
Fig. 6.Comparison of experimental MSC spectra with the calculations assuming the presence of the SM only for the ground state transitions. In case of 158Gd nucleus (left) the SM parametrization is E
SM = 3.0 MeV,
ΓSM=1.0 MeV andσSM=0.2 mb, while for the153Gd nucleus (right) it isESM=2.9 MeV,ΓSM=1.0 MeV and
σSM=0.2 mb. In addition to the SM there are also fSP(M1)and fSF(M1)present inM1 PSF with the same parameters as in Fig. 4. Models used forE1,E2 and LD are the same as in Fig. 4.
0 200
M = 2
I nt ens i t y ( ar b. uni t s ) 0 1000 158 Gd M = 4
0 2 4 6 0
1000
E (MeV) M = 3
E (MeV)
0 2 4 6
0 1000 66.7 eV 81.5 eV J = 1
-M > 4
0 200 400 600 153 Gd
M = 2
I n t e n s i t y (a rb . u n i t s ) 0 1000 2000 3000 M = 4
0 2 4 6
0 500 1000 1500 2000
E (MeV) M = 3
E (MeV)
0 2 4
0 500 1000 1500 2000 12.4 eV 36.9 eV 39.3 eV M > 4
Fig. 7.Calculated MSC spectra compared with the experimental data obtained for selected Jπ = 1− neutron resonances of158Gd (left) andJπ=1/2+neutron resonances of153Gd (right) nuclei. The SM parametrization is the same as in Fig. 6, but it is assumed here that the SM is built on all the excited levels. There are also f(M1)
SP and f(M1)
SF present inM1 PSF with the same parameters as in Fig. 4. Models used forE1,E2 and LD are the same as in Fig. 4.
a systematic trend - the heavier nucleus, the higherσSMrunning from aboutσSM =0.2 mb in153Gd
to aboutσSM=0.6 mb in159Gd, see Figs. 7 and 8.
Omitting the fSP(M1)part of M1 PSF seems to worsen the agreement in all tested nuclei. There is a very slight sensitivity of the shapes of simulated spectra to the parameters of fSF(M1)and to the E2 strength. We have obtained satisfactory agreement between the MSC experimental spectra and the simulations only using the BSFG model [17,30] for level density while the calculations with the CT formula [17,30] didn’t lead to the reasonable agreement in any studied isotopes.
We should stress that within an enormous functional space the trial-and-error method adopted in our analysis does not guarantee that we find the models (or combinations of parameters) that lead to the best possible agreement between simulated and experimental MSC spectra.
With the exception of the SLO model and the model based on data from3He-induced reactions,
we did not test models where the E1 PSF does not depend on temperature (in other words models
0 2x10 4 4x10 4
M = 2
I
n
t
e
n
s
i
t
y
(
a
r
b
.
u
n
i
t
s
)
0 4x10
4 8x10 4 M = 4
0 2 4 6
0 5x10 4 1x10 5
E (MeV) M = 3
E (MeV)
0 2 4
0 2x10
4 4x10 4
101.1 eV 409.1 eV M > 4
159 Gd
0 2x10 4 4x10 4
M = 2
I
n
t
e
n
s
i
t
y
(
a
r
b
.
u
n
i
t
s
)
0 4x10
4 8x10 4 M = 4
0 2 4 6
0 5x10 4 1x10 5
E (MeV) M = 3
E (MeV)
0 2 4
0 2x10
4 4x10 4
101.1 eV 409.1 eV M > 4
159 Gd
Fig. 8.Comparison of the experimentalγ-ray spectra obtained for the nucleus159Gd with the simulations assuming the SM strengthσSM =0.2 mb (left) andσSM =0.5 mb (right). The position ESM =3.0 MeV and the width ΓSM =1.0 MeV of SM are the same in both figures. The f
(M1) SP and f
(M1)
SF PSFs are also present inM1 PSF with the same parameters as in Fig. 4. Models used forE1,E2 and LD are the same as in Fig. 4.
a temperature-dependentE1 PSF in order to reproduce the MSC spectra. We can only conclude that the MSC spectra are consistent with predictions of “temperature-dependent” KMF or EGLO models.
4.3 Comparison with other data
There are several other relevant measurements that provide information on the PSFs below the neutron separation energy for A ∼ 150−160 nuclei. Data on ground-state transitions from (γ,γ0)
measure-ments [24, 33], that are available for many even-even and few odd nuclei, and data from3He-induced
reactions [29] in neighboring nuclei were already mentioned. In addition, there also exist data from the (n,γ) reaction. Specifically, (i) values of the PSFs were obtained from the intensities of primary transitions from resonance neutron capture in several odd nuclei [13], see also Fig. 2, (ii) two-stepγ cascades following thermal neutron capture in162Dy were measured [28], and (iii) information on the
total radiation widths of neutron resonances is available for all stable isotopes [34].
As already mentioned in Sec 3.2.3, data from (γ,γ0) experiments yield the total reduced M1 strength for transitions to the ground state ofB(M1)≈3µ2N forEγbetween 2.7 and 3.7 MeV in well deformed even-even nuclei. In our case the total reduced strength of the SM in a comparable energy interval obtained for the156Gd and158Gd isotopes isB(M1) ≈ 1.5 µ2
N. It means that for both
even-even Gd isotopes our data require significantly smallerB(M1). In fact, we should not compare only the strength of the scissors mode, but rather the sum of allM1 contributions,f(M1)= fSM(M1)+fSP(M1)+fSF(M1), with experimental data. ThefSF(M1)contribution to the given energy interval is very weak,<0.2µ2N. The contribution of fSP(M1)is slightly higher, but still≤0.5µ2
N. In any case, theB(M1) in even-even Gd nu-clei needed for reproduction of our data is at most about 2µ2N. The observed difference in the strengths from (γ,γ0) and our experiments suggests that the parameters of the scissors mode for ground-state
transitions may differ from the corresponding parameters for excited levels. Such a situation would not be at strong variance with our data. For instance in the case of158Gd simulations with the SM that gives
B(M1)∼3µ2Nfor the ground state transitions butB(M1) ∼1.1µ2Nfor transitions between all excited states showed negligible difference with respect to simulations with the SM giving B(M1) ∼ 1.1µ2N independently of the final level [1].
EPJ Web of Conferences
of the SM strength does not seem to follow the square of deformation as it is suggested from NRF experiments in even-even nuclei.
5 Summary
Measurement ofγ-ray spectra from resonances in 6 stable Gd isotopes was performed with an isotopi-cally enriched targets at the DANCE detector array at LANSCE. The multistep cascadeγ-ray spectra for different multiplicities were used to test the validity of various PSF models. For theE1 PSF we found that, at least at lowγ-ray energies, a reasonable description was obtained with the KMF or EGLO (k0 =1.5−3.5) models.
Our analysis indicates that a resonance-like structure atEγ ≈3 MeV in a PSF in all Gd isotopes is required. The structure is not only a property of the ground-state transitions but must also be present in the decay between excited levels. We identify this structure with the scissors mode as it cannot be in theE1 PSF. It is relatively wide, we estimate its width to be 0.7-1.3 MeV. In addition to the scissors mode additional “smooth”M1 strength seems to be needed to reproduce our data.
The strength of the mode from our data on even-even Gd nuclei is significantly smaller than that of the ground-state transitions from (γ, γ0) experiments, what may suggest that the properties of the mode might be different for the ground-state transitions and for transitions between excited levels. One cannot completely exclude also a systematic decrease of the scissors mode strength with the excitation energy of the levels on which this mode is based. The difference between the strength of the scissors mode in heavier odd and even-even Gd nuclei could indicate that the odd nucleon plays a very impor-tant role in the systematic of the scissors mode strength.
ACKNOWLEDGEMENTS
This work was supported in part by the U. S. Department of Energy Grants No. DE-FG52-09NA29460 and No. DE-FG02-97-ER41042. This work benefited from the use of the LANSCE accelerator and was performed under the auspices of the U. S. Department of Energy at Los Alamos National Laboratory by the Los Alamos National Security, LLC under Contract No. DE-AC52-06NA25396 and at the Lawrence Livermore National Laboratory by the Lawrence Livermore National Security, LLC under Contract No. DE-AC52-07NA27344. It was also supported by the research plans MSM 0021620859, and INGO LA08015 of the Ministry of Education of the Czech Republic, and grant SVV-2011-263309 of the Charles University in Prague.
References
1. A. Chyzhet al., Phys. Rev. C84, 014306 (2011). 2. P. W. Lisowskiet al., Nucl. Sci. Eng.106, 208 (1990).
3. M. Heil, R. Reifarth, M. M. Fowler, R. C. Haight, F. K¨appeler, R. S. Rundberg, E. H. Seabury, J. L. Ullmann and K. Wisshak, Nucl. Instrum. Methods Phys. Res. A459, 229 (2001).
4. R. Reifarthet al., Nucl. Instrum. Methods Phys. Res. A531, 530 (2004). 5. J. M. Wouterset al., IEEE Transactions on Nuclear Science53, 880 (2006).
6. S. Ritt and P.-A. Amaudruz, MIDAS − Maximum Integrated Data Acquisition System, http://midas.psi.ch.
7. F. Beˇcv´aˇr, Nucl. Instrum. Methods Phys. Res. A417, 434 (1998). 8. M. Jandelet al., Nucl. Instrum. Methods Phys. Res. B261, 1117 (2007). 9. C. E. Porter and R. G. Thomas, Phys. Rev.104, 483 (1956).
10. S. S. Dietrich and B. L. Berman, At. Data and Nucl. Data Tables38, 199 (1988). 11. D. M. Brink, Ph.D. thesis, Oxford University, 1955.
13. J. Kopecky, in Handbook for Calculations of Nuclear Reaction Data, Report No. IAEA-TECDOC-1034 (IAEA, Vienna, 1998), p. 97.
14. R. E. Chrien, inProc. of the Vth International School on Neutron Physics, Alushta, Dubna 1987, ed. by B.B. Kolesova and V.R. Sarantseva (Dubna Report No. D3, 4, 17-86-747, 1987).
15. J. Kopecky, M. Uhl and R. E. Chrien, Phys. Rev.C 47, 312 (1993). 16. R. Capoteet al., Nucl. Data Sheets1103107 (2009).
17. T. von Egidy and D. Bucurescu, Phys. Rev. C72044311 (2005). 18. D. Frekerset al., Phys. Lett.B244, 178(1990).
19. L. M. Bollinger and G. E. Thomas, Phys. Rev.C 2, 1951 (1970).
20. R. R. Hilton, inProceedings of the International Conference on Nuclear Structure, Dubna, 1976 (unpublished).
21. N. Lo Iudice and F. Palumbo, Phys. Rev. Lett.41, 1532 (1978) 22. F. Iachello, Nucl. Phys. A358, 89c (1981).
23. D. Bohleet al., Phys. Lett.B137(1984) 27.
24. U. Kneissl, H. H. Pitz and A. Zilges, Prog. Part. Nucl. Phys.37(1996) 349.
25. W. Ziegler, C. Rangacharyulu, A. Richter, and C. Spieler, Phys. Rev. Lett. 65, 2515 (1990). 26. A. Nordet al., Phys. Rev. C67, 034307 (2003).
27. F. Beˇcv´aˇr, P. Cejnar, J. Honz´atko, K. Koneˇcn´y, I. Tomandl and R. E. Chrien, Phys. Rev.C 521278 (1995).
28. M. Krtiˇcka, F. Beˇcv´aˇr, J. Honz´atko, I. Tomandl, M. Heil, F. K¨appeler, R. Reifarth, F. Voss, and K. Wisshak, Phys. Rev. Lett. 92, 172501 (2004).
29. A. Schiller, A. Voinov, E. Algin, J. A. Becker, L. A. Bernstein, P. E. Garrett, M. Guttormsen, R. O. Nelson, J. Rekstad, and S. Siem, Phys. Lett.B633, 225 (2006).
30. T. von Egidy and D. Bucurescu, Phys. Rev. C80054310 (2009). 31. S. Goriely, Nucl. Phys.A605(1996) 28.
32. M. Guttormsenet al., Phys. Rev. C68, 064306 (2003).
33. H. H. Pitz, U. E. P. Berg, R. D. Heil, U. Kneissl, R. Stock, C. Wesselborg, and P. von Brentano, Nucl. Phys. A492, 411 (1989).