© 2014, IJCSMC All Rights Reserved 689 Available Online atwww.ijcsmc.com
International Journal of Computer Science and Mobile Computing
A Monthly Journal of Computer Science and Information Technology
ISSN 2320–088X
IJCSMC, Vol. 3, Issue. 2, February 2014, pg.689 – 695
RESEARCH ARTICLE
Automatic Detection of Optic Disc for the
Extraction of Ocular Structure
Nivedha S
1, Dinesh V
21,2
PG Scholars 1
RVS College Of Engineering And Technology Coimbatore, Tamilnadu, India
2
Rover Engineering College Perambalur, Tamilnadu, India
[email protected]; [email protected]
ABSTRACT
Nowadays, some of the most common cause of visual impairment, and blindness are because of diabetes retinopathy, hypertension, glaucoma. These diseases can be detected through regular ophthalmologic examination. However, due to population growth, the ophthalmologists and the experts needed for examination is a limiting factor. So, a system for automatic recognition of these pathological cases will provide a great benefit. Regarding this aspect, the method proposed for the detection of Optic Disc is based on mathematical morphology along with Principal Component Analysis(PCA). It makes use of different operations such as generalized distance function (GDF), the stochastic watershed, and geodesic transformations. The implemented algorithm has been validated on five public databases obtaining promising results.
Keywords —Generalized distance function; geodesic transformation; Optic Disc; Principal Component Analysis;
Watershed transformation.
I. INTRODUCTION
© 2014, IJCSMC All Rights Reserved 690
Regarding this aspect, optic disc (OD) segmentation is a key process in many algorithms designed for the automatic extraction of anatomical ocular structures, the detection of retinal lesions, and the identification of other fundus features. Initially, the OD location helps to avoid false positives in the detection of exudates associated with diabetic retinopathy, since both of them are spots with similar intensity[3]. Secondly, the OD margin can be used for establishing standard and concentric areas in which retinal vessel diameter measurements are performed by calculating some important diagnostic indexes for hypertensive retinopathy, such as central retinal artery equivalent (CRAE)[3] and central vein equivalent(CRVE)[3]. Thirdly, the relation between the size of the OD and the cup (cup-disc-ratio) has been widely utilized for glaucoma diagnosis.
Numerous OD segmentation methods, i.e., OD-boundary detectors, have been reported in the literature[4][5][6]. As for algorithms based on mathematical morphology, most of them detect the OD by means of watershed transformation, generally through marker-controlled watershed. The centroid of the largest and brightest object of the image is consider as an approximation for the locus of the OD and it is used as internal marker.
The method proposed in this paper is mainly based on mathematical morphology although includes a principal component analysis (PCA) in the preprocessing stage. The main steps of the method are the following:
First, the PCA is applied on the RGB fundus image in order to obtain a grey image in which the different structures of the retina, such as vessels and OD, are differentiated more clearly to get a more accurate detection of the OD. This stage is very important since it largely determines the final result.
Then, the vessels are removed through inpainting technique to make the segmentation task easier. Next, a variant of the watershed transformation, the stochastic watershed transformation, are implemented on a region of the original image. Finally, it must be discriminated which of the obtained watershed regions belong to the optic disc and which ones are not. A geodesic transformation and a further threshold are used to achieve that purpose.
This method provides robustness in each processing step. First, it is independent of the database thanks to using PCA. Secondly, it employs the grey-image centroid as initial seed so that not only the pixel intensity is taken into account. Thirdly, it makes use of the stochastic watershed in order to avoid sub-segmentation problems related to classical watershed transformation.
II. METHODS A. Principal Component Analysis
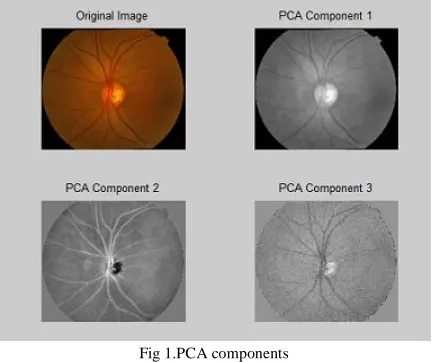
The central idea of PCA is to reduce the dimensionality of a data set. This is achieved by transforming the image to a principal component space containing the most structural contrast and information. The first principal axis is the one with the greatest amount of contrast and information.
Fig 1.PCA components
© 2014, IJCSMC All Rights Reserved 691
In this case, the PCs are given by
Zk = αk’f = αkR’f R + αkG’f G + αkB’f B
Where,
f(x) = ( fR(x),fG(x),fB(x))
k Є {1,2,3}
∑ - Covariance Matrix
B. Inpainting
Inpainting algorithms are used in diverse applications, from the restoration of damaged photographs to the removal/replacement of selected objects. These algorithms usually try to fill selected parts of an image by propagating external information so that structure continuity is preserved.
Let a binary image Ω(x) stand for the region to be inpainted ∂Ω and for its boundary. For each ∂Ω-pixel ,x, the inpainted pixel value is computed as
Where Pk denotes the pixel values in a 5×5 neighborhood of the pixel under consideration, n is the number of
neighboring pixels, and lk is the distance between the pixel x and each neighboring
pixel.
C. Morphological Operators
Mathematical morphology is a nonlinear image processing methodology based on minimum and maximum operations whose aim is to extract relevant structures of an image.
The two basic morphological operators are:
Their purpose is to expand light or dark regions, respectively, according to the size and shape of the structuring element. Those elementary operations can be combined to obtain a new set of operators or basic filters given by
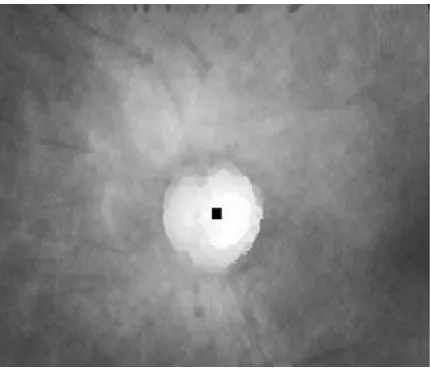
D. Grey-Image Centroid
It marks the center part of the image containing OD. The centroid of a grey-level image can be calculated based on the generalized distance function(GDF). This algorithm is focused on modifying the classic two-pass sequential distance function so that:
1) edge cost is taken into account;
© 2014, IJCSMC All Rights Reserved 692
E. Stochastic Watershed Transformation
Watershed transformation[8] is a segmentation technique for gray-scale images. This algorithm is a powerful segmentation tool whenever the minima of the image represent the objects of interest and the maxima are the separation boundaries between objects. Due to this fact, the input image of this method is usually a gradient image. In mathematical morphology, the gradient g(f)(x) of an image f(x) is obtained as the point wise difference between a unitary dilation and a unitary erosion, i.e.,
III. PHASES OF OD SEGMENTATION
A. Preprocessing
1) PCA:
In this work, the use of a new grey-scale image is proposed. Specifically, it is calculated by means of PCA because this type of analysis maximizes the separation of the different objects that compose a image so that the structures of the retina are better appreciated.
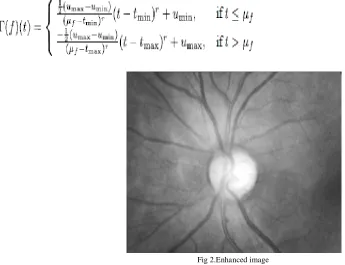
2) Image enhancement:
The non-uniform illumination of this grey image is also corrected and its contrast is increased through a local transformation. The transformation for shade correction is given by the expression
Fig 2.Enhanced image
3) Inpainting :
© 2014, IJCSMC All Rights Reserved 693 Fig 3. A)vessels to be inpainted, B) inpainted image.
This algorithm classifies the image pixels in three clusters so that each pixel belongs to the cluster with the nearest mean. Then, two of the three obtained clusters are defined as vessel. Three classes are required because thick and thin vessels may be very different. Afterwards, a unitary morphological dilation of the segmented vessels yields the final vessel mask. The purpose of this operation is to make sure that the vessels will be contained in the mask.
Fig 4. Grey image centroid
B.OD Segmentation
1) Stochastic watershed transformation:
© 2014, IJCSMC All Rights Reserved 694 Fig 5. segmented image
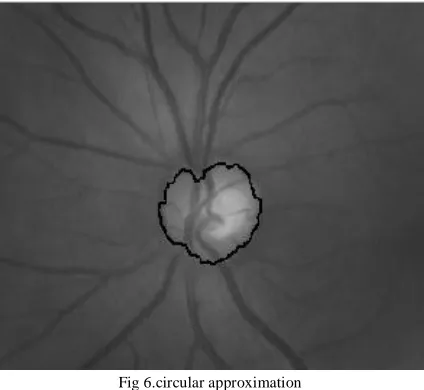
C. Postprocessing:
Once the region of interest has been obtained, the result must be fitted to eliminate false contours, which are detected due generally to the blood vessels that pass through the OD. The inpainting technique was performed to remove most of them, as previously mentioned, however some irregularities can still be appreciated in the final region contour.
Fig 6.circular approximation
In this work, the OD-contour has been estimated as a circle. The main reason for fitting the OD by a circle is because this algorithm will later be used to establish a zone of the retina concentric to the OD-margin according to a standard protocol with the aim to perform vessel diameter measurements. The fit is performed by means of Kasa’s method which lets calculate the center and the radius of the circle that better is adapted to a binary region through least squares.
IV. RESULT & DISCUSSION
© 2014, IJCSMC All Rights Reserved 695
V. CONCLUSION
In this paper, a new approach for the automatic detection of the optic disc has been presented. First, it is focused on the use of a new grey image as input obtained through PCA which combines the most significant information of the three RGB components. Secondly, several operations based on mathematical morphology are implemented with the aim of locating the OD. For that purpose, both stochastic and stratified watershed as well as geodesic transformation has been used. The algorithm has been validated on five different public databases obtaining promising results and improving the results of other methods of the literature.
The final goal of the proposed method is to make easier the early detection of diseases related to the fundus. Its main advantage is the full automation of the algorithm since it does not require any intervention by clinicians, which releases necessary resources (specialists) and reduces the consultation time, hence its use in primary care is facilitated.
ACKNOWLEDGEMENT
I hereby acknowledge all anonymous reviewers for their valuable time and valuable comments.
REFERENCES
[1] Sandra Morales*, Valery Naranjo, Jesús Angulo, and Mariano Alcañiz,” Automatic Detection of Optic Disc Based on PCA and Mathematical Morphology”, IEEE TRANSACTIONS ON MEDICAL IMAGING, VOL. 32, NO. 4, APRIL 2013.
[2] World Health Org., Action plan for the prevention of blindness and visual impairment 2009 2013 2010.
[3] T. Walter, J. C. Klein, P. Massin, and A. Erginay, “A contribution of image processing to the diagnosis of diabetic retinopathy-detection of exudates in color fundus images of the human retina,” IEEE Trans.Med. Imag., vol. 21, no. 10, pp. 1236–1243, Oct. 2002.
[4] L. D. Hubbard, R. J. Brothers, W. N. King, L. X. Clegg, R. Klein, L.S. Cooper, A. Sharrett, M. D. Davis, and J. Cai, “Methods for evaluation of retinal microvascular abnormalities associated with hypertension/sclerosis in the atherosclerosis risk in communities study,” Ophthalmology, vol. 106, no. 12, pp. 2269–2280, Jun 1999.
[5] Aquino, M. E. Gegúndez-Arias, and D. Marín, “Detecting the optic disc boundary in digital fundus images using morphological, edge detection, and feature extraction techniques,” IEEE Trans. Med. Imag., vol. 29, no. 11, pp. 1860–1869, Nov. 2010.
[6] M. Lalonde, M. Beaulieu, and L. Gagnon, “Fast and robust Optic Disc detection using pyramidal decomposition and Hausdorff-based template matching,” IEEE Trans. Med. Imag., vol. 20, no. 11, pp. 1193–1200, Nov. 2001.
[7] L. D. Hubbard, R. J. Brothers, W. N. King, L. X. Clegg, R. Klein, L. S. Cooper, A. Sharrett, M. D. Davis, and J. Cai, Methods for evaluati on of retinal microvascular abnormalities associated with hypertension/ sclerosis in the atherosclerosis risk in communities stu dy, Ophthalmology, vol. 106, no. 12, pp. 2269 2280, Nov 1999.
[8] D. Welfer, J. Scharcanski, C. M. Kitamura, M. M. D. Pizzol, L.W. Ludwig, and D. R. Marinho, “Segmentation of the optic disk in color eye fundus images using an adaptive morphological approach,” Comput. Biol. Med., vol. 40, no. 2, pp. 124–137, Apr 2010.
[9] S. Beucher and F. Meyer, Mathematical Morphology in Image Processing, E. Dougherty ed. New York: Marcel Dekker, Jun 1992.
[10] M. Foracchia, E. Grisan, and A. Ruggeri, “Detection of optic disc in retinal images by means of a geometrical model of vessel structure,”
IEEE Trans. Med. Imag., vol. 23, no. 10, pp. 1189–1195, Oct. 2004.
[11] M. Lalonde, M. Beaulieu, and L. Gagnon, “Fast and robust optic disc detection using pyramidal decomposition and Hausdorff-based template matching,” IEEE Trans. Med. Imag., vol. 20, no. 11,pp. 1193–1200, Nov. 2001.
[12] Meindert Niemeijer. “Automatic Detection of Diabetic Retinopathy in Digital Fundus Photographs.” 2006.
[13] Monteiro, Fernando C., and Vasco Cadavez. “Optic disc detection by earth mover's distance template matching.” (2011).
[14] Morales, Sandra, et al. “Automatic detection of optic disc based on PCA and mathematical morphology.” IEEE Transactions on Medical Imaging, vol. 32, no. 4, (2013).
[15] N. R. Pal and S. K. Pal, “”Entropic thresholding”,” Signal processing, vol. 16, pp. 97–108, 1989.
[16] R. Chr´astek, M. Wolf, K. Donath, G. Michelson, and H. Niemann, “Optic disc segmentation in retinal images,” in Bildverarbeitung f¨ur die Medizin 2002, pp. 263–266, 2002.
[17] Rajput, Yogesh M., et al. “Retinal Optic Disc Detection Using Speed Up Robust Features.” National Conference on Computer & Management Science [CMS-13]. 2013.
[18] Sørensen, T. (1957). “A method of establishing groups of equal amplitude in plant sociology based on similarity of species and its application to analysesn of the vegetation on Danish commons”. Kongelige Danske Videnskabernes Selskab 5 (4):
[19] Susman, E.J., Tsiaras, W.J., Soper, K.A.: “Diagnosis of diabetic eye disease.” JAMA 247(23), 3231–3234 (1982).