On the Vertical Accuracy of the ALOS World 3D-30m
Digital Elevation Model
Çaglar Bayık1, Kazimierz Becek1,2,*, Çetin Mekik1, Mustafa Özendi1
1 Geomatics Engineering Department, Bulent Ecevit University, Zonguldak, Turkey
2 Faculty of Geoengineering, Mining and Geology, Wroclaw University of Science and Technology, Poland * Correspondence: [email protected]; Tel.: +90 538 726 3792
Abstract: The digital elevation model (DEM) is one of the key geospatial datasets used in many fields of engineering and science for countless applications. In this contribution, we assess the vertical accuracy of the Advanced Land Observing Satellite (ALOS) World 3D-30m (AW3D30) DEM using the runway method (RWYM). The RWYM utilizes the longitudinal profiles of runways which are reliable and ubiquitous reference data. A reference dataset used in this project consists of 36 runways located at various points throughout the world. The same dataset was previously used to test the accuracy of WorldDEMTM. Our study indicates that AW3D30 has a remarkably high RMSE of 1.78 m (one σ). However, while analyzing the results, it has become apparent that it also contains a widespread elevation anomaly. We conclude that this anomaly is the result of uncompensated sensor noise and the data processing algorithm (downsampling of the higher resolution data). We believe that this issue should be communicated to the user community. Also, we would like to note that the traditional accuracy assessment of a DEM, e.g., statistical assessment of the elevation differences = model – reference, does not allow for identification of these type of anomalies in a DEM.
Keywords: AW3D30, DEM, Runway Method, RWYM.
1. Introduction
In 2015, a new digital elevation model (DEM)––the Advanced Land Observing Satellite (ALOS) World 3D-30m (AW3D30)––was added to the collection of freely available Earth topography elevation data products [1]. The accuracy assessments indicate that the AW3D30 is in fact the most accurate DEM to date ( among free DEMs) that supersedes the Shuttle Radar Topography Mission (SRTM) data and the Advanced Spaceborne Thermal Emission and Reflection Radiometer––ASTER 2 GDEM (Global Digital Elevation Model) data [2]. According to [1], “This dataset is expected to be useful for scientific research, education, as well as the private service sector that uses geospatial information”. The AW3D30 was photogrammetrically developed using optical imagery collected during the ALOS mission [3]. The aim of this study is to assess the vertical accuracy of the AW3D30 model using the runway method (RWYM) [2,4]. The RWYM was previously used to investigate the accuracy characteristics of the SRTM and ASTER GDEM [2], and more recently, the WorldDEMTM [5]. The same reference dataset of runways used in the WorldDEMTM [5] study was utilized in this project. This eliminates inconsistencies introduced by different reference data; thus, it creates an opportunity to compare the accuracy characteristics of the WorldDEMTM and other DEMs with those of the AW3D30.
Besides producing the standard statistical characteristics of discrepancies between the reference data and the investigated DEM, i.e., the root mean square error (RMSE) of discrepancies in elevation and elevation bias, the RWYM needs to produce a graph––the longitudinal cross-section of runways (profiles)––to visually assess the results. This allows for easy identification of any irregularities in the data. While inspecting these profiles for the AW3D30 data, we identified some irregularities in the data, which include low and high frequency trends and “flat terrain” artefacts. The magnitude of the anomalies is great enough to locally and significantly worsen the otherwise excellent quality of the AW3D30 model. We suspect that these irregularities result from one of the data processing steps of AW3D30. Selected 36 runway centerlines, located mainly in Europe, were used in this project. These
data were sourced from the Global Elevation Data Testing Facility (GEDTF) [6], which was developed based on the airports’ aeronautical data. In order to verify the accuracy of the reference data, we carried out a detailed ground survey of the surface of the data at the airport in Zonguldak in Turkey using the optical levelling method. We found that elevations along the centerline of the runway are accurate to approximately 0.1 m. Hence, we infer that similar elevation accuracy levels of the runways are to be expected on other runways listed in the GEDTF or the European Organization for the Safety of Air Navigation (EUROCONTROL) database [7].
2. Materials and Methods
2.1. AW3D30m Data
ALOS World 3D (AW3D) global DEM data were produced using the data acquired by the Panchromatic Remote Sensing Instrument for Stereo Mapping (PRISM) operated on the ALOS (nicknamed “Daichi”) from 2006 to 2011. The operator of the satellite––the Japan Aerospace Exploration Agency (JAXA)––produced the global DEM using approximately 3 million images. The imaging resolution is 2.5 m, but the DEM was produced at a 5 m resolution which is distributed for a fee. The free version of the DEM, studied here, has 1 arcsec resolution, which is equivalent to approximately 30 m at the Equator. The model is downloadable in 1 × 1 arc degree tiles [1]. The distribution file contains two versions of the data: the “average” and the “median.” The average data were obtained by a resampling of the 5 m model using the averaging kernel, while the median data were produced using the median kernel. The elevations are stored as integers, which are orthometric heights referenced to the Earth Gravitational Model 1996 (EGM96) geoid. The geographic coordinates are referenced to the Geodetic Reference System 1980 (GRS80) ellipsoid. The distribution file also contains a header file, metadata file, and two raster files representing a mask of useful DEM data, as well as a raster file containing the number of stereo pairs used to estimate the elevation of each pixel [1].
The vertical accuracy of the DEM specified by the producer is 5 m (1σ). However, some researchers have showed that the vertical accuracy of the AW3D is 4.10 m [8]. The study presented by [9] provided similar values for RMSE ranging from 4.29 m (built-up areas) to 6.75 m (dense vegetation) based on the differences of 274 reference points.
It should be noted that the AW3D30 model is the digital surface model (DSM) which represents the canopy top and building roofs’ elevations.
2.2. Runway Reference Data
In this project, the runway longitudinal (centerline) profiles were used as elevation reference data. Each profile was represented by 500 samples. These samples were interpolated from the “as constructed” runway profiles used in the project available (by arrangement) from [6]. Since the lengths of runways vary, the sampling distance varied accordingly from 3.2 m to 8 m. Table 1 shows some of the details of the airports and their runways used in this project.
No ID Country ICAO
Code Airport
Length of
Runway Longitude Latitude
10 11 Finland EFHK Helsinki 3440 24° 56' 11" 60° 18' 41" 11 12 France LFML Marseille 3500 5° 11' 50" 43° 26' 57" 12 13 Georgia UGTB Tibilisi 3000 44° 56' 24" 41° 40' 40" 13 15 Germany EDAC Leipzig 2435 12° 29' 56" 50° 58' 34" 14 16 Germany EDDF Frankfurt 4000 8° 32' 3" 50° 1' 39" 15 21 Iran OIIE Teheran Int. 4198 51° 7' 20" 35° 25' 31" 16 22 Italy LIPE Bologna 2803 11° 16' 22" 44° 32' 28" 17 23 Jordan OJAM Marka Int. 3275 35° 58' 34" 31° 57' 59" 18 25 Luxembourg ELLX Luxembourg 4000 6° 11' 15" 49° 37' 4" 19 27 Malta LMML Luqa Int. 3544 14° 28' 44" 35° 51' 23" 20 28 Netherlands EHAM Amsterdam 3500 4° 44' 14" 52° 17' 21" 21 29 Philippines RPLL Manila 3410 121° 0' 5" 14° 29' 55" 22 30 Poland EPWR Wroclaw 2503 16° 51' 57" 51° 6' 32" 23 32 Poland EPSC Szczecin 2500 14° 53' 17" 53° 35' 32" 24 34 Poland EPKK Krakow Balice 2550 19° 46' 5" 50° 4' 31" 25 35 Portugal LPPT Lisbon 3805 -9° 8' 38" 38° 45' 59" 26 36 Puerto Rico TJIG Fernando 1621 -66° 6' 21" 18° 27' 21" 27 37 Romania LROP Bucharest 3500 26° 4' 36" 44° 33' 53" 28 38 Slovakia Rep. LZKZ Kosice 3100 21° 14' 11" 48° 38' 58" 29 39 Slovenia LJLJ Ljubljana 3300 14° 26' 25" 46° 13' 57" 30 40 Spain LEMD Madrid 3060 -3° 34' 34" 40° 29' 6" 31 41 Spain LEBL Barcelona El 3352 2° 4' 19" 41° 17' 41" 32 42 Sweden ESMS Malmö Sturup 2800 13° 22' 26" 55° 32' 53" 33 43 Switzerland LSZH Zurich Kloten 3300 8° 32' 10" 47° 28' 56" 34 44 Turkey LTBA Ataturk 3000 28° 48' 31" 40° 59' 47" 35 45 Turkey LTBJ Menderes 3240 27° 9' 10" 38° 18' 24" 36 47 United States KLGA La Guardia 2134 -73° 52' 43" 40° 46' 56"
An estimated vertical accuracy of samples of the runway profiles is 0.5 m, which, in some cases, is provided by the aeronautical data on runways.
An example of the Aerodrome Obstacle Chart [10] for runway 14-32 at Zurich Kloten Airport (LSZH) in Switzerland is included in the online material. This type of chart was a primary source for data on the runway profiles.
2.5. AW3D30 Profiles
The AW3D30 profile data were extracted from the AW3D30 raster by the bilinear interpolation method using ArcMap GIS software (Esri, Redlands, CA, USA). Each sample is coincidental with the sample of the reference runway profiles.
2.6. Data Processing
The RWYM was first introduced by Becek [4] in 2008. Information about the method will be outlined in this section. The RWYM assumes that the magnitude of the uncertainty of a DEM is controlled by three independent phenomena: instrument-induced error, environment-induced error, and error due to the discretization of the terrain surface target-induced error. This could be written as demonstrated by Equation (1):
where ∗ is the variance of error of the DEM (DEM) and the instrument-induced (I),
environment-induced (E), and target-induced (T) error.
The second fundamental assumption of the RWYM is that the target-induced error (T) due to the discretization of the topographic surface can be calculated for each pixel. The target-induced error can be calculated using Equation (2) [4]:
=121 , (2)
where is the DEM pixel size, and s is the terrain slope at a particular pixel.
As can be seen in Equation (2), the target-induced error is equal to 0 for the horizontal surface (s
= 0). The RWYM uses this information in the following way: To estimate the instrument- and environment-induced errors (which are random) of a DEM, it would be sufficient to compare the DEM with some accurate reference elevation data over a horizontal surface (slope = 0). Having the estimates of the instrumental- and environment-induced errors, one can calculate the total DEM error at each pixel using Equations (1) and (2). In this project, the profile of runways is used as the elevation reference data because runways are constructed as horizontal surfaces with allowable slopes, depending on the class of the airport, below 2%. Also, the data on runways are in the public domain and, therefore, are free and easily obtained [5].
In order to estimate the instrument- and environment-induced errors the following steps were followed:
1. For each of the 36 runways, and for each of 500 samples within each profile, the difference di = hDEM - hR; i = 1,…,500, where hDEM and hR are elevations of corresponding samples on DEM and profile, respectively, were calculated;
2. The mean difference Dj = ∑di/500; i = 1,…,500, j = 1,…,36, was calculated for each runway;
3. The standard deviation σj; j = 1,…,36, of the differences was calculated; and
4. The RMSEj; j = 1,…,36 of the differences was calculated using the following well-known formula:
= + , = 1, … ,36; (3)
5. Overall mean of differences, mean standard deviation and mean RMSE were also calculated;
6. A histogram of all differences was calculated; and
7. The Laplace probability density function (pdf) was calculated according to Equation (4):
; , = | |. (4)
where m is the location parameter, and a is the scale or diversity parameter. The maximum likelihood estimator of m is the median, and the maximum likelihood estimator of a is given by Equation (5) [5]:
= ∑ | − |, (5)
where n is the number of samples (36 x 500 = 18,000 samples) and m is the median of the differences.
3. Results
Table 2 of [5] for ease compactions between current and former studies. Assuming the outliers’ level to be 2.7 x 1.86 m (average RMSE) = 5.02 m, one can conclude that there are no outliers present in this test. The extreme differencesare found to be -6.55 m (underestimation) for the Brussels National Airport (EBBR) in Belgium, and 8.45 m (overestimation) for the Lisbon Airport (LPPT) in Portugal. While in the former case the underestimation is an “accidental sink” in the profile, the latter appears to be more systematic (see online material for more data).
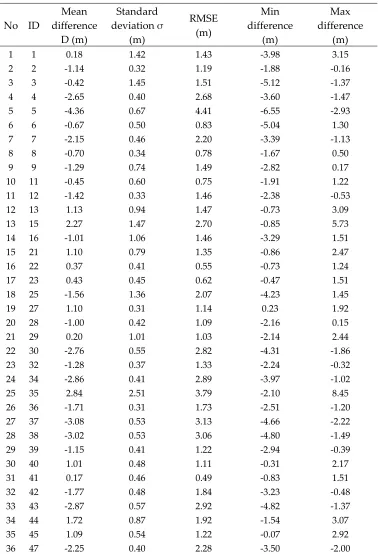
Table 2. Statistics of the differences between the AW3D30 profiles and the reference profiles for 36 runways.
No ID
Mean difference
D (m)
Standard deviation σ
(m)
RMSE (m)
Min difference
(m)
Max difference
(m)
1 1 0.18 1.42 1.43 -3.98 3.15
2 2 -1.14 0.32 1.19 -1.88 -0.16
3 3 -0.42 1.45 1.51 -5.12 -1.37
4 4 -2.65 0.40 2.68 -3.60 -1.47
5 5 -4.36 0.67 4.41 -6.55 -2.93
6 6 -0.67 0.50 0.83 -5.04 1.30
7 7 -2.15 0.46 2.20 -3.39 -1.13
8 8 -0.70 0.34 0.78 -1.67 0.50
9 9 -1.29 0.74 1.49 -2.82 0.17
10 11 -0.45 0.60 0.75 -1.91 1.22
11 12 -1.42 0.33 1.46 -2.38 -0.53
12 13 1.13 0.94 1.47 -0.73 3.09
13 15 2.27 1.47 2.70 -0.85 5.73
14 16 -1.01 1.06 1.46 -3.29 1.51
15 21 1.10 0.79 1.35 -0.86 2.47
16 22 0.37 0.41 0.55 -0.73 1.24
17 23 0.43 0.45 0.62 -0.47 1.51
18 25 -1.56 1.36 2.07 -4.23 1.45
19 27 1.10 0.31 1.14 0.23 1.92
20 28 -1.00 0.42 1.09 -2.16 0.15
21 29 0.20 1.01 1.03 -2.14 2.44
22 30 -2.76 0.55 2.82 -4.31 -1.86
23 32 -1.28 0.37 1.33 -2.24 -0.32
24 34 -2.86 0.41 2.89 -3.97 -1.02
25 35 2.84 2.51 3.79 -2.10 8.45
26 36 -1.71 0.31 1.73 -2.51 -1.20
27 37 -3.08 0.53 3.13 -4.66 -2.22
28 38 -3.02 0.53 3.06 -4.80 -1.49
29 39 -1.15 0.41 1.22 -2.94 -0.39
30 40 1.01 0.48 1.11 -0.31 2.17
31 41 0.17 0.46 0.49 -0.83 1.51
32 42 -1.77 0.48 1.84 -3.23 -0.48
33 43 -2.87 0.57 2.92 -4.82 -1.37
34 44 1.72 0.87 1.92 -1.54 3.07
35 45 1.09 0.54 1.22 -0.07 2.92
Mean -0.88 0.70 1.86 -6.55 (min) 8.45 (max)
Appendix A contains graphs of elevation differences for the investigated runways. It should be noted that the length of the profiles are normalized. A closer inspection of the graphs allows for the conclusion that the elevation differences are subject to not only random types of signals, but also other types including the following:
• High frequency jitter-type signals; • “Washed out” areas’ signals; and • Low frequency signals.
Examples for the types of signals in the graphs of the elevation differences are shown in Figure 1. Pane A) in Figure 1 illustrates the high frequency signal which appears to be modulated with a low frequency signal. Pane B) shows a high frequency signal. Pane C) illustrates the washed out areas type of signal. Pane D) illustrates a combination of the above three types of signals.
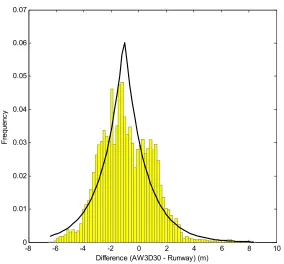
Figure 2 shows a histogram for the differences in elevation for all the runways combined. The Laplace probability density function (PDF) graph is also shown, i.e., Equation (4). The parameters of the PDF were calculated from the difference in elevations using Equation (5). The location parameter
m = -1.069, and the scale parameter a = 1.535. A multimodal feature of the histogram is clearly visible, which is most likely due to the identified signals in the differences in elevations.
Figure 2. Histogram for the differences (AW3D30 minus reference). The Laplace pdf graph is also included. It was produced using the location parameter m = -1.069 and the scale a = 1.535, estimated from the elevation differences data. A multimodal feature of the histogram is clearly visible.
4. Discussion
The results for the investigation of the vertical accuracy of the AW3D30 DSM’s unambiguity support a statement that the AW3D30 is the most accurate DSM among other similar data elevation products, including ASTER 2 and SRTM-3”. In terms of accuracy, it is comparable to the commercial product WorldDEMTM. Table 3 shows the accuracy parameter estimates of these models. To avoid any potential bias of different reference datasets, the AW3D30 and the WorldDEMTM models were tested on the same set of runways. However, not all of the runways from the previous projects were used in the present project. Only 36 out of 47 (approximately 77%) previously used runways were covered by useful AW3D30 data. This figure is consistent with the fact that only images with cloud cover less than 30% were used to produce the AW3D30 model [11].
Table 3. Statistics for the differences between the AW3D30 profiles and the reference profiles for 36 runways. For illustration purposes, the corresponding statistics for ASTER 2, SRTM-3”, and WorldDEMTM obtained using the RWYM are also shown. Note that this is the instrument-induced component of the elevation error of the DEM only.
DEM
Mean difference D (m)
Mean standard deviation σ (m)
RMSE (m)
LE95 RMSE (m)
Pixel (“)
AW3D30 -0.78 0.69 1.78 3.49 1
ASTER-2 -3.6 7.3 8.14 15.95 1
SRTM-3” -1.7 2.2 2.78 5.45 3
WorldDEMTM -0.58 0.91 1.68 3.29 0.4
It should also be noted that the accuracy of the AW3D30 model is comparable to that of the WorldDEMTM (RMSE 1.78 m vs. 1.68 m), but the superiority of the latter is fully revealed over the rough terrain because of the higher spatial resolution (1 arcsec vs. 0.4 arcsec) of the WorldDEMTM
-8 -6 -4 -2 0 2 4 6 8 10
0 0.01 0.02 0.03 0.04 0.05 0.06 0.07
Difference (AW3D30 - Runway) (m)
F
requen
product. The higher spatial resolution causes a smaller target-induced error (see Equation 2). This also illustrates a problem of how to compare the accuracy of the DEMs of various spatial resolutions. The AW3D30 model exhibits a negative bias of -0.78 m, which translates to the underestimation of the elevation. This negative elevation bias is present for the models shown in Table 2. Since this effect is consistent for both synthetic aperture radar (SAR)-interferometry-derived models (SRTM-3” and WorldDEMTM) and photogrammetrically-derived models (AW3D30 and ASTER 2), it has currently been investigated in a separate project currently being executed by our team. In this context, it should be noted that a separate investigation of the vertical accuracy of the AW3D30 [11] (Table 3a-d) has identified a negative bias of elevations, meaning that the AW3D30 is below the SRTM-3” model (itself exhibiting the negative elevation bias of -1.7 m). A negative bias of the magnitude, consistent with our study, has been reported in [12] Table 6. The authors used the light detection and ranging (LiDAR)-derived DSM. The obtained elevation bias using the SRTM and the Ice, Cloud, and land Elevation Satellite (ICESat) as reference data was both negative and positive, oscillating around zero. This should be interpreted in the context of the known negative bias of the SRTM and ICESat data. Authors [12] also used ground control points (GCPs) derived from global position system (GPS) tracks and obtained a positive bias of approx. 2 m. This is understandable considering the fact that a GPS track normally follows a transportation line which is usually located above the surrounding terrain. An extensive study carried out in the Philippines [9] found the bias significantly positive (assuming the following subtraction: AW3D30 - GCPs). The most likely reason for this is that any type of land cover, except bare land, is elevated above the terrain surface (GCP level). This high positive elevation bias contributed to the RMSE level of the experiment which was slightly above 5 m. The RMSE level of the AW3D30 obtained using LIDAR DSM [12] was 2.17 m, which is consistent with the result of this study (1.78 m).
The unusual appearance of the graphs in Figure 1 (see online material for more data) suggests that a random error signal is conflated with both sensor-side and/or data processing uncompensated effects. We speculate that the high frequency jitter-type signal might be due to some vibration of the sensor. This phenomenon is similar to that described in [13], and it was successfully compensated for by using an extra data processing step.
The washed up signal is probably due to the round-off operation performed during the resampling step of the high resolution (AW3D 5 m) model to the AW3D30 version. We believe this problem could be easy corrected; it would require at least partial reprocessing of data.
The third type of signal––the low frequency trend––in this particular case, runway 11-29 at Tehran International Airport (OIIE), is caused by insufficient details on the runway profile. A deficiency in runway data is rare and can easily be detected by a simple visual inspection of the plot for elevation differences. On the other hand, a visual inspection of the elevation differences can help maintain the currency, accuracy, and integrity of the runway database, e.g., GEDTF [6]. However, it could be used to verify the accuracy of some of the aviation safety-critical data, e.g., on runways.
The histogram for the elevation differences shown in Figure 2 should resemble the Laplace PDF. However, the shape of the histogram only partially matches the theoretical PDF. The reason for this multi-modal appearance of the histogram is the presence in the elevation differences of the washed out and jitter-types of signals. A histogram for elevation differences free of these types of signals should be similar to the histogram shown in Figure 3 [5].
Due to the fact that the vertical and horizontal accuracy of the runway data is higher than any previously used reference elevation data including ICESat, SRTM (except LiDAR DEM), the results presented here can be considered as the absolute vertical accuracy estimates of the current version of the AW3D30.
5. Conclusions
• The instrumental-induced component of the vertical accuracy of the AW3D30 DSM is comparable with that of the WorldDEMTM DSM. The RMSE is equal to 1.78 m. However, the target-induced component of the vertical accuracy of the AW3D30 is lower than that of the WorldDEMTM.
• The AW3D30 DSM is contaminated by at least two types of noise: the high frequency probably due to the instability of the data acquisition system, and the washed out signal which is probably due to data processing issues. It can be anticipated that after removing these signals, the accuracy of the AW3D30 would increase noticeably.
• The AW3D30 DSM exhibits a negative vertical bias of approx. 0.78 m. The cause of this bias is unknown. A separate study of the effect is being considered.
• The elevation data obtained through photogrammetrically processing the satellite stereo imagery are already accurate enough to, at least, identify errors in other types of elevation data, including the runway data.
Supplementary Materials: The following are available online, Figures 1 to 36: Plots of elevation differences for 36 runways considered in the project.
Author Contributions: K.B. conceived and designed the experiment; M.O. and C.B. helped with data processing and writing the manuscript, C.M. edited the manuscript.
Conflicts of Interest: The authors declare no conflict of interest.
References
1. ALOS Global Digital Surface Model "ALOS World 3D - 30m" (AW3D30). http://www.eorc.jaxa.jp/ALOS/en/aw3d30/ (accessed on 1 August 2017).
2. Becek, K. Assessing global digital elevation models using the runway method: The advanced spaceborne thermal emission and reflection radiometer versus the shuttle radar topography mission case. IEEE Trans.
Geosci. Remote Sens. 2014, 52, 4823–4831, DOI. 10.1109/TGRS.2013.2285187.
3. Tadono, T.; Nagai, H.; Ishida, H.; Oda, F.; Naito, S.; Minakawa, K.; Iwamoto, H. Generation of the 30 m-Mesh Global Digital Surface Model by ALOS PRISM. Int. Arch. Photogramm. Remote. Sens. Spat. Inf. Sci. 2016,
XLI-B4, 157-162, DOI. 10.5194/isprs-archives-XLI-B4-157-2016.
4. Becek, K. Investigating error structure of shuttle radar topography mission elevation data product. Geophys.
Res. Lett. 2008. 35, L15403, DOI. 10.1029/2008GL034592.
5. Becek, K.; Koppe, W.; Kutoğlu, Ş.H. Evaluation of Vertical Accuracy of the WorldDEM™ Using the Runway Method. Remote Sens. 2016, 8, 934, DOI. 10.3390/rs8110934.
6. Global Elevation Data Testing Facility. Available online: http://gedtf.org/ (accessed on 22 Aug. 2017). 7. EUROCONTROL. The European Organisation for the Safety of Air Navigation. Available online:
https://www.ead.eurocontrol.int/eadcms/eadsite/index.php.html (accessed on 22 Aug. 2017).
8. Tadono, T.; Takaku, J.; Tsutsui, K.; Oda, F.; Nagai, H. Status of ALOS World 3D (AW3D) global DSM generation. IEEEInt. Geosc. Remote. Sens. Symp. 2015, DOI. 10.1109/IGARSS.2015.7326657.
9. Santillana, J.R; Makinano-Santillana, M. Vertical Accuracy Assessment of 30-M Resolution ALOS, ASTER, and SRTM Global DEMs Over Northeastern Mindanao, Philippines. Int. Arch. Photogramm. Remote. Sens.
Spat. Inf. Sci. 2016, XLI-B4, 149-156. DOI. 10.5194/isprsarchives-XLI-B4-149-2016.
10. Aerodrome Obstacle Chart — ICAO Type A (Operating Limitations). Available online: http://www.gcaa.com.gh/reg/?page_id=3853#toc-21-3-8-aeronautical-data (accessed on 22 Aug. 2017). 11. Tadono, T.; Ishida, H.; Oda, F.; Naito, S.; Minakawa, K.; Iwamoto, H. Precise Global DEM Generation by
ALOS PRISM. ISPRS Ann. Photogramm. Remote Sens. Spat. Inf. Sci.2014, II-4, 71-76, DOI.10.5194/isprsannals-II-4-71-2014.
12. Takaku, J.; Tadono, T.; Tsutsui, K. Generation of High Resolution Global DSM from ALOS PRISM. Int. Arch.
Photogramm. Remote. Sens. Spatial Inf. Sci. 2014, XL-4, 243-248, DOI: 10.5194/isprsarchives-XL-4-243-2014.