Available Online at www.ijcsmc.com
International Journal of Computer Science and Mobile Computing
A Monthly Journal of Computer Science and Information Technology
ISSN 2320–088X
IMPACT FACTOR: 6.017
IJCSMC, Vol. 6, Issue. 12, December 2017, pg.7 – 14
Efficient Methods used to
Extract Color Image Features
Mohd Ashraf Zoghoul
(Albalqa Applied University)Saleh Khawatreh
(Alahlyyia Amman University)Ziad A. Alqadi
(Albalqa Applied University)Abstract: This paper produces efficient methods, which can be used to extract color image features. These
features can be used as a color image key or signature to retrieve or to recognize color image. The methods
will be tested and implemented and the extracted features will be passed to artificial neural network for color
image recognition. The experimental results of the introduced methods will be compared in order to select the
optimal method, which provides the highest efficiency.
Keywords: Image features, LBP, CSLBP, RLBP, Extreme, speed up.
1- Introduction
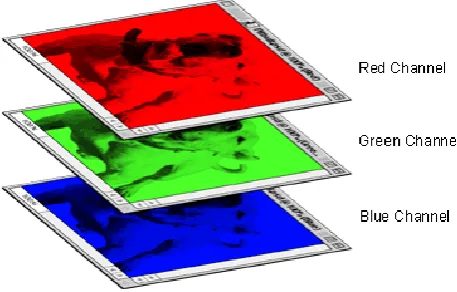
Digital color image is a 3D matrix, one dimension for each of the three colors (Red, Green, and Blue) which
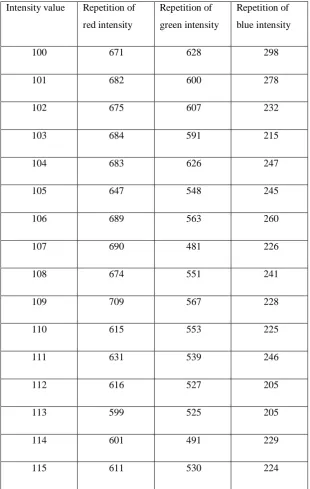
Color image can be represented by 3 histograms, each of them is an array of 256 entries, and each entry points
to the number of repetition of intensity value which is equal to the array index [3, 4, and 5]. Table (1) shows
samples of these histograms for peppers.png color image, while figure (2) shows a color image with the colors
histograms.
Table (1): Histograms samples
Intensity value Repetition of
red intensity
Repetition of
green intensity
Repetition of
blue intensity
100 671 628 298
101 682 600 278
102 675 607 232
103 684 591 215
104 683 626 247
105 647 548 245
106 689 563 260
107 690 481 226
108 674 551 241
109 709 567 228
110 615 553 225
111 631 539 246
112 616 527 205
113 599 525 205
114 601 491 229
Color image
0 200 400
Red histogram
0 100 200
0 200 400
Green histogram
0 100 200
0 200 400 600
Blue histogram
0 100 200
Figure (2): Color image and colors histogram
Histogram method can be used to create color image features [5, 6, and 8] but this method has a lot of the
following disadvantages if we want to use the feature for color image recognition:
- Three features array are needed, one for each color.
- Each feature array is big in size (256 elements).
- The architecture of artificial neural network needed to recognize the image is sophisticated and has an
input layer with 768 neurons (256*3) [13, 14, and 15].
- High time for feature extraction, and high time for image recognition [16], and this will lead to poor
efficiency of the recognition system.
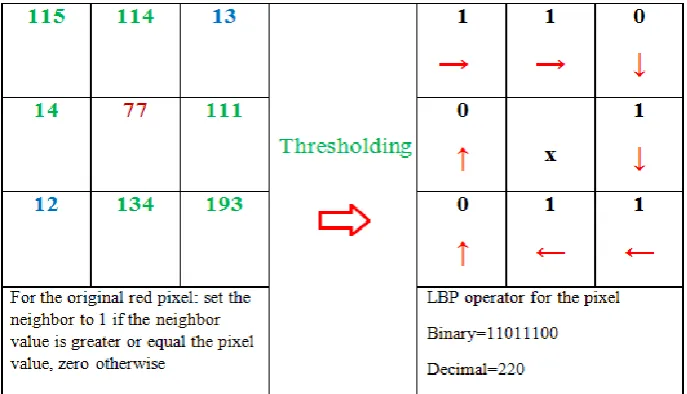
Another method is now used for image feature extraction, this method is called local binary pattern (LBP), [7,
LBP method creates a 256 entry feature array for each color and suffer from the same mentioned above
disadvantages, thus we cannot recommend this method for color image recognition.
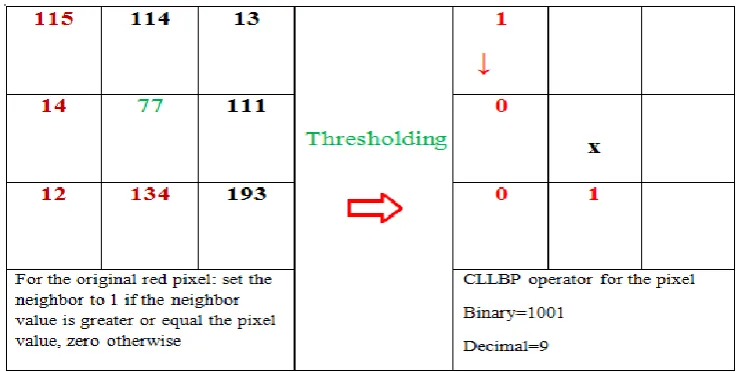
A version of LBP method is Centre-symmetric local binary patterns (CSLBP), which creates a feature array of 16 elements [10, 11, and 12] (see figure (4)). Using this method can minimize the negative effects of the above mentioned disadvantages, but the feature array size still not small, so we have to seek a better method for color
image feature extraction.
Figure (4): Calculating CSLBP operator
2- Proposed Methods
Method 1: Reduced LBP (RLBP) method
This method uses the idea used in LBP and CSLBP methods and based on the neighbor pixels to calculate the
feature, but it reduces the number of entries in the color image feature array to 4 and it can be implemented
applying the following steps:
1) Get the color image.
2) Reshape the 3D color image to 2D image.
3) Initialize the feature array to zero(F(1:4)-0).
4) For each pixel (P(i, j)) in the 2D image do the following:
A. Calculate a threshold value T as follows:
T = (P(i,j+1) + P(i+1, j)+P(i,j-1)+P(i-1,j)+P(i+1,j+1)+P(i+1,j-1)+ P(i-1, j-1)+P(i-1,j+1)-8*P(i,j))/9; B. Calculate the logical variables a and b as follows:
D. Increment the array index by 1(F(I)=F(I)+1) 5) Save F in an input data set which can be passed to ANN.
Method 2: Extreme points method (EPM)
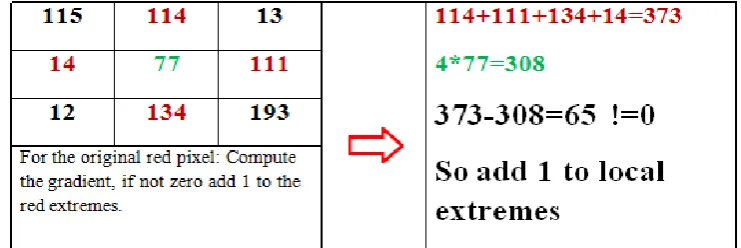
This proposed method is based on finding the edges of the image (local extremes), and it uses the magnitude of the gradient to calculate the extremes, which are used here to create the image features [17].
Local extreme for each pixel can be calculated as shown in figure (5):
Figure (5): Calculating local extreme
For each color, summation the local extremes gives the color feature, thus we reduce the color image features to
3.
This method can be implemented applying the following steps:
1) Get the color image.
2) Extract the red, green, and blue components.
3) For each component initializes extreme counter to zero.
4) For each pixel in each component calculate the gradient as shown in figure (5).
5) If the gradient not equal zero add 1 to the local extreme.
6) Save the local extremes as a color image features.
3- Implementation and Results Discussion
The suggested above two methods were implemented using different color images.
The results of implementing the proposed EPM method are shown in table (2), while the results of
Table (2): EPM results
Image # Size Features Extraction time(sec)
1 384 x 512x3 17523 61386 56601 0.044843
2 770 x 1026x3 694 3219 3080 0.098481
3 168x 300x3 18904 9864 17804 0.009357
4 183x 275x3 10896 9751 14424 0.007565
5 172x 293x3 7633 3015 7589 0.006089
6 1200 x1800x3 43042 53641 67571 0.290760
7 183x275x3 12617 11661 23666 0.008232
8 1600x 2560x3 410846 424635 1263057 0.589395
9 183x275x3 15832 7805 23059 0.008587
10 1200x 800 x3 6686 13070 24840 0.120215
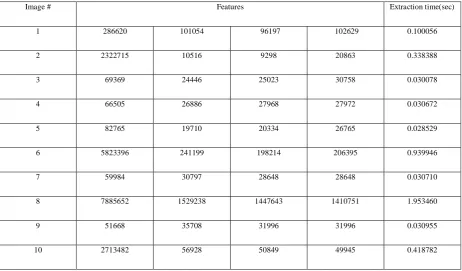
Table (3): RLBP method results
Image # Features Extraction time(sec)
1 286620 101054 96197 102629 0.100056
2 2322715 10516 9298 20863 0.338388
3 69369 24446 25023 30758 0.030078
4 66505 26886 27968 27972 0.030672
5 82765 19710 20334 26765 0.028529
6 5823396 241199 198214 206395 0.939946
7 59984 30797 28648 28648 0.030710
8 7885652 1529238 1447643 1410751 1.953460
9 51668 35708 31996 31996 0.030955
10 2713482 56928 50849 49945 0.418782
From the obtained results we can see that each method creates a unique feature array for each color image, thus
EPM has and advantages comparing with RLBP method and these advantages can be summarized in:
Feature array size equal 3 instead of 4 for RLBP method
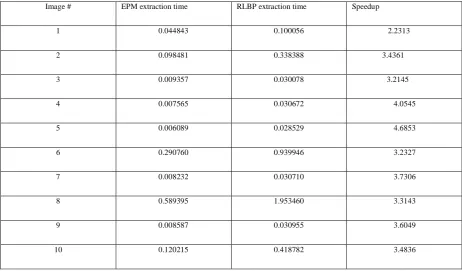
EPM is more efficient in extracting color image features and has a speed up always greater than 1 as
shown in table (4).
Table (4): Speed up of EPM
Image # EPM extraction time RLBP extraction time Speedup
1 0.044843 0.100056 2.2313
2 0.098481 0.338388 3.4361
3 0.009357 0.030078 3.2145
4 0.007565 0.030672 4.0545
5 0.006089 0.028529 4.6853
6 0.290760 0.939946 3.2327
7 0.008232 0.030710 3.7306
8 0.589395 1.953460 3.3143
9 0.008587 0.030955 3.6049
10 0.120215 0.418782 3.4836
Conclusion
Color image recognition systems require an efficient method of color image feature extraction method. EPM
and RLBP methods for color image features extraction were proposed, tested and implemented, both methods
gave a unique feature array for each color image. EPM method can be used reduce the feature array element and
enhance the recognition cycle by minimizing the extraction time and minimizing ANN architecture by
minimizing the number of input layer neuron to 3.
References
[1] Dr. Ziad A.AlQadi, Dr. Hussein M.Elsayyed, Window Averaging Method to Create a Feature Victor for RGB Color Image, IJCSMC, Vol. 6, Issue. 2, February 2017, pg.60 – 66.
[2] Jihad Nader, Ziad A. A. Alqadi, Bilal Zahran, Analysis of Color Image Filtering Methods, International Journal of Computer Applications (0975 – 8887) Volume 174 – No.8, September 2017.
[3] Majed O. Al-Dwairi, Ziad A. Alqadi, Amjad A. AbuJazar and Rushdi Abu Zneit, Optimized True-Color Image Processing, World Applied Sciences Journal 8 (10): 1175-1182, 2010 ISSN 1818-4952.
[6] Dr. Ziad A.AlQadi, Dr. Hussein M.Elsayyed, Window Averaging Method to Create a Feature Victor for RGB Color Image, IJCSMC, Vol. 6, Issue. 2, February 2017, pg.60 – 66.
[7] Guo Z, Zhang L, Zhang D (2010) A completed modeling of local binary pattern operator for texture classification. IEEE Trans Image Process 19(6):1657–1663.
[8] Gaurav Mandloi,A Survey on Feature Extraction Techniques for Color Images, Gaurav Mandloi / (IJCSIT) International Journal of Computer Science and Information Technologies, Vol. 5 (3) , 2014, 4615-4620.
[9] KRYSTIAN MIKOLAJCZYK,TINNE TUYTELAARS, “Local Image Features”, Universiteit Leuven, KasteelparkArenberg 10, Leuven,Belgium.
[10] Hong X, Zhao G, Pietikainen M, Chen X (2014) Combining LBP difference and feature correlation for texture description. IEEE Transactions on Image Processing 23(6):2557–2668.
[11] Gupta R, Patil H, Mittal A (2010) Robust order-based methods for feature description. In: 2010 IEEE conference on computer vision and pattern recognition (CVPR).
[12] Hanane. Rami, Mohammed. Hamri, Lhoucine. Masmoudi, Objects Tracking in Images Sequence Using
Center-Symmetric Local Binary Pattern (CS-LBP), International Journal of Computer Applications Technology and Research Volume 2– Issue 5, 504 - 508, 2013.
[13] Khaled M. Matrouk, Haitham A. Alasha'ary, Abdullah I. Hasanat, Ziad A. Qadi, Hasan M. Al-Shalabi, Investigation and Analysis of ANN Parameters, European Journal of Scientific Research, ISSN 1450-216X / 1450-202X Vol.121 No.2, 2014, pp.217-225.
[14] T. Kohonen, 1988. “An Introduction to Neural Computing”, Neural Networks 1, pp. 3-16.
[15] R. Hecht-Nielsen, 1987. “Counter-Propagation Networks”, Proceedings of the IEEE First International Conference on Neural Networks, pp. 19-32.
[16] Dr. Ghazi. M. Qaryouti, Prof. Ziad A.A. Alqadi, Prof. Mohammed K. Abu Zalata,A Novel Method for Color Image Recognition, IJCSMC, Vol. 5, Issue. 11, November 2016, pg.57 –64.