doi:10.1136/bmj.325.7356.131
2002;325;131-134
BMJ
Chris Power, Orly Manor and Leah Li
structure and height selection in a cohort study
social position? Effects of changing social
Are inequalities in height underestimated by adult
http://bmj.com/cgi/content/full/325/7356/131
Updated information and services can be found at:
These include:
Data supplement
http://bmj.com/cgi/content/full/325/7356/131/DC1
"Two figures"
References
http://bmj.com/cgi/content/full/325/7356/131#otherarticles
11 online articles that cite this article can be accessed at:
http://bmj.com/cgi/content/full/325/7356/131#BIBL
This article cites 9 articles, 7 of which can be accessed free at:
Rapid responses
http://bmj.com/cgi/eletter-submit/325/7356/131
You can respond to this article at:
http://bmj.com/cgi/content/full/325/7356/131#responses
at:
4 rapid responses have been posted to this article, which you can access for free
service
Email alerting
the top left of the article
Receive free email alerts when new articles cite this article - sign up in the box at
Topic collections
(2921 articles)
Sociology
(3335 articles)
Health service research
(6901 articles)
Epidemiologic studies
(4129 articles)
Health policy
Articles on similar topics can be found in the following collections
Notes
To order reprints follow the "Request Permissions" link in the navigation box
go to:
BMJ
The authors are indebted to Sandra Hills, Fiona McRae, and Elizabeth Fowler, City of Whitehorse, for project coordination; Barbara Fox, Kate Edwards-Coghill, Maria McKinnon, Renee Bush, Dianne Clay, and Sue Morton for home visits and assess-ments; Sue Vincent for developing and supervising the exercise programme and the leaders of the exercise class for implement-ing it; Margaret Stevens and Nicole Bennet of the Injury Control Council of Western Australia for providing the Falls Project Home Hazard Assessment protocols; City of Whitehorse home maintenance staff for help with home modifications; Jane Matthews of the Statistical Centre and Peter MacCallum of the Cancer Institute, Melbourne, for use of the RANDOM software; and study participants for their contribution.
Contributors: See bmj.com
Funding: This work was funded by the National Health and Medical Research Council (Commonwealth Department of Health and Aged Care), Victorian Department of Human Serv-ices (Aged Care), City of Whitehorse, Victorian Health Promo-tion FoundaPromo-tion, Rotary, and the NaPromo-tional Safety Council.
Competing interests: None declared.
1 Feder G, Cryer C, Donovan S, Carter Y on behalf of the guidelines’ devel-opment group. Guidelines for the prevention of falls in people over 65.
BMJ2000;321:1007-11.
2 Campbell AJ, Robertson CM, Gardner MM, Norton RN, Buchner DM. Psychotropic medication withdrawal and a home based exercise programme to prevent falls: a randomised controlled trial.J Am Geriatr Soc1999;47:850-3.
3 Cummings RG, Thomas M, Szonyi G, Salkeld G, O’Neill E, Westbury C, et al. Home visits by an occupational therapist for assessment and modi-fication of environmental hazards: a randomised trial of falls prevention.
J Am Geriatr Soc1999;47:1397-402.
4 Pfieffer E. A short portable mental status questionnaire for the assessment of organic brain deficit in elderly patients.J Am Geriatr Soc
1975;23:433-41.
5 Lawton MP, Moss M, Fulcomer M, Kleban MH. A research and service oriented multilevel assessment instrument.J Gerontol1982;37:91-9. 6 Hill KD, Schwarz JA, Kalogeropoulos AJ, Gibson SJ. Fear of falling
revis-ited.Arch Phys Med Rehabil1996;77:1025-9.
7 Buchner DM, Cress ME, de Lateur BJ, Esselman PC, Margherita AJ, Price R, et al. The effect of strength and endurance training on gait, balance, fall risk, and health services use in community-living older adults.J Gerontol A Biol Sci Med Sci1997;52:M218-25.
8 Campbell AJ, Robertson CM, Gardner MM, Norton RN, Tilyard MW, Buchner DM. Randomised controlled trial of a general practice programme of home based exercise to prevent falls in elderly women.
BMJ1997;315:1065-9.
(Accepted 2 January 2002)
Are inequalities in height underestimated by adult social
position? Effects of changing social structure and height
selection in a cohort study
Chris Power, Orly Manor, Leah Li
Abstract
ObjectivesTo investigate whether changing social structure and social mobility related to height generate (inflate) inequalities in height.
DesignLongitudinal 1958 British birth cohort study.
SettingEngland, Scotland, and Wales.
Participants10 176 people born 3-9 March 1958 for whom data were available at age 33 years.
Main outcome measuresAdult height and social class at age 33 years; class of origin (father’s occupation when participant was 7 years old).
ResultsAdult height showed a social gradient with class at age 7 years and age 33 years. The difference in mean height between extreme groups was greater for class of origin than for adult class, reducing from 2.21 cm to 1.62 cm for men and from 2.18 cm to 1.74 cm for women. This narrowing inequality was due mainly to a decrease in mean height in classes I and II. This was because of the pattern of height related social mobility in which, for example, men moving into classes I and II were taller (mean 177.2 cm) than men remaining in class III manual (mean 176.1 cm) yet shorter than men with class I and II origins (mean 178.3 cm) and the relatively large number of individuals moving into classes I and II. Changes in the structure of society, seen here with the general trend of upward social mobility, have acted to diminish inequalities in adult height.
ConclusionsThe combination of changing social structure and height related mobility constrains, rather than inflates, inequalities in height and may lead to an underestimation of the role of childhood socioeconomic factors in the development of inequalities in adult disease.
Introduction
Inequalities in health are a key priority in public health, but there is controversy over the possible courses of action that might be taken to reduce them.1 2
Fundamental to the question of solutions is the question of causes, and opinion has changed over recent decades as to how inequalities develop. At the time of the Black report some argued that inequalities were created by health selection—that is, social sorting linked to health—whereby individuals with poorer health are more downwardly mobile and those with better health are more upwardly mobile.3
Alternatively, inequalities could be an artefact of social classification3:
as class V declines in size it becomes a more extreme group and its mortality a less important social indicator. Hence, a rise in mortality relative to that of other classes might reflect a smaller group of individu-als rather than greater social inequality. Both health selection and artefact of social classification were expected to inflate health differences.3
It is now accepted that selection and artefact are not primary explanations for inequalities in most health outcomes,4 5
although we still know little about the strength and direction of their effect. We assessed whether changes in the structure of society (artefact) and health related social mobility (selection) generate— that is, act to inflate—inequalities in health. We based our study on adult height, which has two advantages. Firstly, shorter adult stature is a well established predic-tor of cardiorespirapredic-tory disease later in life in men and women6–10
and is therefore a useful health indicator. Secondly, height has a particular value here because once adult stature is reached it changes little, at least in early adulthood, though from late middle age there is a
Two figures illustrating the data in the tables can be found on bmj.com Centre for Paediatric Epidemiology and Biostatistics, Institute of Child Health, London WC1N 1EH Chris Power
professor
Leah Li
statistical research fellow
School of Public Health and Community Medicine, Hebrew University, Hadassah, PO Box 12272, Jerusalem 91120, Israel Orly Manor
senior lecturer
Correspondence to: C Power
trend of increasing “shrinkage.”11
With a fixed health measure, the time sequence between health status and social position is more easily disentangled. We used data from the 1958 British birth cohort12
with information on height and social position in childhood and adulthood to investigate inequalities in height.
Methods
Study sample—The 1958 birth cohort includes all children born in England, Wales, and Scotland from 3-9 March 1958.13
We obtained information on 98% (about 17 000) from a target of 17 733 births enrolled in the perinatal mortality survey. Participants have been followed from birth through to age 41 years. With 11 405 (73% of the target population in 1991) responding at age 33 years, the sample size has reduced over the period of the study, although biases are regarded as small.12
We examined the representa-tiveness of the samples used here, which rely on data for age 7 and 33 years, and found that 23.3% (men) and 23.0% (women) were from classes IV and V at age 7 compared with 24.3% of the full sample. Individuals included in our analyses are therefore representative of the original national study with respect to social class.
Measures—Interviewers measured participants’ height at 33 years. All measurements were done with participants in erect standing posture to obtain maximum standing height. We measured height once using a stadiometer and reading to the nearest centimetre. Social class when the participant was aged 7 years was based on father’s occupation in 1965 and at age 33 on the participant’s own current or most recent occupation in 1991, categorised as I and II
(professional/managerial), III non-manual (skilled non-manual), III manual (skilled manual), and IV and V (semiskilled or unskilled manual).
Data analysis—We calculated mean adult height according to class at age 7 and 33 for men and women separately. Differences between the extreme social classes are indicated with 95% confidence intervals. We estimated a slope of inequality using simple linear regression with height and social class as continuous variables, assuming equal spacing between the four social classes. We calculated mean adult height for socially mobile groups, distinguishing between groups moving in and out of each class (that is, inflow and out-flow mobility) separately for each sex. We used a linear model to estimate differences in mean height between stable and socially mobile groups.
Results
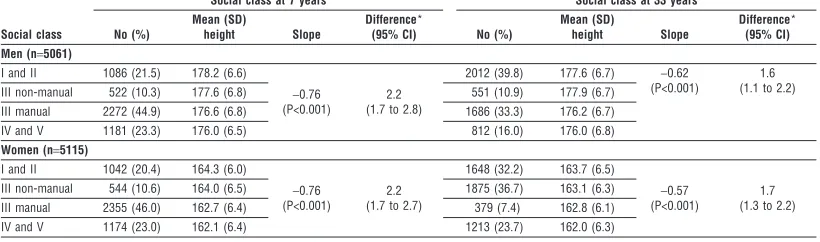
There were social gradients in adult height for class of origin and class at age 33 (table 1). There were changes in social structure between 1965 and 1991 for parents and offspring at a comparable age in the life span: the proportions in classes I and II increased from 22% to 40% for men and 20% to 32% for women. Correspond-ingly, the proportion of men, though not women, in semiskilled or unskilled occupations declined from 23% to 16%. Differences in mean height between the extreme social classes were greater for class of origin than for class of destination, with differences of 2.21 cm versus 1.62 cm respectively for men and 2.18 cm versus 1.74 cm for women. Consistent with this, the slope of inequality was steeper for age 7 years.
Table 1 Mean (SD) adult height (cm) at 33 years by social class of origin (at 7 years) in 1965 and by adult class at age 33 in 1991
Social class
Social class at 7 years Social class at 33 years
No (%)
Mean (SD)
height Slope
Difference*
(95% CI) No (%)
Mean (SD)
height Slope
Difference* (95% CI) Men (n=5061)
I and II 1086 (21.5) 178.2 (6.6)
−0.76 (P<0.001)
2.2 (1.7 to 2.8)
2012 (39.8) 177.6 (6.7) −0.62 (P<0.001)
1.6 (1.1 to 2.2) III non-manual 522 (10.3) 177.6 (6.8) 551 (10.9) 177.9 (6.7)
III manual 2272 (44.9) 176.6 (6.8) 1686 (33.3) 176.2 (6.7) IV and V 1181 (23.3) 176.0 (6.5) 812 (16.0) 176.0 (6.8) Women (n=5115)
I and II 1042 (20.4) 164.3 (6.0)
−0.76 (P<0.001)
2.2 (1.7 to 2.7)
1648 (32.2) 163.7 (6.5)
−0.57 (P<0.001)
1.7 (1.3 to 2.2) III non-manual 544 (10.6) 164.0 (6.5) 1875 (36.7) 163.1 (6.3)
III manual 2355 (46.0) 162.7 (6.4) 379 (7.4) 162.8 (6.1) IV and V 1174 (23.0) 162.1 (6.4) 1213 (23.7) 162.0 (6.3)
*Difference (cm) between two extreme groups.
Table 2 Mean height (cm) at 33 years and inflow social mobility (moving into destination class (adult class at age 33) from class of origin at 7 years (father’s class) either from all lower classes or all higher classes with combined groups of upward and downward mobility). Figures in parentheses are numbers of participants
Class of origin
Adult class of destination
I and II III non-manual III manual IV and V
Men
I and II 178.3 (729) 178.6 (115)
177.0 (285)
176.2 (515) III non-manual
177.2 (1283)
177.7 (91) III manual
177.8 (345) 176.1 (926)
IV and V 176.0 (475) 175.6 (297)
Women
I and II 164.6 (542) 164.1 (330)
163.2 (83)
162.3 (813) III non-manual
163.24 (1106)
163.9 (227) III manual
162.8 (1318) 163.0 (193)
IV and V 162.1 (103) 161.3 (400)
H
H
H
H
H
H
The narrowing of inequality was due mainly to a decrease in mean height in classes I and II, whereas for classes IV and V mean height was similar for both class of origin and adult class (table 1). This reduction in height for classes I and II can be explained by patterns of social mobility linked to height. One general pattern to emerge is that those moving to a higher class are taller on average than the class they leave and shorter than the class they join (tables 2 and 3, also see graphs of data on bmj.com). To illustrate, men moving into classes I and II from all other classes were taller (177.2 cm) than men with similar class origins (for example, 176.1 cm for those remaining in class III manual), yet they were shorter than men staying in class I and II (178.3 cm) (table 2). After we adjusted for class of destination, men moving into a higher class (inflow mobility) were on average 0.7 cm (95% confidence interval 0.2 to 1.2 cm) shorter than those who were stable in that class, whereas men moving into a lower class were on average 0.8 cm (0.2 to 1.4) taller than the stable group. The respective figures for women were 1.3 cm (0.8 to 1.8) and 0.6 cm (0.0 to 1.2). For outflow mobility (table 3) we found that, after adjustment for class of origin, men moving out to a higher class were 0.4 cm (−0.2 to 0.9) taller than those stable in their class of origin, while men moving out to a lower class were 1.1 cm (0.7 to 1.6) shorter. Similarly for women, the respective figures were 0.7 cm (0.2 to 1.3) and 0.6 cm (0.1 to 1.2).
However, an important influence on average height in a particular class is the number of individuals mov-ing or staymov-ing in the same class. Adult height in classes I and II fell because a substantial number of men (1283) with shorter average stature moved into this class to join a smaller group of taller men (729) origi-nally from this class (table 2). Fewer men (357) moved out of class I and II (table 3), and they too were taller than men moving into this class. This pattern of inward and outward social mobility led to a reduction in aver-age height in the highest social groups. Similar trends were seen for women.
Discussion
Contrary to expectation, we found that changing social structure and height related selection have acted to reduce rather than amplify inequalities in height. In other words, inequalities would have been greater in the absence of these social processes. Adult height is uniquely able to demonstrate this because, in contrast
with other health measures, it varies little until late middle age.11
Height was constant throughout this study and it was only social position that varied from class of origin (father’s class) to destination class. Com-parison of these two social measures shows the effect of social mobility and height selection. Our results show that socioeconomic conditions in childhood generate wider inequalities that are then offset, in part, by social forces acting to diminish inequalities in adult height. Macro social trends therefore influence the pattern of inequality in this population, and it is the level of mobility over time—in this instance the general trend of upward social mobility between generations—that is important here, in combination with height selection.
We do not argue that social mobility has a major impact on inequalities. From a difference in mean height between the extreme social groups of 2.2 cm, the estimated reduction in inequality is only modest. However, it is the lessening of inequality that is of interest as we had expected inequalities to increase as a result of social mobility. For other health measures, effects of social mobility are less readily established because of changes in health status. However, previous studies suggest that social mobility may have a constraining effect on inequalities in health (“gradient constraint”), but effects are likely to vary, as found in the 1958 cohort (O Manor, unpublished data) and elsewhere.14 15
Even so, narrowing inequality for adult
What is already known on this topic
Changes in the structure of society (artefact) and health related social mobility (selection) are thought to generate inequalities in health, but the strength and direction of effects are not fully appreciated
Adult height is a risk marker for cardiorespiratory disease and a useful index with which to assess effects of social mobility
What this study adds
Inequalities in height were not inflated as a result of social mobility and changes in social structure
These social forces acted to obscure an effect of childhood socioeconomic circumstances
Inequalities would have been greater in the absence of the general trend of upward social mobility between generations and the tendency for taller people to be upwardly mobile
Table 3 Mean height (cm) at 33 years and outflow social mobility (moving out from class of origin at 7 years (father’s class) to destination class (adult class at age 33) with combined groups of upward and downward mobility). Figures in parentheses are numbers of participants
Adult class of destination
Social class of origin
I and II III non-manual III manual IV and V
Men
I and II 178.3 (729) 178.4 (271)
177.5 (948)
176.1 (884) III non-manual
178.0 (357)
177.7 (91) III manual
176.3 (160) 176.0 (926)
IV and V 175.8 (398) 175.6 (297)
Women
I and II 164.6 (542) 164.0 (199)
163.0 (1554)
162.5 (774) III non-manual
163.9 (500)
163.9 (227) III manual
164.1 (118) 163.0 (193)
IV and V 161.7 (608) 161.3 (400)
H
H
H
H
H
H
H
height is noteworthy because of its potential to influence the pattern of inequality in some chronic dis-eases, including coronary heart disease, in later life.6–10
Inequalities in height based on adult social position seem to underestimate the effects of socioeconomic differences originating in childhood. This has implica-tions for the perceived scale and causes of inequalities in adult disease, and therefore for policies aimed at reducing inequalities. The involvement of macro level trends linked to structural factors (changing social structures and social mobility) will need to be appreci-ated. Such trends may be neglected by current evidence based approaches to inequalities,2
which tend to emphasise easily measured factors, often at an individual level and usually on a short time scale. Our results show that an unfavourable impact of childhood circumstances on adult height is partly obscured by changing social structures and that an understanding of such effects is needed to tackle current patterns of health inequality.
Contributors: CP and OM specified the study aims; all authors discussed the analyses, which were undertaken by LL and OM. CP prepared the first draft; all authors contributed to the final version of the paper. CP is the guarantor of the paper.
Funding: The Canadian Institute for Advanced Research supports CP as a fellow.
Competing interests: None declared.
1 Davey Smith G, Ebrahim S, Frankel S. How policy informs the evidence.
BMJ2001;322:184-5.
2 Macintyre S, Chalmers I, Horton R, Smith R. Using evidence to inform policy: case study.BMJ2001;322:222-5.
3 Townsend P, Davidson N, Whitehead M.Inequalities in health: the Black report and the health divide. Harmondsworth: Penguin, 1988.
4 Department of Health.Variations in health: what can the department of health and the NHS do?HMSO: London, 1995.
5 Smith GD, Bartley M, Blane D. The Black report on socioeconomic inequalities in health 10 years on.BMJ1990;301:373-7.
6 Waaler HT. Height, weight and mortality. Acta Med Scand Suppl
1984;679:1-56.
7 Marmot MG, Shipley MJ, Rose G. Inequalities in death—specific explana-tions of a general pattern?Lancet1984;i:1003-6.
8 Walker M, Shaper AG, Wannamethee G. Height and social class in middle-aged British men.J Epidemiol Community Health1988;42:299-303. 9 Yarnell JWG, Limb ES, Layzell JM, Baker IA. Height: a risk marker for ischaemic heart disease: prospective results from the Caerphilly and Speedwell heart disease studies.Eur Heart J1992;13:1602-5. 10 Leon DA, Smith GD, Shipley M, Strachan D. Adult height and mortality
in London: early life, socioeconomic confounding, or shrinkage?J Epide-miol Community Health1995;49:5-9.
11 Sorkin JD, Muller DC, Andres R. Longitudinal changes in the heights of men and women: consequential effects on body mass index.Epidemiol Rev
1999;21:247-60.
12 Ferri E, ed.Life at 33: the fifth follow-up of the national child development study. London: National Children’s Bureau, 1993.
13 Centre for Longitudinal Studies Institute of Education.National Child Development Study Composite File including selected Perinatal Data and sweeps one to five[computer file]. Colchester: The Data Archive, 1994 (SN: 3148) www.cls.ioe.ac.uk/Cohort/Ncds/nhome.htm (accessed May 2002). 14 Elstad JI. Health-related mobility, health inequalities and gradient
constraint.Eur J Public Health2001;11:135-40.
15 Bartley M, Plewis I. Does health-selective mobility account for socioeconomic differences in health? Evidence from England and Wales, 1971 to 1991.J Health Soc Behav1997;38:376-86.
(Accepted 15 January 2002)
Impact of upward social mobility on population mortality:
analysis with routine data
Richard F Heller, Patrick McElduff, Richard Edwards
Abstract
ObjectiveTo examine the contribution of changes in the distribution of social class to the mortality of the whole population between 1970-2 and 1991-3.
DesignExamination of routine data at two time points: 1970-2 and 1991-3.
Data sourceData provided by the Office for National Statistics.
Main outcome measuresDifference for the total population in the number of deaths between 1971 and 1991. Proportion of difference accounted for by change in population size, change in risk of death within each social class, or change in distribution of population across social classes.
ResultsReductions in mortality between 1970-2 and 1991-3 among men in England and Wales were partially (16% of all deaths) attributable to increases in the proportion of men in higher social classes, representing 3943 fewer deaths per year or one less death for every 3056 men in 1991-3 compared with 1970-2.
ConclusionSome of the observed reduction in mortality seen between 1970-2 and 1991-3 can be accounted for by improved overall socioeconomic status of the population.
Introduction
In recent years the topic of health inequality has devel-oped increasing social and political importance, and one of the spurs to this has been the demonstration of a large and widening gap in death rates between the extremes of the social distribution.1–4
However, this may give a distorted view of the overall level of health inequality due to social class differentials as it does not take into account the changing distribution of social class within the whole population.
Between 1970-2 and 1991-3 mortality in the higher and lower social classes diverged in England and Wales, but there was also a reduction in the proportion of people in the lower social classes.
We assessed the potential impact of changes in the composition of social class on population mortality. To do so, we measured the contribution of changes in the risk of death within social classes and changes in the distribution of the population between social classes to the change in total deaths between 1970-2 and 1991-3.
Methods
The data for this analysis were provided by the Office for National Statistics and were analysed only for men aged 25-64 years. Social class, defined by the registrar The full version of
this article appears on bmj.com
Evidence for Population Health Unit, School of Epidemiology and Health Sciences, Medical School, University of Manchester, Manchester M13 9PT Richard F Heller
professor of public health
Patrick McElduff
lecturer in medical statistics
Richard Edwards
senior lecturer in public health
Correspondence to: R F Heller Dick.Heller@ man.ac.uk