ABSTRACT
BARRETT, PAUL RYAN. Unified Constitutive Modeling for High Temperature Fatigue-Creep and Fatigue-Creep Responses of Haynes 230. (Under the direction of Dr. Tasnim Hassan).
The reliability of structural components in high temperature systems experiencing cyclic thermo-mechanical loading is an important problem, especially for airplane turbo engine components. To investigate the failure mechanisms of these components, advanced material models are required that can describe the complex material phenomena and accurately predict the deformation and damage behavior. These material models should be developed and validated against a broad set of material responses for a range of loading histories. These experimental loading histories strive to replicate in-service conditions of structural components. As a result, this dissertation has undertaken both the experimental analysis and model development for a nickel-base superalloy, Haynes 230. Haynes 230 is used as combustor liner material in airplane turbine engines, where the temperatures can be as high as 982°C (1800°F).
© Copyright 2014 Paul Ryan Barrett
Unified Constitutive Modeling for High Temperature Fatigue-Creep and Creep Responses of Haynes 230
by
Paul Ryan Barrett
A dissertation submitted to the Graduate Faculty of North Carolina State University
in partial fulfillment of the requirements for the degree of
Doctor of Philosophy
Civil Engineering
Raleigh, North Carolina
2015
APPROVED BY:
_______________________________ ______________________________
Dr. Tasnim Hassan Dr. Christopher Bobko
DEDICATION
BIOGRAPHY
ACKNOWLEDGEMENTS
It has been an incredible journey and it would not be possible without the many people who have helped me along the way, especially family and friends.
I would like to express my sincere gratitude to my advisor Dr. Tasnim Hassan for his passion, professionalism, optimism, enthusiasm, and most importantly unique knowledge. Dr. Hassan has an uncanny ability to excite the most challenging research with an overwhelming sense of optimism and foresight. You see Dr. Hassan understands the social intricacies associated with making it through this long, arduous journey by providing me the encouragement, guidance and inspiration that I always needed along the way. Five years ago I decided to take a leap of fate and undertake a research project that I knew very little about and five years later I knew this would all be possible under the leadership of Dr. Hassan. I would also like to thank him for always expecting me to give my best, because he always gave his. I am also grateful for all the conference opportunities and research travel Dr. Hassan arranged for his students, all of which were invaluable in getting here today.
My sincere thanks goes to the rest of my doctoral committee: Dr. Kumar Mahinthakumar, Dr. Christopher Bobko, and Dr. Ralph Smith for their encouragement, insightful comments, and time throughout my research and coursework.
I would also like to thank my research partner Raasheduddin Ahmed with whom I not only worked in the same project during my Ph.D. research, but also grew to have a special bond in life and that is friendship. Raashed always knew how to get the best out of me when it came to research as well as life and I am forever grateful. I also want to thank all my other colleagues: Graham Pritchard, Shahriar Quayyum, Machel Morrison, Doug Schweizer, Nazrul Islam, Vahid Zanjani, and Arash Banadaki for the friendships we have made and the good times seen in Mann 407 being Nerds.
TABLE OF CONTENTS
LIST OF TABLES ...x
LIST OF FIGURES ... xi
CHAPTER 1: INTRODUCTION ...1
1. Background and motivation ...1
2. Scope and organization ...4
3. References ...5
CHAPTER 2: AN EXPERIMENTAL STUDY ON HIGH TEMPERATURE LOW-CYCLE FATIGUE AND FATIGUE-CREEP RESPONSES OF HAYNES 230 ...6
Abstract ...6
1. Introduction ...7
2. Experimental Study ...14
2.1. Experimental program ...14
2.2. Quantification of responses ...17
2.3. LCF and creep-fatigue testing procedure ...18
2.4. Test material and metallography ...19
3. Results ...20
3.1. Cyclic stress-strain responses from Groups 1-3 ...20
3.1.1. General hysteresis characteristics and the effect of mean strain ...20
3.1.2. Cyclic hardening-softening evolution ...25
3.1.3. Effect of strain rate ...28
3.2. Role of Dynamic Strain Aging (DSA) ...31
3.3. Haynes 230 Elastic Characterization (Groups 1-3) ...33
3.4. Haynes 230 Viscous Characterization (Groups 1-3) ...37
3.5. Effect of hold time on hysteresis responses (Group 4) ...38
3.5.1. Creep-fatigue interaction background...38
3.5.3. Creep-fatigue cyclic evolution ...41
3.5.4. Creep-fatigue stress relaxation ...44
3.6. Low cycle fatigue life (Groups 1-3) ...48
3.6.1. Effect of mean strain ...48
3.6.2. Effect of strain rate ...51
3.6.3. Fatigue damage ...52
4. Conclusions ...55
5. Acknowledgements ...57
6. References ...57
CHAPTER 3: OUT-OF-PHASE AND IN-PHASE HIGH TEMPERATURE THERMO-MECHANICAL FATIGUE-CREEP OF HAYNES 230 ...62
Abstract ...62
1. Introduction ...63
2. Experimental Study ...66
2.1. Thermo-mechanical fatigue test experimental procedure and loading histories ...66
2.2. Quantification of responses ...68
2.3. Thermo-mechanical fatigue experiments conducted ...69
3. Isothermal Strain Rate-dependence and Stress Relaxation ...70
3.1. Isothermal low cycle fatigue (LCF) strain rate effect ...71
3.2. Isothermal low cycle fatigue (LCF) strain rate effect ...73
4. Thermo-mechanical response ...77
4.1. Thermo-mechanical fatigue test hysteresis loops and mean stress evolution ...78
4.2. Thermo-mechanical fatigue cyclic hardening ...84
4.3. Thermo-mechanical fatigue rate-dependence ...87
4.4. Thermo-mechanical fatigue hysteresis loop shape evolution ...88
4.5. Thermo-mechanical inelastic and elastic strain calculation ...90
4.7. Evolution of stress relaxation with time during the relaxation phase ...98
4.8. Evolution of the inelastic strain rate with stress during the relaxation phase ...100
5. Fatigue lives ...102
6. Conclusions ...105
7. Acknowledgements ...106
8. References ...106
CHAPTER 4: CONSTITUTIVE MODELING FOR HIGH TEMPERATURE ISOTHERMAL LOW CYCLE FATIGUE AND FATIGUE-CREEP RESPONSES OF HAYNES 230 ...110
Abstract ...110
1. Introduction ...110
2. Summary of Isothermal Experimental Results ...117
3. Viscoplastic Constitutive Model ...118
3.1. Classical viscoplasticity theory ...118
3.2. Flow Rule ...119
3.3. Kinematic hardening and isotropic hardening rules ...121
4. Various Features of the Model Development ...122
4.1. Classical viscoplasticity theory ...122
4.2. Flow rule and viscoplastic characterization ...123
4.3. Cyclic hardening through the kinematic hardening rule ...126
4.4. Importance of static recovery ...129
4.5. Cyclic mean stress evolution ...130
4.6. Numerical implementation of the constitutive model ...133
5. Parameter Determination ...134
6. Model Simulations ...137
6.1. Strain Range Dependence ...137
6.2. Strain Rate Sensitivity...141
7. Conclusions ...153
8. Acknowledgements ...154
9. References ...154
CHAPTER 5: A UNIFIED VISCOPLASTIC MODEL WITH DAMAGE FEATURES FOR HIGH TEMPERATURE FATIGUE-CREEP AND CREEP RESPONSES OF HAYNES 230 ...162
Abstract ...162
1. Introduction ...163
2. Viscoplastic Constitutive Model ...167
2.1. Unified viscoplastic model ...168
2.2. Flow rule investigation ...170
2.3. Isotropic damage modeling ...175
3. Various Challenges of the Model Development for Simulation of Fatigue, Fatigue-Creep, and Creep Responses ...177
3.1.Creep simulation without damage considering only strain-controlled responses ...177
3.2.Creep and Fatigue-Creep simulation without damage considering stress- controlled response for static recovery parameter determination (gradient-based) ...187
3.3.Creep and Fatigue-Creep simulation damage considering both strain and stress-controlled for static recovery parameter determination (genetic algorithm) ...190
3.4. Creep and Fatigue-Creep simulation with isotropic damage ...193
4. Model Simulations ...198
4.1. Creep simulation with and without isotropic damage ...199
4.2. Fatigue-Creep simulation with and without isotropic damage ...205
5. Conclusions ...211
6. Acknowledgements ...212
CHAPTER 6: ROBUST PARAMETER DETERMINATION OF A CHABOCHE-BASED UNIFIED
VISCOPLASTIC MODEL USING BOTH LOCAL AND GLOBAL OPTIMIZATION METHODS ...216
Abstract ...216
1. Introduction ...216
2. Process Flow of the Unified Viscoplastic Constitutive Model ...222
3. Initial Parameter Estimation ...229
3.1. Elastic and rate-independent kinematic parameters ...229
3.2. Rate dependent parameters ...233
3.3. Static recovery and mean stress parameters ...235
4. Hybrid Genetic Algorithm for Local-Global Analysis ...238
4.1. Conventional GA ...239
4.2. Hybrid GA ...245
5. Comparison of Optimization Methods: Local vs. Global ...248
6. Conclusions ...253
7. References ...255
CHAPTER 7: CONCLUSIONS AND RECOMMENDATIONS ...258
1. Conclusions ...258
2. Recommendations for future research ...261
2.1. Multiaxiality and other complex loading paths ...261
2.2. Parameter correlation analysis ...262
3. References ...263
APPENDICES ...264
A.1. Lambert W function for the exponential Norton’s flow rule ...265
LIST OF TABLES
CHAPTER 2: AN EXPERIMENTAL STUDY ON HIGH TEMPERATURE LOW-CYCLE FATIGUE AND FATIGUE-CREEP RESPONSES OF HAYNES 230
Table 1 LCF tests for Groups 1-4 with appropriate temperature and strain history over a scope of test parameters ...15 Table 2 Nominal chemical composition of Haynes 230 alloy, in wt. % ...20
CHAPTER 3: OUT-OF-PHASE AND IN-PHASE HIGH TEMPERATURE THERMO-MECHANICAL FATIGUE-CREEP OF HAYNES 230
Table 1 Nominal chemical composition of Haynes 230 in wt. % ...67 Table 2 Haynes 230 out-of-phase TMF experiments loading parameters ...70 Table 3 Haynes 230 in-phase TMF experiments loading parameters ...70
CHAPTER 6: ROBUST PARAMETER DETERMINATION OF A CHABOCHE-BASED UNIFIED VISCOPLASTIC MODEL USING BOTH LOCAL AND GLOBAL OPTIMIZATION METHODS
LIST OF FIGURES CHAPTER 1: INTRODUCTION
Fig. 1 Big picture process flow for the development of the unified viscoplastic model for improved stress-strain fidelity in finite element simulation and fatigue design of a gas turbine engine ...2
CHAPTER 2: AN EXPERIMENTAL STUDY ON HIGH TEMPERATURE LOW-CYCLE FATIGUE AND FATIGUE-CREEP RESPONSES OF HAYNES 230
Fig. 1 Combustor liner with cracking due to TMF (Courtesy of Honeywell
Aerospace) ...8 Fig. 2 (a) Measurement of plastic strain range for an isothermal LCF experimental
hysteresis loop, (b) Measured plastic strain range as a function of the total strain range at half life for different temperatures in selection of the ‘fixed’ plastic strain range: ∆εxp=0.20% ...16
Fig. 3 Typical creep-fatigue hysteresis loop showing measurements made to
quantify cyclic response ...18 Fig. 4 Geometry of the low cycle fatigue specimen (in) ...19 Fig. 5 Typical microstructure of Haynes 230 alloy showing (a) rolling texture
morphology of the primary carbides, M6C, and (b) annealing twins. ...20
Fig. 6 HA230 responses under LCF, strain range 1.4%, 24°C for (a) Hysteresis loops from symmetric, saw-tooth, strain-controlled cycles (R = -1), (b) Hysteresis loops from tensile, saw-tooth, strain-controlled cycles (R = 0), and (c) stress amplitudes and means as a function of cycles from
experiments (1MPa=0.145ksi) ...23 Fig. 7 HA230 responses under LCF, strain range 1.0%, 427°C for (a) Hysteresis
loops from symmetric, saw-tooth, strain-controlled cycles (R = -1), (b) Hysteresis loops from tensile, saw-tooth, strain-controlled cycles (R = 0), and (c) stress amplitudes and means as a function of cycles from
experiments (1MPa=0.145ksi) ...23 Fig. 8 HA230 responses under LCF, strain range 0.6%, 760°C for (a) Hysteresis
loops from symmetric, sinusoidal, strain-controlled cycles (R = -1), (b) Hysteresis loops from tensile, sinusoidal, strain-controlled cycles (R = 0), and (c) stress amplitudes and means as a function of cycles from
Fig. 9 HA230 responses under LCF, strain range 0.39%, 982°C for (a) Hysteresis loops from symmetric, saw-tooth, strain-controlled cycles (R = -1), (b) Hysteresis loops from tensile, sinusoidal, strain-controlled cycles (R = 0), and (c) stress amplitudes and means as a function of cycles from
experiments (1MPa=0.145ksi) ...24 Fig. 10 HA230 temperature dependence upon cyclic stress evolution, with constant
strain ranges: (a) ∆ε=1.60%, (b) ∆ε=0.80% (c) ∆ε=0.60%, and (d)
∆ε=0.40%at several temperatures (1MPa=0.145ksi) ...27 Fig. 11 Haynes 230 strain range dependence upon cyclic stress evolution, with
stress amplitude and mean responses for Group 1 experiments with constant isothermal temperatures: (a) 24°C (75°F), (b) 427°C (800°F), (c) 760°C (1400°F), and (d) 982°C (1800°F) at several strain ranges (1MPa=0.145ksi) ...28 Fig. 12 Haynes 230 strain rate dependence upon cyclic stress evolution, with stress
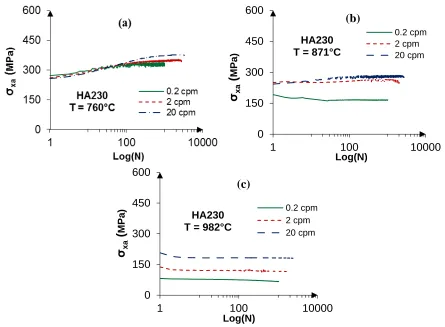
amplitude and mean responses for Group 2 experiments with constant isothermal temperatures: (a) T = 24°C (75°F), (b) T = 204°C (400°F), (c) T = 427°C (800°F), and (d) T = 649°C (1200°F) at various loading rates (0.2, 2, and 20 cpm) (1MPa=0.145ksi) ...30 Fig. 13 Haynes 230 strain rate dependence upon cyclic stress evolution, with stress
amplitude and mean responses for Group 2 experiments with constant isothermal temperatures: (a) T = 760°C (1400°F), (b) T = 871°C (1600°F), and (c) T = 982°C (1800°F) at various loading rates (0.2, 2, and 20 cpm) (1MPa=0.145ksi) ...31 Fig. 14 The effect of dynamic strain aging (DSA) on the hysteresis responses at
T = 427°C: (a) Negative feedback in strain-controlled wave due to solute drag (DSA) for the initial cycle, (b) DSA disappears after 200 cycles, (c) DSA appearance in initial hysteresis cycle with unstable plastic flow in both compressive and tensile portions of the hysteresis, and (d) the absence of DSA at cycle 200 (1MPa=0.145ksi) ...34 Fig. 15 HA230 initial plastic hysteresis cycle at room temperature (24°C) showing
yielding, σ0 and (b) yielding at same testing conditions showing asymptotic
fixed plastic strain during yield ...35 Fig. 16 Haynes 230 temperature dependence of the material for (a) monotonic tensile
Fig. 17 (a) HA 230 plastic hysteresis cycle (982°C) showing a physically defined viscous stress σv, and (b) plastic strain accumulation corresponding to the
creep overstress viscous rounding ...36 Fig. 18 Haynes 230 hold time dependence upon cyclic stress evolution, specifically
hysteretic behavior of the cycles as well as the manifestations of the stress relaxation at a strain range and temperature corresponding to (a) T: 649°C, ∆ε=0.76% with a hold duration of tH= 60 seconds, (b) T: 649°C, ∆ε=0.76%
with a hold duration of tH= 120 seconds, (c) T: 760°C, ∆ε=0.64% with a
hold duration of tH= 60 seconds, and (d) T: 760°C, ∆ε=0.64% with a hold
duration of tH = 120 seconds (1MPa=0.145ksi) ...42
Fig. 19 Haynes 230 hold time dependence upon cyclic stress evolution, specifically hysteretic behavior of the cycles as well as the manifestations of the stress relaxation at a strain range and temperature corresponding to (a) T: 871°C, ∆ε=0.53% with a hold duration of tH= 60 seconds, (b) T: 871°C, ∆ε=0.53%
with a hold duration of tH= 120 seconds, (c) T: 982°C, ∆ε=0.39% with a
hold duration of tH = 60 seconds, and (d) T: 982°C, ∆ε=0.39% with a hold
duration of tH = 120 seconds (1MPa=0.145ksi) ...43
Fig. 20 Haynes 230 hold time dependence upon cyclic stress evolution, with stress amplitude and stress mean responses for Group 4 experiments and Group 2, as a function of cycles: (a) T: 649°C, ∆ε=0.76%, (b) T: 760°C, ∆ε=0.64%, (c) T: 871°C, ∆ε=0.53%,and (d) T: 982°C, ∆ε=0.39% for various hold times tH = 0,60, 120 seconds (1MPa=0.145ksi) ...45
Fig. 21 Isothermal creep-fatigue stress relaxation (∆σxr) responses of Haynes 230 at
four temperatures (T) of 649, 760, 871 & 982°C, and two strain holds (tH)
of 60 & 120s (1MPa=0.145ksi) ...47 Fig. 22 Isothermal LCF normalized stress relaxation (Normalized ∆σxr) responses
of Haynes 230 at four temperatures (T) of 649, 760, 871 & 982°C, and two strain holds (tH) of 60 & 120s (1MPa=0.145ksi) ...48
Fig. 23 Evolution of stress relaxation (∆σxr) with time at hold (tH) for isothermal
Group 4 creep-fatigue experiments of Haynes 230: (a) T: 649°C, ∆ε=0.76%, tH=120s, (b) T: 760°C, ∆ε=0.64%, tH=120s , (c) T: 871°C, ∆ε=0.53%,
tH=120, and (d) T: 982°C, ∆ε=0.39%, tH=120s (1MPa=0.145ksi) ...49
Fig. 25 Haynes 230 fatigue life as a function of temperature for various strain rates (cyclic frequencies) ...52 Fig. 26 Haynes 230 fatigue damage as a function of temperature, ∆ε=0.80%of
Group 1 ...54 Fig. 27 Haynes 230 fatigue damage for various temperatures, strain ranges, and
hold times of Group 4. ...55
CHAPTER 3: OUT-OF-PHASE AND IN-PHASE HIGH TEMPERATURE THERMO-MECHANICAL FATIGUE-CREEP OF HAYNES 230
Fig. 1 Temperature (T) vs. time (t) and strain (εx) vs. time (t) thermo-mechanical
fatigue loading histories prescribed in the experiments: (a) Out-of-phase and (b) In-phase ...68 Fig. 2 Typical out-of-phase TMF hysteresis loop showing measurements made to
quantify cyclic response ...69 Fig. 3 Isothermal low cycle fatigue with symmetric axial strain cycling, (a)
without hold, (b) with compressive hold time of tH ...71 Fig. 4 Isothermal LCF stress amplitude (∆σxa) responses of Haynes 230 at strain
rates of 0.2, 2 & 20 cpm, and temperatures (T): (a) 649°C, (b) 760°C, (c) 871°C, (d) 982°C (1MPa=0.145ksi) ...72 Fig. 5 Isothermal LCF stress (σxa) vs. strain (ε) hysteresis loops at various cycles
of Haynes 230 for 120s compressive hold at two temperatures: (a) 649°C and (b) 982°C (1MPa=0.145ksi) ...74 Fig. 6 Cyclic stress amplitudes (σxa) and mean stresses (σxm) for isothermal LCF
experiments of Haynes 230 for two different compressive hold times of 60 and 120s at 871°C (1MPa=0.145ksi) ...75 Fig. 7 Isothermal LCF stress relaxation (∆σxr) responses of Haynes 230 at four
temperatures (T) of 649, 760, 871 & 982°C, and two strain holds (tH) of 60
& 120s (1MPa=0.145ksi) ...76 Fig. 8 Isothermal LCF normalized stress relaxation (Normalized ∆σxr) responses
of Haynes 230 at four temperatures (T) of 649, 760, 871 & 982°C, and two strain holds (tH) of 60 & 120s (1MPa=0.145ksi) ...77
Fig. 9 Out-of-phase TMF stress (σx) vs. strain (εx) hysteresis loops of Haynes 230
Fig. 10 In-phase TMF stress (σx) vs. strain (εx) hysteresis loops of Haynes 230 at
various cycles: (a) 316-871°C and (b) 316-927°C (1MPa=0.145ksi) ...80 Fig. 11 Out-of-phase TMF stress amplitudes (∆σxa) and mean stresses (∆σxm) of
Haynes 230 as a function of the number of cycles (N) for four different
maximum cycling temperatures (1MPa=0.145ksi) ...81 Fig. 12 Out-of-phase TMF stress amplitudes (∆σxa) and mean stresses (∆σxm) of
Haynes 230 as a function of the number of cycles (N): (a) 316-816°C, (b) 316-871°C and (c) 316-927°C (1MPa=0.145ksi) ...83 Fig. 13 In-phase TMF stress amplitudes (∆σxa) and mean stresses (∆σxm) of Haynes
230 as a function of the number of cycles (N) for four different maximum cycling temperatures (1MPa=0.145ksi) ...84 Fig. 14 Isothermal low cycle fatigue stress amplitude (∆σxa) and mean stress
(∆σxm) responses of Haynes 230 at different temperatures (T) for strain
ranges (∆ε): (a) 0.6% and (b) 0.4% ...85 Fig. 15 Comparison between stress amplitudes (∆σxa) of same strain range
out-of-phase (OP) and in-out-of-phase (IP) TMF experiments of Haynes 230 for three maximum temperatures (1MPa=0.145ksi) ...87 Fig. 16 Haynes 230 material properties as a function of temperature (T), (a) yield
stress and tensile strength, (b) elastic modulus ...89
Fig. 17 Thermo-mechanical stress drop
(
∆σTMxd)
with cycles (N) for out-of-phase TMF experiments of Haynes 230 for different maximum cyclingtemperatures (T), strain ranges (∆ε) and hold times (tH) (1MPa=0.145ksi) ...90
Fig. 18 Evolution of hysteresis loops for the first 20 cycles of a TMF test of Haynes 230 in: (a) mechanical strain direction
( )
εx , (b) inelastic strain direction( )
in xε and (c) elastic strain direction
( )
e xε ...92 Fig. 19 Evolution of mechanical
( )
εx , inelastic( )
inx
ε and elastic strains
( )
e xε with time (t) for the first 20 cycles of a TMF test of Haynes 230 ...92 Fig. 20 Evolution of hysteresis loops for the first 20 cycles of a TMF test of Haynes
230 with consideration the time derivative of elastic modulus
Fig. 21 Evolution of mechanical
( )
εx , inelastic( )
in xε and elastic strains
( )
e xε with time (t) for the first 20 cycles of a TMF test of Haynes 230 with
consideration of the time derivative of elastic modulus ...94 Fig. 22 Out-of-phase TMF stress relaxation (∆σxr) responses of Haynes 230 with
cycles (N) for different strain ranges (∆ε) and hold times (tH): (a) 316-
816°C, (b) 316-871°C, (c) 316-927°C and (d) 316-982°C ...96 Fig. 23 In-phase TMF stress relaxation (∆σxr) responses of Haynes 230 with cycles
(N) for different maximum temperatures and strain ranges (∆ε)
(1MPa=0.145ksi) ...97 Fig. 24 Out-of-phase TMF normalized stress relaxation (Normalized ∆σxr)
responses of Haynes 230 with cycles (N) for different maximum
temperatures, strain ranges (∆ε) and hold times (tH) ...97
Fig. 25 Comparison between the out-of-phase and in-phase TMF stress relaxation (∆σxr) responses of Haynes 230 (1MPa=0.145ksi) ...98
Fig. 26 Evolution of stress relaxation (∆σxr) with time at hold (tH) for out-of-phase
TMF experiments of Haynes 230: (a) T: 316-871°C, ∆ε=0.4%, tH=120s
and (b) T: 316-871°C, ∆ε=0.3%, tH=1200s (1MPa=0.145ksi)...99
Fig. 27 Evolution of stress relaxation (∆σxr) with time at hold (tH) for isothermal
LCF experiments of Haynes 230: (a) T: 760°C, ∆ε=0.64%, tH=120s and
(a) T: 982°C, ∆ε=0.39%, tH=60s (1MPa=0.145ksi) ...100
Fig. 28 Inelastic strain rate
( )
in xε
∆ versus stress during relaxation (σx) of
isothermal LCF experiments of Haynes 230 at temperatures: (a) 871°C and (b) 982°C (1MPa=0.145ksi) ...101
Fig. 29 Inelastic strain rate
( )
∆εxin versus stress during relaxation (σx) of out-of-phase TMF experiments of Haynes 230: (a) T: 316-816°C and (b) 316- 871°C (1MPa=0.145ksi) ...102 Fig. 30 Fatigue lives of out-of-phase TMF experiments of Haynes 230: (a) At
different maximum temperatures and hold times (tH), (b) Comparison with
isothermal LCF fatigue lives ...103 Fig. 31 Energy absorption with cycles for out-of-phase TMF, in-phase TMF and
CHAPTER 4: CONSTITUTIVE MODELING FOR HIGH TEMPERATURE ISOTHERMAL LOW CYCLE FATIGUE AND FATIGUE-CREEP RESPONSES OF HAYNES 230
Fig. 1 Isothermal LCF, symmetric axial strain cycling (a) without holds, and (b) with strain holds ...117 Fig. 2 Viscoplasticity framework in the mathematical π-plane for 3-D loading ...120 Fig. 3 (a) HA230 initial plastic hysteresis cycle at 24°C showing yielding and (b)
yielding at same testing conditions showing asymptotic fixed plastic strain during yield ...124 Fig. 4 (a) HA 230 plastic hysteresis cycle (982°C) showing a physically defined
viscous stress σv, and (b) plastic strain accumulation corresponding to the creep overstress viscous rounding ...125 Fig. 5 (a) Isothermal hysteresis response of HA230 at 204°C, Δεx = 1.20% for an
initial and stable cycle and, (b) shifted upgoing plastic hysteresis curves for the initial and stable cycle showing the absence of isotropic hardening ...127 Fig. 6 Haynes 230 isothermal fatigue-creep simulations using the basic
viscoplasticity model for Δε = 0.64%, T = 760°C without static recovery and with static recover y ...130 Fig. 7 Haynes 230 hold time dependence upon cyclic stress evolution, with stress
amplitude and stress mean responses as a function of cycles for various hold times tH = 0, 60, 120 seconds at Δε = 0.76%, T = 649°C: (a) without
mean stress modeling, and (b) with mean stress modeling also at Δε = 0.64%, T = 760°C: (c) without mean stress modeling, and (d) with mean stress modeling ...132 Fig. 8 Evolution of stress relaxation (∆σxr) with time at hold (tH) for isothermal
fatigue-creep simulations with and without mean stress evolution s of Haynes 230: (a) T: 649°C, ∆ε=0.76%, tH=120s, (b) T: 760°C, ∆ε=0.64%,
tH=120s (1MPa=0.145ksi) ...134
Fig. 9 Isothermal, symmetric LCF strain-controlled simulation at 24°C for HA230 (a) hysteresis cycles and (b) cyclic stress response (hardening)
showing stress amplitude and mean ...139 Fig. 10 Isothermal, symmetric LCF strain-controlled simulation at 204°C for
HA230 (a) hysteresis cycles and (b) cyclic stress response (hardening)
Fig. 11 Isothermal, symmetric LCF strain-controlled simulation at 427°C for HA230 (a) hysteresis cycles and (b) cyclic stress response (hardening)
showing stress amplitude and mean ...140 Fig. 12 Isothermal, symmetric LCF strain-controlled simulation at 649°C for
HA230 (a) hysteresis cycles and (b) cyclic stress response (hardening)
showing stress amplitude and mean ...140 Fig. 13 HA230 strain range dependence upon cyclic stress evolution showing
stress amplitude experimental and simulated responses at (a) 25°C, (b)
204°C, (c) 427°C, and (d) 649°C ...141 Fig. 14 HA230 simulation of strain rate dependence for three strain rates showing
a saturated hysteresis cycle at 871°C (a) 0.2 cpm, (b) 2 cpm, and (c) 20 cpm ...143 Fig. 15 HA230 simulation of strain rate dependence for three strain rates showing
a saturated hysteresis cycle at 982°C (a) 0.2 cpm, (b) 2 cpm, and (c) 20 cpm ...143 Fig. 16 HA230 simulation capability of viscous rounding for a saturated plastic
hysteresis cycle for two different temperatures and rates (a) 871°C (0.2 cpm), and (b) 982°C (2 cpm) ...147 Fig. 17 HA230 simulation of strain rate dependence for three strain rates (cyclic
frequencies) showing the cyclic stress amplitude responses at (a) 871°C, and (b) 982°C ...147 Fig. 18 HA230 simulation of fatigue-creep (strain dwell) cyclic responses at 649°C
for a compressive strain dwell of 120 seconds showing an (a) initial cycle, and (b) saturated cycle ...148 Fig. 19 HA230 simulation of fatigue-creep (strain dwell) cyclic responses at 760°C
for a compressive strain dwell of 120 seconds showing an (a) initial cycle, and (b) saturated cycle ...148 Fig. 20 HA230 simulation of fatigue-creep (strain dwell) cyclic responses at 871°C
for a compressive strain dwell of 120 seconds showing an (a) initial cycle, and (b) saturated cycle ...149 Fig. 21 HA230 simulation of fatigue-creep (strain dwell) cyclic responses at 982°C
Fig. 22 HA230 simulation of stress amplitude responses for fatigue-creep (strain dwell) experiments at various temperatures (649-982°C) with a
compressive dwell of (a) 60 seconds, and (b) 120 seconds ...151 Fig. 23 HA230 simulation of normalized stress relaxation responses for fatigue-creep
(strain dwell) experiments at various temperatures (649-982°C) with a
compressive dwell of (a) 60 seconds, and (b) 120 seconds ...151 Fig. 24 HA230 simulation of stress relaxation rates during a strain dwell of 120
seconds for various saturated cycles at temperatures (a) 649°C, (b) 760°C, (c) 871°C, and (d) 982°C ...152
CHAPTER 5: A UNIFIED VISCOPLASTIC MODEL WITH DAMAGE FEATURES FOR HIGH TEMPERATURE FATIGUE-CREEP AND CREEP RESPONSES OF HAYNES 230
Fig. 1 Viscoplasticity framework in the mathematical π-plane for 3-D loading ....168 Fig. 2 Rate saturation of Norton, sine hyperbolic Norton, and exponential Norton
flow rules ...172 Fig. 3 HA230 simulation of strain rate dependence for three strain rates (cyclic
frequencies) showing the cyclic stress amplitude responses at 871°C for (a) Norton’s equation, and (b) exponential Norton ...173 Fig. 4 HA230 simulation of the viscous stress for saturated cycles at three strain
rates (cyclic frequencies) for both the Norton’s equation and the exponential Norton flow rule ...174 Fig. 5 Creep simulation of Haynes 230 for various creep stresses at 871°C using
strain-controlled parameter determination of static recovery parameters ...179 Fig. 6 Creep simulation of Haynes 230 at 55 MPa and 871°C using strain-controlled
parameter determination parameters Case I (primary features included: flow rule, static recovery, and mean stress evolution) showing (a) total creep strain, (b) strain decomposition, and (c) stress decomposition ...180 Fig. 7 Creep simulation of Haynes 230 at 55 MPa and 871°C using strain-controlled
parameter determination parameters Case II (primary features included: flow rule and mean stress evolution) showing (a) total creep strain, (b) strain
decomposition, and (c) stress decomposition ...181 Fig. 8 Creep simulation of Haynes 230 at 55 MPa and 871°C using strain-controlled
Norton flow rule) showing (a) total creep strain, (b) strain decomposition, and (c) stress decomposition ...182 Fig. 9 Creep simulation of Haynes 230 at 871°C for various creep stresses using
stress-controlled parameter determination of static recovery parameters ...188 Fig. 10 Haynes 230 simulation of fatigue-creep (strain dwell) cyclic responses using
stress-controlled parameter determination of static recovery parameters at 871°C for a compressive strain dwell of 120 seconds showing an (a) initial cycle, and (b) saturated cycle ...188 Fig. 11 Creep simulation of Haynes 230 at 871°C for various creep stresses using both
stress-controlled and strain-controlled responses in a genetic algorithm for static recovery parameters ...192 Fig. 12 Haynes 230 simulation of fatigue-creep (strain dwell) cyclic responses using
both stress-controlled and strain-controlled responses in a genetic algorithm for static recovery parameters at 871°C for a compressive strain dwell of 120 seconds showing an (a) initial cycle, and (b) saturated cycle ...192 Fig. 13 Creep simulation of Haynes 230 at 55 MPa and 871°C comparing the unified
viscoplastic model with and without isotropic Kachanov creep damage
modeling ...194 Fig. 14 Creep simulation of Haynes 230 at 55 MPa and 871°C showing (a) isotropic
damage evolution, and (b) the accumulated Δp (%) influence with and without damage ...194 Fig. 15 Haynes 230 simulation of fatigue-creep (strain dwell) cyclic responses for the
unified viscoplastic model with isotropic Kachanov creep damage at 871°C for a compressive strain dwell of 120 seconds showing an (a) initial cycle, and (b) saturated cycle ...197 Fig. 16 Creep simulation of Haynes 230 at 871°C without isotropic damage
evolution ...200 Fig. 17 Creep simulation of Haynes 230 at 871°C with isotropic damage
evolution ...200 Fig. 18 Creep simulation of Haynes 230 at the rate-dependent temperature of 982°C
without isotropic damage evolution ...202 Fig. 19 Creep simulation of Haynes 230 at the rate-dependent temperature of 982°C
Fig. 20 Creep simulation of Haynes 230 at the rate-independent temperature of
649°C ...204 Fig. 21 Creep simulation of Haynes 230 at the rate-independent temperature of
760°C ...204 Fig. 22 Haynes 230 simulation of fatigue-creep (strain dwell) cyclic responses for the
unified viscoplastic model without isotropic damage at 649°C for a
compressive strain dwell of (a) 60 seconds, and (b) 120 seconds ...207 Fig. 23 Haynes 230 simulation of fatigue-creep (strain dwell) cyclic responses for the
unified viscoplastic model without isotropic damage at 760°C for a
compressive strain dwell of (a) 60 seconds, and (b) 120 seconds ...208 Fig. 24 Haynes 230 simulation of fatigue-creep (strain dwell) cyclic responses for the
unified viscoplastic model without isotropic damage at 871°C for a
compressive strain dwell of (a) 60 seconds, and (b) 120 seconds ...208 Fig. 25 Haynes 230 simulation of fatigue-creep (strain dwell) cyclic responses for the
unified viscoplastic model without isotropic damage at 982°C for a
compressive strain dwell of (a) 60 seconds, and (b) 120 seconds ...209 Fig. 26 Haynes 230 fatigue-creep loading history at 871°C with 60 seconds
compressive holds (a) experiment with cycles shown from initial to the
saturated cycle, and (b) the simulation with isotropic damage ...209 Fig. 27 Haynes 230 fatigue-creep loading history at 982°C with 60 seconds
compressive holds (a) experiment with cycles shown from initial to the
saturated cycle, and (b) the simulation with isotropic damage ...210 Fig. 28 Haynes 230 isotropic Kachanov creep damage evolution for fatigue-creep
loading histories with 60 seconds compressive holds at (a) 871°C (max
damage – 0.06), and (b) 982°C (max damage - 0.45) ...210
CHAPTER 6: ROBUST PARAMETER DETERMINATION OF A CHABOCHE-BASED UNIFIED VISCOPLASTIC MODEL USING BOTH LOCAL AND GLOBAL OPTIMIZATION METHODS
Fig. 1 Process flow for parameter determination of the unified viscoplastic model, level I (primary features) parameters ...227 Fig. 2 Process flow for parameter determination of the unified viscoplastic model,
Fig. 4 Kinematic decomposition of a hysteresis cycle (up-going portion) with initial estimates of Ci ...232
Fig. 5 Rate-dependent viscous cycle with zero yield stress of an isothermal, strain-controlled cyclic test ...234 Fig. 6 Hysteresis loop of a fatigue-creep cycle with compressive strain holds ...236 Fig. 7 Flow chart for the conventional genetic algorithm (dashed box) and the hybrid
genetic algorithm (solid box) with local optimization step and plasticity
constraints for parameter determination ...240 Fig. 8 Schematic of the binary tournament selection ...243 Fig. 9 Schematic of the arithmetic crossover selection ...244 Fig. 10 Schematic of the mutation operation ...245 Fig. 11 Haynes 230 simulation of fatigue-creep (strain dwell) cyclic responses using a
local gradient-based method (fmnincon) for optimization of static recovery parameters ...251 Fig. 12 Creep simulation of Haynes 230 at 871°C for various creep stresses using a
local gradient-based method (fmincon) for optimization of static recovery parameters ...251 Fig. 13 Haynes 230 simulation of fatigue-creep (strain dwell) cyclic responses using a
global method of a hybrid genetic algorithm for optimization of static recovery parameters ...252 Fig. 14 Creep simulation of Haynes 230 at 871°C for various creep stresses using a
global method of a hybrid genetic algorithm for optimization of static recovery parameters ...252
CHAPTER 7: CONCLUSIONS AND RECOMMENDATIONS
Fig. 1 Out-of-phase TMF stress (σx) vs. strain (εx) hysteresis loops of Haynes 230 at various cycles up to half-life for T: 316-927°C, ∆ε=0.4%,
CHAPTER 1:
I
NTRODUCTION
1. Background and motivation
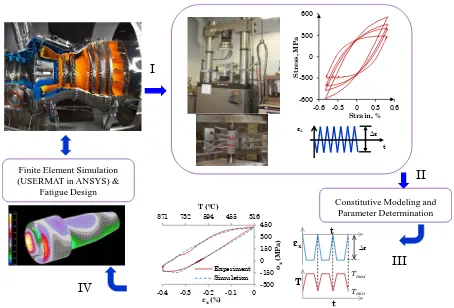
Service-conditions of nickel-base superalloy components in the aerospace and nuclear power industries experience start-up and shut-down cycles that induce repeated thermo-mechanical stresses. Under these high temperature thermo-thermo-mechanical cycles, damage accumulates eventually leading to a component failure. The type of damage seen in these high temperature service zones can include out-of-phase thermo-mechanical fatigue, creep-fatigue damage accumulation among many other factors [1-3]. Accurate TMF life prediction of components is of paramount importance to facilitate improved design-by-analysis methodology for maximizing the resistance of high temperature components and understand the failure mechanisms. In order to achieve a desired level of fidelity with reasonable accuracy without guess work, one should be able to identify all the phenomena of the material in these harsh environments. It is essential to understand these complex material responses, under realistic loading conditions, in order to substantially improve current design methodologies. Current industry standards use life prediction methods based on either simple elastic analyses or simplified inelasticity models using commercial finite element analysis (FEA) software and thus lack fidelity in the service life predictions. This calls for the development of a robust constitutive model capable of describing the interaction of different time and temperature-dependent phenomena, which occur as a result of very high temperature operation. The overall big picture process flow is shown in Fig. 1 for the development of a unified viscoplastic model needed for improved stress-strain fidelity in finite element simulation and fatigue design of a gas turbine engine.
generate the necessary responses of Haynes 230 under the full scope of service conditions seen in the combustor liner for an experimentally validated constitutive model. The Haynes 230 material in Fig. 1 was tested under a wide range of loading histories representative of service conditions. One such loading condition is shown in Fig. 1 for a cyclic isothermal strain-controlled low cycle fatigue test at an isothermal temperature of 427°C. Once the experimental responses are well understood, the unified constitutive model is developed in a hierarchical superposition, such that all mechanical features can be modeled.
-600 -300 0 300 600
-0.6 -0.3 0 0.3 0.6
Str es s, MP a Strain, % εx t Δε
Constitutive Modeling and Parameter Determination Finite Element Simulation
(USERMAT in ANSYS) & Fatigue Design 316 455 594 732 871 -300 -150 0 150 300 450
-0.4 -0.3 -0.2 -0.1 0
T (°C)
σx
(MP
a)
εx(%)
Experiment Simulation εx t T t ∆ε Tmax Tmin I II III IV
The modeling challenge was to develop a constitutive model capable of simulating the isothermal fatigue, creep-fatigue, and creep responses, as well as the thermo-mechanical creep-fatigue responses acceptably well for Haynes 230. A Chaboche-based constitutive model with several added features has been chosen. The constitutive model has the features of rate-dependence, static recovery, kinematic hardening evolution, strain range dependence, and mean stress evolution. These features are essential to adequately describe the broader ranges of material responses. The constitutive model development of Haynes 230 is demonstrated in steps II and III of Fig. 1 for simulating a complex in-service condition, like thermo-mechanical fatigue. The capability of the unified viscoplastic model to simulate out-of-phase thermo-mechanical fatigue is shown in Fig. 1 for a temperature cycling going from a minimum temperature of 316°C to a maximum temperature of 971°C that is out-of-phase to the strain cycling of a minimum strain of -0.4% (compression) to a maximum strain of 0%.
2. Scope and organization
The findings of this study are presented through the five chapters that follow written in journal paper format. Chapter 1 is the current chapter introducing the dissertation through a motivation and organization section. Chapters 2 to 6 are the five journal papers describing the various findings in detail. Finally, chapter 7 is the concluding chapter discussing the major conclusions and findings from this work and includes recommendations for future research.
Chapter 2 is a journal paper to be submitted to the International Journal of Plasticity on the isothermal fatigue and creep-fatigue responses of Haynes 230. Chapter 3 is a journal paper to be submitted to the International Journal of Solids and Structures on thermo-mechanical fatigue-creep responses of Haynes 230. These two chapters are the experimental program undertaken in this study needed for constitutive model development. The unified constitutive model for simulation of the fatigue, fatigue-creep, and creep responses of Haynes 230 are presented in the next two chapters, Chapters 4 and 5. Chapter 4 is a journal paper to be submitted to the International Journal of Solids and Structures on the simulation of isothermal low cycle fatigue and creep-fatigue responses of Haynes 230. The challenge was the development of a robust constitutive model capable of simulating a broad set of fatigue and creep-fatigue experiments across seven different temperatures ranging from 24 to 982°C (75 to 1800°F). The features of the constitutive model were dictated by the material response of Haynes 230 in Chapters 2 and 3. The modeling and the parameter determination were done in such a manner that the thermo-mechanical fatigue simulations were also successful. The developed Chaboche-based constitutive model of Chapter 4 includes features of rate-dependence, static recovery, kinematic hardening evolution, strain range rate-dependence, and mean stress evolution.
that are classically separated, novel ways of material identification of creep and fatigue-creep were essential and an isotropic damage theory was implemented for improving creep simulations. The gap between strain-controlled fatigue-type cyclic behavior and stress-controlled creep behavior is one that must be resolved for design. This research shows the ability to simulate both fatigue and creep using a unified viscoplastic constitutive model that has been missing in the literature.
Chapter 6 is a journal paper to be submitted to the International Journal of Computers and Structures on the implementation of a robust parameter determination for the unified constitutive model using both local and global optimization methods. Systematic calibration of material parameters was outlined and a user-developed hybrid genetic algorithm is shown. The benefits of a genetic algorithm were combined with the underlining physics of the material model in the initial estimation of parameters to guide an intelligent search. This hybrid simultaneous GA conducts both an exploitative and explorative search to find optimal parameter sets of the modified Chaboche model for unified viscoplasticity.
3. References
[1] Dedekind, M. O., & Harris, L. E. (1996). Evaluation of premature failure of a gas turbine component. International Journal of Pressure Vessels and Piping, 66(1), 59-76.
[2] Xie, Y. J., Wang, M. C., Zhang, G., & Chang, M. (2006). Analysis of superalloy turbine blade tip cracking during service. Engineering Failure Analysis, 13(8), 1429-1436.
CHAPTER 2:
A
N EXPERIMENTAL STUDY ON HIGH TEMPERATURE
LOW
-
CYCLE FATIGUE AND FATIGUE
-
CREEP RESPONSES OF
H
AYNES
230
Abstract
responses are correlated to justifiable microscopic evidence. Fatigue lives of isothermal creep-fatigue experiments have been closely examined to support ‘lifing’ models. It is essential to understand these complex material phenomena, under broad loading conditions and harsh environments, in order to substantially improve current design methodologies through developing experimentally validated advanced constitutive models.
Keywords: Haynes 230, creep-fatigue, fatigue life, dynamic strain aging, high temperature LCF
1. Introduction
The design of components and systems that experience thermo-mechanical fatigue at very high temperatures is extremely complex involving many failure mechanisms. Service components in the aerospace, nuclear power, chemical and automobile industry are some of these unique high-temperature systems that are rich in material complexities. Due to start-up and shut-down cycles, repeated thermo-mechanical stresses are induced that gradually degrade the life of a machine and its components. In the present study, the component of interest is the combustor liner in gas turbine engines, which are fabricated from sheets of Haynes 230. Haynes 230 is a Ni-Cr-W-Mo solid-solution strengthened superalloy, which possesses excellent high temperature strength and outstanding resistance to oxidation in deleterious environments. During turbine engine operation, the combustor components are subjected to thermo-mechanical fatigue (TMF) conditions, with temperature fluctuating between room temperature to as high as 982°C (1800°F). Consequently, some locations in the engine are subjected to strain or stress cycles of varying amplitudes, with temperature cycling either in-phase or out-of-phase to the mechanical strain cycle.
Steep thermal gradients caused by the temperature fluctuations lead to the creation of “hot spots” surrounding the effusion and dilution holes of the combustor liner (see Fig. 1). These critical spots initiate low-cycle fatigue cracks as shown in the inset of Fig. 1, which often reduces the design life of combustor liners from 10,000 hours to as low as 2,000 hours. Accurate TMF life prediction of components is of paramount importance to facilitate improved design-by-analysis methodology for maximizing the resistance of high temperature components. Material responses of these critical components may involve time-dependent processes such as creep, oxidation, dynamic strain aging, creep-fatigue, thermo-mechanical fatigue and cyclic creep or ratcheting that influence the integrity of the component [1-4].
Fig. 1: Combustor liner with cracking due to TMF (Courtesy of Honeywell Aerospace)
essential for the development of reliable life prediction techniques for critical components in aerospace, as well as automobile and power generation industries. This calls for the development of an appropriate robust constitutive model capable of describing the interaction of different time and temperature-dependent phenomena which occur as a result of very high temperature operation.
The first step towards the development of a robust constitutive model is a comprehensive understanding of material behavior under various loading conditions and across the entire temperature spectrum encompassing the operating service conditions. Despite the use of high temperature resistant superalloys, such as Haynes 230, combustor liners prematurely show cracking, which significantly increases the operation and maintenance expenses of jet engines. Hence, Haynes 230 must be understood under the full scope of service conditions seen in the combustor liner. Researchers have characterized the low-cycle fatigue behavior of various austenitic carbide precipitating (ACP) alloys, such as: IN617, HA188, Nimonic PE-16, 316L (N) stainless steel, and modified 9Cr-1Mo steel under high temperatures for different isothermal temperatures, strain rates, waveforms, peak hold positions, hold durations, and strain range parameters [4-26]. Most of these works primarily focused on discussing the micromechanical features of the fatigue responses from a limited number of experiments. Their studies of the mechanical behavior for these ACP alloys under uniaxial cyclic loading exposed to high temperatures revealed that generally increasing the temperature, decreasing the strain rate, or introducing a hold time causes a reduction in fatigue life [4,8-9]. The micromechanical evidence was provided in these studies to reveal the time-dependent damage mechanisms, such as dynamic strain aging, oxidation, creep, and the creep-fatigue crack initiation processes.
positive strain rate sensitivity of Inconel (Alloy) 617 at 950°C was ascertained. Again, much of their experimental study focused on the creep-fatigue crack initiation processes for the low-cycle fatigue tests with dwell times all at a mechanical constant strain range of 0.6%. In another study by Rao et al. [9], the influence of strain rate (10-6 to 10-3 s-1) and temperature (750, 850, 950°C) for Alloy 617 were investigated. Dynamic strain aging characterized by serrated flow was also shown at 750°C and at 850°C for higher strain rates. The influence of temperature across their temperature domain showed a complex cyclic stress response with varying material responses of either cyclically hardening or softening type behavior and a combination of the two.
be required in the development of a robust constitutive model for high temperature design applications.
To develop a constitutive model capable of simulating a broad range of material responses, one must plan an experimental study that replicates the service-conditions as closely as possible. An experimental program of Haynes 230 for low-cycle fatigue and fatigue-creep are presented in this study, while thermo-mechanical fatigue has been shown in a sister paper (Ahmed et al. [36]). These experiments were done with the aim of characterizing the scope of material behavior for the combustor liner service-like conditions as closely as possible. For the case of the airplane a typical flight consists of a start-up phase which leads to temperature rise, a steady phase coinciding with the flight time (0.5-14 hours), which keeps the high temperatures constant, and finally a shut-down phase which leads to temperature drop. The thermal nature of the loading and the geometry of the structure shown in Fig. 1 results in constraints which lead to compressive strains being induced in the vicinity of hot spots that try to expand. Thus, in combustor liners out-of-phase (OP) thermo-mechanical fatigue (TMF) is the phenomenon of primary interest, which is the decrease in axial strain (compressive strain) with an increase in temperature.
the challenge is to develop experimental data in a short period of time to imitate the relevant damage mechanisms, like creep, fatigue, TMF, and their interactions in several high temperature applications that can be used for robust constitutive model development. The modeling of thermo-mechanical creep-fatigue interaction is a challenge that requires a well-designed experimental program that includes isothermal LCF, fatigue-creep, pure creep, and anisothermal TMF tests.
To analyze engine operating conditions in the most efficient economic way, material testing was carried out on ASTM standard coupons of Haynes 230 for isothermal low-cycle fatigue, fatigue-creep, pure creep, and anisothermal thermo-mechanical fatigue tests. The experimental database encompassed a broad set of low cycle fatigue (LCF), symmetric, axial strain-controlled loading histories which included isothermal, with and without a mean strain, at temperatures ranging from 24 to 982°C (75 to 1800°F) for varying strain ranges. The experimental scope also investigated creep-fatigue responses for temperatures ranging from 649 to 982°C (1200 to 1800°F) with the introduction of dwell periods (hold times) at the peak compressive strain. Thermo-mechanical fatigue (TMF) experiments with phase angles between strain and temperature corresponding to in-phase and out-of-phase were also conducted on Haynes 230. In-phase TMF experiments corresponded to an increase in axial tensile strain with an increase in temperature, while out-of-phase experiments corresponded to a decrease in axial strain (i.e. increase in axial compressive strain) with an increase in temperature. Service-conditions were replicated as closely as possible for test parameters including but not limited to strain ranges, strain rates, and hold durations. For reproducibility and material reliability, over 120 isothermal low-cycle fatigue and fatigue-creep experiments at seven different temperatures ranging from 24 to 982°C (75 to 1800°F) were carried out.
one component of stress is prescribed in a multiaxial cyclic loading history involving some plastic deformation. The phenomenon of ratcheting refers to the progressive accumulation of deformation under cyclic loading, which has been of much interest in the plasticity community for many years. However, few experimental studies have been done for nickel-based superalloys like Haynes 230. Multiaxial tests have been conducted using axial-torsional tests. In the first phase of the multiaxial experiments, the influence of multiaxiality on ratcheting-creep-fatigue of Haynes 230 is investigated through prescribing symmetric shear-strain cycle at steady axial stress at various temperatures between 24 to 982°C (75-1800°F). The equivalent mean or steady axial stress, σm, in the stress-controlled experiments is taken as 0.1σy, where σy is the 0.2% offset yield stress of the monotonic tensile behavior of Haynes 230. Also, the equivalent shear strain amplitude, εa, is kept constant and the shear strain cycles are conducted at a strain rate of 20 cpm. These tests are taken to failure of the specimen. The next phase of the multiaxial experiments investigated the cyclic hardening-softening features of Haynes 230 under strain-controlled cycling of proportional triangular, axial cycling followed by the highest degree of non-proportionality, 90o out-of-phase sinusoidal out-of-phase cycling at the same equivalent strain amplitude, εa, at temperatures ranging from 24 to 982°C (75-1800°F). Multiaxial features of Haynes 230 will be presented in a future paper.
2. Experimental Study 2.1. Experimental program
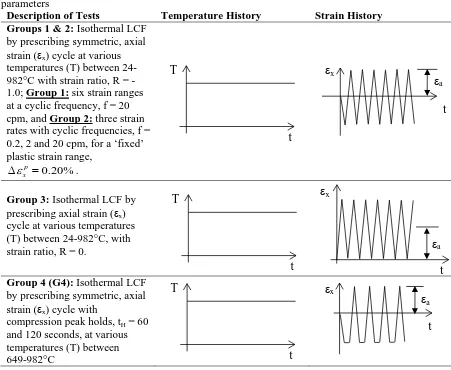
All testing was performed by an outside test vendor under close coordination with the investigators of the study. LCF tests with axial strain-controlled loading histories were performed at isothermal states with and without hold times, with and without a mean strain, as well as varying strain rates and strain ranges, at temperatures ranging from 24 to 982°C (75 to 1800°F). Continuous strain-controlled axial cycling had a triangular waveform with cyclic frequencies of 0.2, 2, and 20 cycles per minute (cpm) and imposed strain ranges varying from 0.30-1.60%. In order to explore the influence of test parameters, experiments were divided into four groups as shown in Table 1. Isothermal LCF tests under strain control conducted at a constant frequency of 20 cpm, with a strain ratio (min/max) of -1.0, and temperatures ranging from 24 to 982°C (75 to 1800°F), comprised Group 1. It is noted that some of these tests were conducted with sinusoidal control waveforms along with a different cyclic frequency in order to avoid instabilities experienced during these tests.
The isothermal, continuous LCF tests of Group 1 allow for the investigation of the effect of temperature and strain range on the hysteresis curve and Bauschinger effect, including the cyclic stress behavior as well as the isothermal LCF lifing. The Group 2 tests were conducted to explore the rate effects of Haynes 230 under cyclic frequencies of 0.2, 2, and 20 cpm. These cyclic frequencies were chosen to investigate the possible presence of rate effects. The plastic strain range can be calculated as shown in Fig. 2a, and roughly corresponds to the width of the hysteresis loop at zero stress. The tangent lines shown in Fig. 2a have slope equal to the elastic modulus for that particular temperature. Due to plasticity, with increasing temperature, the plastic strain range tends to increase faster as the material becomes viscous, as seen in Fig. 2b with the highest linear slope given by 982°C. As a result, it was important to keep a constant plastic strain range, such that a prescribed total strain range can be selected for each temperature. A fixed plastic strain was decided, as shown in Fig. 2b, by plotting the measured plastic strain range versus the total strain range at half-life for temperatures tested in Group 1. From the plot of plastic strain range vs. total strain range for all temperatures, in Fig. 2b, a baseline level of 0.2% ‘fixed’ plastic strain range, p
x ε
all temperatures were considered in the study of the rate effects. With a fixed plastic strain range of 0.2%, the various total strain ranges can be decided on for Group 2 testing to fully understand the rate dependency of HA230. Group 3 tests were performed under continuous, isothermal LCF with symmetric, axial strain-controlled loading histories on the tension side at a strain ratio (min/max), R= 0. The total strain ranges and temperatures are similar to many of the Group 1 experiments; however, the difference is manifested in the positive mean strain. The responses of the positive mean strain tests (Group 3) will demonstrate the effect of the mean strain along with tempearature and strain range on the hysteresis curve and lifing.
Table 1
LCF tests for Groups 1-4 with appropriate temperature and strain history over a scope of test parameters
Description of Tests Temperature History Strain History
Groups 1 & 2: Isothermal LCF by prescribing symmetric,axial strain (εx) cycle at various temperatures (T) between 24982°C with strain ratio, R = -1.0; Group 1: six strain ranges at a cyclic frequency, f = 20 cpm, and Group 2: three strain rates with cyclic frequencies, f = 0.2, 2 and 20 cpm, for a ‘fixed’ plastic strain range,
0.20% p
x ε
∆ = .
Group 3: Isothermal LCF by prescribing axial strain (εx) cycle at various temperatures (T) between 24-982°C, with strain ratio, R = 0.
Group 4 (G4): Isothermal LCF by prescribing symmetric,axial strain (εx) cycle with
compression peak holds, tH = 60 and 120 seconds, at various temperatures (T) between 649-982°C
t
T εx
t εa
εx
t εa
εa
εx
t t
T
Fig 2. (a) Measurement of plastic strain range for an isothermal LCF experimental hysteresis loop, (b) Measured plastic strain range as a function of the total strain range at half life for different
temperatures in selection of the ‘fixed’ plastic strain range: ∆εxp=0.20%
All of these tests, Groups 1-3, had strain ranges that were appropriately selected, given the test temperature, to obtain failure lives, Nf, between 2,000-100,000 cycles. The reduction
in the prescribed strain range with increased temperatures is needed to maintain reasonable plastic strain ranges as the material becomes more viscous. An increasing viscosity results in a softer material that is easily damaged; thus plastic strain ranges are larger. To avoid this problem, total strain ranges were reduced and as a result comparable fatigue lives were obtained. For all of these tests, the number of cycles to crack initiation Ni, and to failure Nf,
were defined as the cycle count where the amplitude stresses dropped to a value of approximately 5 and 30% respectively below the stabilized saturated stresses on the cyclic
-250 -125 0 125 250
-0.25 0 0.25
σx (MPa)
εx(%) HA230
T = 982°C Δεx= 0.39% (20 cpm)
Δεxp
Cycle 2000
0.00 0.40 0.80 1.20
0.00 0.50 1.00 1.50 2.00
Δεxp
(%)
Δεx (%)
24°C 204°C 427°C
649°C 760°C 871°C
982°C
0.20%
p x
ε
∆ =
(a)
hardening/softening curves. This is a common technique used in LCF testing in determining what constitutes crack initiation and failure.
A series of Group 4 tests investigated the creep-fatige respones of HA230 by prescribing, isothermal LCF with hold times imposed at the peak compressive strain. Dwell periods during a strain hold results in creep-type stress relaxation of the material. All Group 4 test strain ranges were decided based on the constant-plastic-strain-range-level 0.2% method of Fig. 2 and a fixed loading rate (ramping time) of 20 cpm. The temperatures ranged from 649°C to 982°C (1200°F to 1800°F). Hold periods, tH, of 60 and 120 seconds were imposed
to investigate the effect of various hold times. Operating temperatures were in the range where creep deformation occurs, so that the interaction between LCF and creep can be investigated. The microstructural characterization as well as the development of creep-fatigue interaction tests at elevated temperatures was pioneered by Rao and Rodriguez [4, 8]. Their contributions were made in highlighting the phenomenological effects of various strain-time loading histories on LCF and creep-fatigue interaction life as well as the mechanistic aspects of these macroscopic observations, specifically the nucleation and growth of cracks and cavities. In our present investigation, the hold periods were imposed at the compressive peak strain to imitate the flight periods of the gas turbine engines. Unlike, the previous experiments, Groups 1-3, these particular tests, Group 4, were not taken to failure because of the experimental costs.
2.2.Quantification of responses
Figure 3 shows a typical stress versus strain hysteresis loop response of Haynes 230 for the Group 4 experiments in Table 1. Group 4 was chosen to define all the necessary parameters for discussion purposes. In Fig. 3, the 500th cycle is shown for an experiment with an isothermal temperature of 871°C, strain range of 0.53%, and a hold time of 120 seconds. The figure shows the different measures used to quantify the cyclic response. The maximum
point A corresponds to the time at the end of the hold. The difference between the two is the stress relaxation denoted by ∆σxr.
(
max min)
2 2xa
σ = σ −σ ≡ ∆σ (1)
(
max min)
2xm
σ = σ +σ (2)
Fig. 3. Typical creep-fatigue hysteresis loop showing measurements made to quantify cyclic response
2.3. LCF and creep-fatigue testing procedure
The geometry of the specimens were solid circular with a gage length of 0.63 in and inner diameter of 0.250 in. as shown in Fig. 4. The specimen fabrication is done through machine processing that transforms the bulk material rods into a precise, useable specimen. After the material is blanked it must be rough machined from a rectangular geometry to a rounded, cylindrical shape through a low-stress grind technique. Once the shank and gage sections of the specimen are machined, Sheffield threads are ground in the LCF specimen providing extra friction in the grips of the load machine. Axial and circumferential polishing is done before the final quality control inspection is performed.
σ
∆
min
σ
max
σ
xr
σ
∆
A
Fig. 4. Geometry of the low cycle fatigue specimen (in)
After manufacturing, low cycle fatigue tests were performed on universal, servo hydraulic testing machines. The frames are outfitted with commercially available software used to control the test and collect data. All of the calibrations are done for each frame whether it is the load cell, alignment, extensometry, or general computer calibrations. For elevated temperature testing, heating is achieved through an induction heating system with thermocouples aligned for temperature uniformity. LCF tests were conducted in accordance to ASTM E606-04 standards.
2.4.Test material and metallography
The Haynes 230 alloy was supplied by Haynes International Inc. and received as bulk rods in solution annealed conditions. The as-received microstructure is presented in Fig. 5a. Microstructural grains are manifested as non-straight boundaries, whereas inside these boundaries annealing twins characterized by straight boundaries develop internally, as shown in Fig. 5b. The Haynes 230 alloy also contains precipitates which manifest themselves as particles inside the matrix (Fig. 5b). The sample was electrolytically etched in a solution containing hydrochloric acid (HCl) and hydrogen peroxide (H2O2) to reveal the
microstructural features. The precipitates were tungsten-rich primary carbides of the stoichiometric composition M6C type, where M denotes the metallic atom and C represents
fracture surfaces of the LCF specimens were examined by a scanning elctron microscope (SEM) to ascertain the crack initiation and propagation modes.
(a)
(b)
Fig.5. Typical microstructure of Haynes 230 alloy showing (a) rolling texture morphology of the primary carbides, M6C, and (b) annealing twins.
Table 2
Nominal chemical composition of Haynes 230 alloy, in wt. %
Ni Cr W Mo Fe Mn Si Al
60.344a 21.76 13.99 1.32 1.07 0.49 0.40 0.32
Co C Cu La Ti P B S
0.13 0.10 0.04 0.015 0.01b 0.005b 0.004 0.002b
a
As balance
b
Maximum
3. Results
3.1. Cyclic stress-strain responses from Groups 1-3
3.1.1. General hysteresis characteristics and the effect of mean strain
responses and stress amplitude/mean evolutions are plotted for intermittent cycles, Figs. 7-9. The loading rates of the tests are also shown in the figures. Despite the difference in the strain ratio (R) of the prescribed strain-cycles in Group 1 and Group 3 experiments, a key observation made was that the hysteresis loops, and amplitude and mean responses from the two groups for temperatures up to 760°C (1400°F) are similar as shown in Figs. 6-7. For temperature 760°C and above, some differences between the responses are observed, which are magnified in the stress amplitude responses of Figs. 8-9. With a positive mean strain (R=0), the stress amplitude responses for both 760°C (Fig. 8c) and 982°C (Fig. 9c) are lower when compared to the symmetric Group 1 experiments without a mean strain (R=-1). The mean stresses from the positive mean strain Group 3 experiments behaved quite similarly to Group 1 experiments without a mean strain, as can be seen in the mean stress evolutions of Figs. 6-9. For both Group 1 and 3 experiments, small negative mean stresses develop indicating that hysteresis cycles are asymmetric with respect to the strain axis for all temperatures. The asymmetry of the hysteresis cycle develops due to the material developing larger stresses in compression than in tension. For high temperature experiments 427-982°C (800-1800°F), controlling the strains in a stable manner was difficult, and hence prescribed loading histories were changed from saw-tooth to sinusoidal and the desired strain range was often arrived at incrementally (Figs. 7b, 8, 9b). Sinusoidal loading history at high temperatures yields rounded hysteresis loop peaks as shown in Fig. 9b. Another interesting phenomenon is the time-dependent nature of the hysteresis loop specifically seen at 982°C (Fig. 9a) even for a saw-tooth loading history. Viscous effects of the material can cause the hysteresis loops to round at the stress peaks and valleys. This rounding effect was also seen in stainless steel [37]; as a result, the hysteresis cycles become rounded and the peak stresses do not match peak strains.
(a) (a)
Fig. 6. HA230 responses under LCF, strain range 1.4%, 24°C for (a) Hysteresis loops from
symmetric, saw-tooth, strain-controlled cycles (R = -1), (b) Hysteresis loops from tensile, saw-tooth, strain-controlled cycles (R = 0), and (c) stress amplitudes and means as a function of
cycles from experiments (1MPa=0.145ksi)
Fig. 7. HA230 responses under LCF, strain range 1.0%, 427°C for (a) Hysteresis loops from symmetric, saw-tooth, strain-controlled
cycles (R = -1), (b) Hysteresis loops from tensile, saw-tooth, strain-controlled cycles (R =
0), and (c) stress amplitudes and means as a function of cycles from experiments
Fig. 8. HA230 responses under LCF, strain
range 0.6%, 760°C for (a) Hysteresis loops from symmetric, sinusoidal, strain-controlled cycles
(R = -1), (b) Hysteresis loops from tensile, sinusoidal, strain-controlled cycles (R = 0), and
(c) stress amplitudes and means as a function of cycles from experiments (1MPa=0.145ksi)
Fig. 9. HA230 responses under LCF, strain range 0.39%, 982°C for (a) Hysteresis loops from symmetric, saw-tooth, strain-controlled
cycles (R = -1), (b) Hysteresis loops from tensile, sinusoidal, strain-controlled cycles (R =
0), and (c) stress amplitudes and means as a function of cycles from experiments