GENETIC MAPPING
IN
SACCHAROMYCESR. K. MORTIMER A N D D. C . HAWTHORNE
Division of Medical Physics, University of California, Berkeley' and Department of Genetics, University of Washington, Seattle
Received August 26, 1965
I N
our first report of linkage relationships of centromere-linked genes in Sac- charomyces, 25 genes were located on ten chromosomes (HAWTHORNE and MORTIMER 1960). Three additional chromosomes have since been proposed by LINDEGREN, LINDEGREN, SHULT, and HWANG (1962) ; and HWANG, LINDEGREN, and LINDEGREN (1963, 1964). The present work extends the linkage maps of this yeast by providing evidence for 14 linkage groups as well as additional link- ages on the established chromosomes. Linkage groups that may represent still other chromosomes also are described.MATERIALS A N D METHODS
The genes included i n this report are listed i n Table 1. A description of these loci is given in the report of the Carbondale Yeast Genetics Conference (1963). The techniques for the isolation and sporulation of diploid hybrids, and the isolation and analysis of spore tetrads, have been described (HAWTHORNE and MORTIMER 1960). Only complete tetrads are included in the analyses. To the tests and media described i n the previous paper can be added actidione resistance scored at a concentration of 1.3 pg/ml i n synthetic medium.
Since the hybrids used were frequently heterozygous for 20 or more genes, replica plating techniques were employed to reduce the labor required to score the characters. In most hybrids there were ,several cases where two or more genes controlled a given phenotype. For these com- binations it was necessary to perform intergenic complementation tests on the spore progeny. Secondary master plates, cross-stamped with appropriate tester strains of both mating types, were incubated for one day to permit mating and then replica-plated onto the diagnostic media to score the segregation of the individual complementing genes.
Marker localization. I n addition to standard tetrad analysis procedure, discussed below, two additional techniques were of considerable value in locating genes on the linkage map. One of the techniques involved the use of disomic test stocks. If the hybrid of the mutant and disomic stocks is of constitution A / A / a , then asci with abxrant segregation ratios, 4:O and 3:1, will predominate. The observation of only 2:2 ratios establishes that the marker is not on the chromo- some that is disomic. In practice, a normal haploid carrying a number of unmapped genes is crossed to the disomic to increase the efficiency of this method. Because the disomic cultures are relatively unstable and tend to lose the extra chromosome, it is necessary to construct the hybrid with one genetic marker known to be on the chromosome in duplex condition to confirm the presence of the extra chromosome.
Markers can be restricted to a given chromosome arm and their sequence determined by mitotic segregation studies. Such techniques have been used extensively with Aspergillus (PONTECORVO and GFER 1958). In yeast, sectoring of colonies formed by irradiated heterozygous diploid cells was first described by JAMES and LEE-WHITING (1955). ROMAN (1956) has analyzed mitotic segregants that occur spontaneously in diploid yeast heterozygous for various adenine
166 R. K. MORTIMER A N D D. C. HAWTHORNE
color markers. In the majority of cases, it has been established that segregation occurs through mitotic crossing over. Concomitant sectoring of markers is a criterion of linkage, and the fre- quency with which concomitance occurs is a measure of the degree of linkage and indicates the position of a given marker, proximal or distal, with reference to another.
Indications of linkage with the above procedures are pursued by conventional tetrad analysis. I n tetrad analysis, the statistic employed to determine if two genes A and B are linked in the cross AB
x
ab is the ratio of parental ditype (PD) asci, AB AB ab ab, to nonparental ditype (NPD) asci, Ab Ab aB aB, to tetratype (T) asci, AB Ab aB ab. Linkage is indicated when the PD:NPD ratio is significantly greater than one. The distance z, in centimorgans, between the two genes can be obtained from the equation, z = [ ( T+
GNPD) X 1 0 0 ] / [ 2 ( P D -k N P D4-
T ) ](PERKINS 194-9).
Although unordered tetrads generally are isolated for genetic analysis in Saccharomyces, it
is possible to determine the first-division segregation pattern in individual asci when several known centromere markers are included in the cross (HOWE 1956; HAWTHORNE and MORTIMER 1960). A new marker is accepted as centromere-linked if its second-division segregation (SDS) frequency is significantly less than two-thirds. An SDS frequency in excess of is considered to be the consequence of strong chiasma interference. Markers found to be centromere-linked were tested for linkage against known centromere markers.
RESULTS
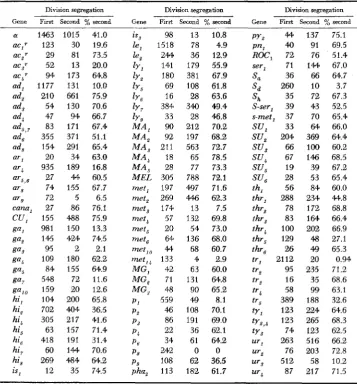
Centromere linkage: A compilation of the second-division segregation fre- quencies of 102 genes is given in Table 1. One third (34/102) of these genes exhibit centromere linkage. Sixty percent second-division segregation was taken as a convenient value for the demarcation of the centromere-linked class. A gene could be misclassified on the basis of this criterion either because of statistical fluctuations or because of chiasma and chromatid interference patterns that would lead to SDS frequencies below
%
for genes considerably removed from the centromere.Our first map included the following centromere markers: I-ad,, II-ga,, III-a
and hi4, IV-tr, and ga,, V-urs, VI-hi,, VII-te,, tr,, and ad,, VIII-p,, ar4, and
thr,,
IX-hi,
and l y l , and X-met,. However, we concur in the assessment by LINDEGREN et al. (1962) that the use of met, as a centromere marker defining a new linkage group was premature. In its stead, they proposed that another me- thionine gene, met,, be adopted as the centromere marker of chromosome X(LINDEGREN et al. 1962). HWANG et al. (1963) showed that metll segregated independently from the above centromere markers and thus represented a new chromosome, X I . A twelfth chromosome was also proposed by
HWANG
et al.(1964) as containing the markers thr, and ly7. Our own studies of hybrids hetero- zygous for thr, and ly7 show that these two genes not only assort independently with respect to the centromere markers of linkage groups I through XI but are themselves unlinked (Tables 3, 4). Accordingly, we have retained thr, for link- age group XI1 and have assigned ly7 to the centromere of linkage group XIII.
Another new linkage group, XIV, is established with the demonstration that p . is unlinked to all the above centromere markers (Tables 3, 4 ) . The remaining centromere-linked genes from Table 1 have been mapped on the above linkage groups: 11, ac: (DESBOROUGH, SHULT, YOSHIDA, and LINDEGREN 1960), p9, ga,,
TABLE 1
Second-division segregation frequencies of 102 genes in Saccharomyces
Division segregation Division segregation Division segregation
Gene First Second % second Gene First Second %second Gene First Second %second
(Y 1463 1015 41.0 ac,? 123 30 19.6 acZT 29 81 73.5 acJr 52 13 20.0 a c , T 94 173 64.8 ad, 1177 131 10.0 ad, 210 661 75.9 ad, 54 130 70.6 ad, 47 94 66.7 ad,, 7 83 171 67.4 ad, 355 371 51.1 ad, 154 291 65.4
ar, 20 34 63.0
ar, 935 189 16.8
ar5,6 27 44 60.5
ar, 74 155 67.7
arg 72 5 6.5 canal 27 86 76.1 CU, 155 488 75.9
gal 981 150 13.3
ga, 145 424 74.5
ga, 109 180 62.2 ga, 84 155 64.9 ga7 548 72 11.6 gal, 159 20 12.6 hi, 104 200 65.8 hi, 702 404 36.5 hi, 305 217 41.6 hi, 63 157 71.4 hi, 418 191 31.4 hi, 60 144 70.6 hi, 269 484 64.2 is, 12 35 74.5
ga, 95 2 2.1
98 1518 244 141 180 69 16 384 33 90 92 21 1 18 28 305 197 269 174 57 20 64 44 133 42 71 48 559 46 86 22 34 242 108 113 13 78 36 179 381 1 08 28 34Q 28 212 197 563 65 77 788 497 446 13 132 54 136 68 4 63 131 90 49 108 191 36 61 0 62 182 10.8 4.9 12.9 55.9 67.9 61.8 63.6 49.4 46.8 70.2 68.2 72.7 78.5 73.3 72.1 71.6 62.3 7.5 69.8 73.0 68.0 60.7 2.9 60.0 64.8 65.2 8.1 70.1 69.0 62.1 64.2 0 36.5 61.7
py2 44 137 75.1 pn, 40 91 69.5 ROC, 72 76 51.4 sei-, 71 144 67.0 S , 36 66 64.7
S, 35 72 67.3 S-ser, 39 43 52.5
s-met, 37 70 65.4 S U , 33 64. 66.0 SU, 204 369 64.4 SUS 66 100 60.2 SU, 67 146 68.5 SU, 19 39 67.2 SU, 28 53 65.4 th, 56 84 60.0 thr, 288 234 44.8 thr, 78 172 68.8 thr, 83 164 66.4 thr, 100 202 66.9 thr, 129 48 27.1 thr, 26 49 65.3
tr, 2112 20 0.94
tr, 95 235 71.2 tr, 16 35 68.6
tr, 58 99 63.1
tr, 389 188 32.6 tY 1 123 224 64.6
ty,,, 123 265 68.3 t y , 74 123 62.5 ur, 263 516 66.2
ur, 76 203 72.8 ur, 512 58 10.2 urq 87 217 71.5
Sd 260 10 3.7
The symbols refer to the following phenotypes: a/a mating-type gene; nutritional requirements: ad- adenine, ar- arginine hi- histidine, is- isoleucine or isoleucine plus valine le- leucine ty- lysine met- methionine ph- phenyl-
alanine,'py- pyridoxine, pn- pantothenate, ser- serine, th- thiamine, thr- threonine (ihr, and ihr4) or hreonine plus
methionine (thr,, thr,, thr,, and thr#), tr- tryptophan, ty- tyrosine ( t y , ) , tyrosine plus phenylalanine (ty*,+) or tyrosine plus phenylalanine plus tryptophan (ty,), and ur- uracil; resistance genes: ac- actidione, cana- canavine, CU- copper;
ROC- roccal; carbohydrate utilization: ga- galactose nonfermenter, M A - maltose fermentation, MEL- melibiose, MG- alpha-methyl glucoside, SU- sucrose; genetic petite loci: p ; suppressors: S, to S,- super suppressors, (HAwTnonNE and MORTIMER 1963), S-ser, and s-met,- specific suppressors. The subscripts (number or letter) identify particular genetic loci.
V, S-ser, and ar, (Table 2); VI, metlo (LINDEGREN et al. 1962) and S d (Table
2 ) ; VII, acl; (Table 2 ) ; X, is, (Table 2 ) ; XII, ROC: (Table 2 ) ; and XIV, Zys
(Table 2 ) .
Additional linkages: Trisomic analysis provides unambiguous evidence for
168 R. K. MORTIMER A N D D. C. HAWTHORNE
analysis. The validity of the technique has been demonstrated by ROMAN,
PHILLIPS and SANDS (unpublished) who showed that the genes a, hi,, ga,, SU,,
and ur, were on different chromosomes. In addition, the linkage of hi, and tr,
( LINDEGREN and LINDEGREN 195 1 ) was demonstrated by this technique, and one other pair of genes, ur, and me,, were located on another chromosome. Ad- ditional stocks, disomic for the chromosomes I, 11, VII, or VIII, were included in another attempt to locate new mutants (TAKAHASHI and HAWTHORNE, unpub- lished). The location of genes already mapped on these chromosomes was con- firmed, and hi, was found to be on linkage group 11. The linkage of ur, and me, was verified and linkage groups I through V, VII, VIII, IX, and XI1 were elimi- nated as possibilities for the location of this linkage group.
The linkages and order of the loci c (centromere) -ad,-MA,-ad,, c-ac;-Zy,- ad,,,, c-ty,-thr,-tr,-ad,, and c-ad,-sei-,-hi,, were originally established by mi- totic recombination studies (ROMAN 1956; NAKAI and MORTIMER, in prepara- tion;
JOHNSTON
and MORTIMER, in preparation; GILMORE, unpublished) and then confirmed in part by tetrad analysis (Table 2). The first two groups proved to be on the two arms of linkage group VII. The other two groups are either on unmapped arms of the identified linkage groups or represent new linkage groups. Miscellaneous cases of linkage have been discovered by tetrad analysis. They have been appended to the list in Table 2 and included in the maps when three or more loci are involved. For two of the longer linkage groups, pha,-met,-p,(Table 2, Fragment 3) and SU,-hi,-Zy,, (LINDEGREN et al. 1962; and Table 2, Fragment
4),
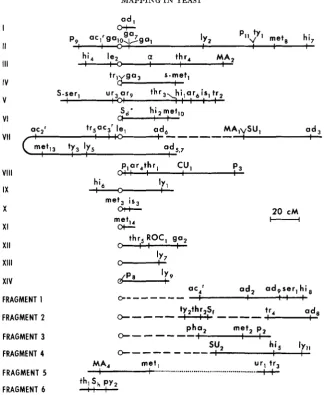
mitotic segregation techniques were used to determine the proxi- mal markers, pha, and SU,. The segregation of these two genes relative to the centromere markers gave no tetrad ratios indicative of linkage.Linkage maps: Maps based on the data in Tables 1 to
4
are presented in Figure 1. For all linkage groups, the genes have been ordered by the analysis of crosses that segregated for all or most of the genes on the particular linkage group. Gen- erally, the order was apparent from the relative lengths of the gene-gene or gene- centromere intervals and consistent sums or differences were observed. On oc- casion, however, it was necessary to inspect the crossover pattems in individual asci and choose the sequence which minimized the number of multiple ex- changes.The order is still ambiguous in several clusters of genes. Mitotic recombination experiments have been used in placing gal, proximal to gal, but the position of gar in this cluster has not been determined. Thus far, crosses involving these three genes have not yielded tetrads with meiotic exchanges. Other cases where no o r negligible crossing over has hindered the mapping efforts are: centromere IV-
trI-gas, Sul-MA,, SU,MA,MG,, and p,,-ty,.
DISCUSSION
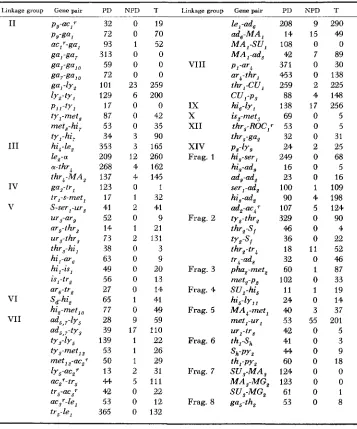
TABLE 2
Tetrad data indicating gene to gene linkage (for description of gene symbols see footnote to Table i)
Linkage group Gene pair PD NPD T I.inLage group Gene pair P D NPD T
I1 Pg-QC,
pg-ga,
ac, r-gal
ga,-ga, ga,-ga,, ga,-ga,
,
gQ,-lY, ~ Y , - t Y , Pll-tY 1ty,-met, met,-hi, ty,-hi,
I11 hi4-le,
le,-@ a-thr, thrl - M A
,
tr,-s-met,
v
S-ser,-ur,ur3-arg ar,-thr, ur,-thr, thr,-hi, hi,-ar, hi,-is, Is,-tr, ar,-tr,
VI S,-hi,
hi,-met,,
IV ga,-tr,
VI1 ad,,,-lY,
ad,,,-ty, tY,4Y5 tY,-met,
,
met, s-acz ly,-ac,r acgr-tr, tr5-acSr ac,r-le, tr5-Lel32 0 19
72 0 70
93 1 52
313 0 0
59 0 0
72 0 0
101 23 259 129 6 200
17 0 0
87 0 42
53 0 35
34 3 90
353 3 165 209 12 260 268 4 162 137 4 145
123 0 1
17 1 32
41 2 41
52 0 9
14 1 21
73 2 131
38 0 3
63 0 9
4.9 0 20
56 0 13
27 0 14
65 1 41
77 0. 49
28 9 59
39 17 110
139 1 22
53 1 26
50 1 29
13 2 31
44 5 111
42 0 22
53 0. 12 365 0 132
VI11
IX
x
XI1 XIV Frag. 1Frag. 2
Frag. 3 Frag. 4 Frag. 5
Frag. 6
Frag. 7
Frag. 8
le,-ad, adfi- M A , M A ,-SUI MA,-ad,
ar,-thr, t h r , C U ,
hi,-ly, is,-met, thr,-ROC, r thr,-ga, hi,-ser, hi,-adg ad,-ad, ser,-ad, hi,-ad, ty,-thr, thr,-Sl thrz-trb tr4-ad, pha,-met, met,-p, SUS-hi, MA4+”, met,-ur, ur,-tr, th,-Sh Pi-ar4 CU,-P, P8-lY9 Qdz-ac4r iY*-S, hi5-1Y11 Sh-pYe t h i P Y , SU,-MA, MA,-MG, SU,-MG, ga,-th,
208 9 290 14 15 4.9
108 0 0
42 7 89
371 0 30
453 0 138 259 2 225 88 4 14.8 138 17 256
69 0 5
53 0 5
32 0 31
24 2 25
249 0 68
16 0 5
23 0 16
100 1 109 90 4 198 107 5 124
329 0 90
4 6 0 4
36 0 22
18 11 52
32 0 46
60 1 87
102 0 33
11 1 19
24 0 14
40 3 37 53 55 201
42 0 5
41 0 3
4 4 0 9
60 0 18
124 0 0
123 0 0
61 0 1
53 0 8
PD=parental ditype ascus; NPDxnonparental ditype: T = tetratype.
,x
P
s
1
*-
E
z
a d .
hi, l e 2 n
-
Q thr, M A 2 trIvga3 s - m e t lV l l l
IX
X
X I
XI1
Xlll
XIV
FRAGMENT 1
FRAGMENT 2
FRAGMENT 3
FRAGMENT 4
0: p,ar,thr, : : CUI r 3
hi, h
'7,
" $U
-v met, is,
*
thr5ROC, gal 0 : :
l Y
w7
20 CM
-
m e t , ur, tr,
-H- '
... .. . .
.... .
... ...
Mp4 FRAGMENT 5
th,S, PY2 FRAGMENT 6
FIGURE 1 .-Genetic maps of Saccharomyces. Linkage established by tetrad analysis is repre- sented by a solid line. The map distances were computed from the data in Tables 1 and 2. For
the linkages established by mitotic segregation (dashed line) or by trisomic analysis (dotted line) only the sequences have significance.
somes. However, the distribution of the 34 centromere-linked genes on these 14 chromosomes-one chromosome with 5 genes, one with 4, four with 3, five with 2, and three with l-leads to an estimate of 16 or 17 for n if a Poisson distribution is assumed for this sample. This estimate for n has received support from the recent cytological studies of S. TAMAKI (1965) who has counted 18 bivalents in the first meiotic prophase of diploid hybrids from our breeding stocks.
1 72 R. K. MORTIMER A N D D. C. HAWTHORNE
100 centimorgans for several of the chromosome arms. In fact, it would appear that the average length of the chromosome arms might be at least 100 centi- morgans. This estimate is based on the fraction of genes showing centromere linkage, 34/102, and the assumptions: ( 1 ) that there is an even distribution of markers along the chromosome arm, and (2) that genes less than 33 units from the centromere have been recognized as centromere markers. There are two opposing biases in the above sampling of centromere markers: ( 1 ) some centro- mere-linked genes may have been missed. For example, genes like pha, and SU,
which show more than 60% but less than 67% second-division segregation were not included among the centromere markers unless they had been mapped on the established chromosomes. (2) The 102 loci for which second-division segre- gation frequencies have been presented in Table 1 include more than a random sample of centromere-linked genes. More than 150 markers were given a rough screening for centromere linkage-usually about 20 asci were analyzed-and generally only those genes which gave a second-division segregation frequency of less than 50% were pursued further unless they were involved in a biosyn- thetic pathway of interest to our colleagues. When both factors are considered,
100 centimorgans is a conservative estimate of the average chromosome arm length.
From the above estimate for the chromosome arm length, and assuming that the chromosomes are metacentric, we could expect a total map length as great as
3600 centimorgans. A summation of the gene-to-gene and gene-to-centromere intervals of the maps in Figure 1 gives a minimum length of 1300 centimorgans. Thus, less than half of the predicted genome is encompassed in these maps.
SUMMARY
In a search for centromere-linked genes, tetrad analyses have been made to obtain second-division segregation frequencies for 102 loci. Thirty-four of the genes were shown to be centromere-linked and located on 14 different chromo- somes. Twenty-four other genes have been mapped in the linkage groups, and another 28 genes comprise eight linkage groups not yet associated with a centro- mere. The length of the genetic map now exceeds 1300 centimorgans, but it is estimated that the present map covers less than half of the entire genome.
LlTERATURE CITED
Carbondale Yeast Genetics Conference, 1963
DELAMATER, E. D., 1950 The nuclear cytology of vegetative diplophase of Saccharomyces
cereuisiae. J. Bacteriol. 60: 321-332.
DESBOROUGH, S., E. E. SHULT, T. YOSHIDA, and C. C. LINDEGREN, 1960 Interference patterns DOUGLAS, H. C., and D. C. HAWTHORNE, 1964 Enzymatic expression and genetic linkage of genes
GANESAN, A. T., 1959 The cytology of Saccharomyces. Compt. Rend. Trav. Lab. Carlsberg, Ser. Microbial Genet. Bull. 19 (Suppl.)
.
in family Y-1 of Saccharomyces. Genetics 45: 1467-1480.
controlling galactose utilization in Saccharomyces. Genetics 49 : 837-844.
Chromosome mapping in Saccharomyces: Centromere-linked genes. Genetics 45: 1085-1 110. - 1963 Super-suppressors in yeast. Genetics 48: 617-620.
Crossing over and nuclear passing in Neurospora crassa. Genetics 41:
Mapping of the eleventh centromere in Saccharomyces. Can. J. Genet. Cytol. 5: 290-298.
-
1964 The twelfth chromosome of Saccharomyces. Can. J. Genet. Cytol. 6: 373-380.JAMES, A. P., and B. LEE-WHITING, 1955 Radiation-induced genetic segregations in vegetative cells of yeast. Genetics 40: 826-831.
LINDEGREN, C. C., and G. LINDEGREN, 1951 Linkage relationships in Saccharomyces of genes controlling the fermentation of carbohydrates and synthesis of vitamins, amino acids and nucleic acid components. Indian Phytopathol. 4: 11-20.
LINDEGREN, C. C.. G. LINDEGREN, E. SHULT, and Y. L. HWANG, 1962
affinity and gene loci on the chromosomes of Saccharomyces. Nature 194: 260-265. MCCLARY, D. O., M. A. WILLIAMS, C. C. LINDEGREN, and M. OGUR, 1957
in a polyploid series of Saccharomyces. J. Bacteriol. 73 : 360-364. PERKINS. D. D., 1949
607-626.
PONTECORVO, G., and E. KAFER, 1958 ROMAN, H., 1956
TAMAKI. S., 1965
HAWTHORNE, D. C., and R. K. MORTIMER, 1960
HOWE, H. B., 1956
HWANG, Y. L., G. LINDEGREN, and C. C. LINDEGREN, 1963 610-622.
Centromeres, sites of
Chromosome counts
Biochemical mutants in the smut fungus Ustilago maydis. Genetics 34:
Genetic analysis based on mitotic recombination. Advan.
A system selective for mutations affecting the synthesis of adenine in yeast.
Chromosome behavior at meiosis i n Saccharomyces. J. Gen. Microbiol., in Genzt. 9: 71-104.
Compt. Rend. Trav. Lab. Carlsberg, Ser. Physiol. 26: 299-314.