SELECTION FOR EGG NUMBER WITH X-RAY-INDUCED VARIATION
H. ABPLANALP, DOROTHY C. LOWRY, I. M. LERNER, AND E. R. DEMPSTER Departments of Poultry Husbandry and Genetics, University of California, Berkeley
XPERIMENTS designed to utilize radiation-induced genetic variability
E
through artificial selection are relatively recent. Unlike studies with muta- tions of specific well known genes where mutation frequencies can be obtained by enumeration, the quantitative experiments rely on the measure of genetic variation and selection response as the measure of induced mutation effects. Neither the frequencies nor the magnitude of individual gene effects are known under those circumstances, so that much less precise statements can be made about genetic mechanisms underlying radiation response. Nevertheless, it has been shown for Drosophila and many species of plants that radiation-inkred polygenic variation can be of sufficient magnitude to be important. With rela- tively high doses of radiation (up to 100,000r) plant geneticists have been able to increase genetic variation up to sixfold of that observed in natural populations, but the effectiveness of such treatments clearly depends on whether the character considered shows an average decline from irradiation (BROCK and LATTER 1961). Thus. improvements from selection following irradiation appear more pro- nounced for traits such as plant height (RAWLINGS, HANWAY, and GARDNER 1958 for soya beans) o r early maturity (BROCK and LATTER 1961 for subterranean clover) than for yield, which is initially reduced by radiation (GREGORY 1955 for peanuts; RAWLINGS, HANWAY, and GARDNER 1958 for soya beans).In animals almost all published evidence on selection with radiation-induced variation has been obtained with Drosophila. Two early experiments by SERE- BROVSKY (1935) and ROKIZKY (1936) in Drosophila melanoguster showed rela- tively little added selection response in abdominal bristles due to radiation. More striking responses were obtained by SCOSSIROLI (1954) who was able to almost double the number of sternopleural bristles by alternative selection and radiation in a population that had presumably reached a plateau for that trait under pre- vious selection. He ( SCOSSIROLI and SCOSSIROLI 1959) later repeated essentially the same experiment with isogenic lines and a population based on crossing two isogenic lines with very similar results. In the latter case he was able to increase sternopleural bristle number from about 17 to 25 over ten generations of selection with 3000r of X radiation given to both males and females. Smaller but consistent effects of radiation on selection response and genetic variation were obtained by CLAYTON and ROBERTSON (1955) for abdominal bristles in highly inbred lines of
D.
melunoguster derived from their Kaduna population, and using a dose of only 1800r of X rays per generation. In contrast to these successful selection experi- ments with bristles there is little evidence that viability in Drosophila can be improved by radiation followed by selection (WALLACE 1956; CARSON 1964).1084 H. ABPLANALP et al.
Unlike bristle number, the fitness of a population is adversely affected by radi- ation and natural selection operating on possibly induced favorable variation appears to be insufficient to carry the populations beyond their original levels
(CARSON 1964).
In view of the relatively recent advent of radiation genetics, and the apparently high dose of radiation required to produce substantial amounts of induced vari- ation, it is not surprising that to date little evidence of this type has been published for higher animals. Our experiment was among the first of its kind to be started after SEREBROVSKY'S early efforts, but it is only now, some 12 years later, that some conclusions can be drawn from its results.
MATERIALS A N D METHODS
The base population. The present experiment on radiation-induced variability was initiated in 1952. I t made use of a base population of Single Comb White Leghorn chickens (the so-called Production Line, P) which had been under selection for high egg production since 1932. Its selection history, including many results, has been given by LERNER (1958). In the first 20 years of its existence (about 12 generations) this population had almost doubled its egg production to about 75 weeks of age, the trait primarily selected. At the same time mortality had been reduced and egg size was held approximately constant by suitable selection pressure against hens of small egg size. In the early 1950's it appeared that selection response in egg number had fallen off considerably (LERNER and DEMPSTER 1951) and the possibility was considered that the population was approaching a plateau in response. This population was therefore at a point in its selection history where X-ray-induced variability for high egg number might be detected more readily than i n other, less advanced flocks. Figure 1 shows the selection response of the Production Line (P) f o r January production of all pullets housed. This early measurement of production also reflects reduced selection response in the early fifties but indicates that further gains were made later on. The Production Line showed a gradual increase of the calculated inbreeding coefficients typical f o r a population of its size (about 12 males each mated to 12 females). The average increase of F suggests an effective population size of between 30 and 35 individuals.
Selection procedures in the base population used were changed somewhat just before the radiation experiment was started. from selection of mostly two-year old hens with full annual egg records, to pullets with production measured till January 1 of their first laying year or about 4.2 weeks of age. This shift in emphasis on early selection decisions (LERNER and DEMPSTER 1956) served to shorten generation length to one year. Selection decisions were then based on an index combining family and individual performance of hens in a manner believed optimal for rapid gains in egg number. The procedure has been described in detail by LERNER (1958, Box 17). By 1954 and thereafter all selection decisions were made on the basis of part records, and generation intervals became exactly one year.
The radiation phase: The present experiment was carried out in two distinct phases. The first was initiated in 1952 by extracting from the P line two sublines, one irradiated without artificial selection (X) and a control line (C) treated in all respects as (X) except for irradiation (Figure 2). A total of 8000r of X radiation was administered to mixed semen of the treated line, over a period of seven generations with doses of 1000 or 15001- per generation, depending on the reproductive fitness of the population and the time available for hatching offspring. The plan called for as rapid a generation turnover as possible, with a minimum of expense and space requirements. Thus, all matings in the X and C lines were unpedigreed with semen of groups of
four males mixed before inseminations and systematic rotation of male groups among the avail- able females. In each of the two lines about 41) to 60 males and a slightly larger number of females were used.
SELECTION O N I N D U C E D VARIATION 1085
1 0 0 -
90
8 0 -
-
-JANUARY PRODUCTION INDEX
~ INBREEDING COEFFICIENT
-a4
- 4 2 z-
20 -
w
YEAR
FIGURE 1 .-Selection response and inbreeding coefficients of the base population (P) selected continuously for high egg production.
14 sires each mated to about ten dams. The effective population size of X and C lines was thus at least double that of the P line, but lack of pedigrees in the former two lines makes a precise evaluation impossible. In the time required to produce seven irradiated generations for X, the P line was selected for egg number and completed somewhat less than five generations (Figure 2). Following the last (seventh) irradiation in 1957, the X and C populations were reproduced
TABLE 1
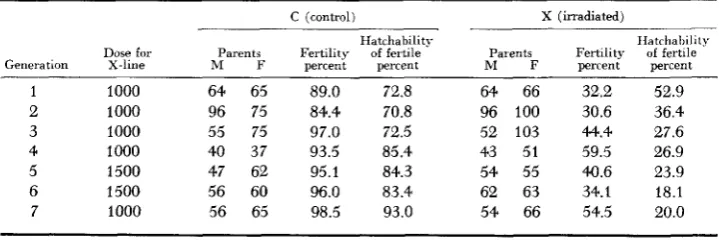
Numbers of reproducing parents, X-ray dosage applied, percent fertility and percent hatchability of fertile eggs of lines during radiation phase of the experiment
-
C (control) X (irradiated)
Hatchability IIatrhaldity
Dose for Parents Fertility of fertile Parents Fertility of fertile Generation X-line M F percent percent M F percent percent
1 1000 64 65 89.0 72.8 64 66 32.2 52.9 2 1000 96 75 84.4 70.8 96 100 30.6 36.4 3 1000 55 75 97.0 72.5 52 103 44.4 27.6 4 1000 40 37 93.5 85.4 43 51 59.5 26.9 5 1500 47 62 95.1 84.3 54 55 40.6 23.9
1086
A -
CowTYylWS SELECTION
H. ABPLANALP et al.
PLAN OF EXPERIMENT
: 4 R
--+--t-+-+Rc
SELECTED FLOOR
RELAXED CAQE
-+--+-+-+-I--+++-
p-RAY
RELAXED RESELECTED FLWR- t - t - - C - t + - - C - t + 1 c r
PCDNTROL RELAXED RESELECTED FIROR
: IR
SELECTED
YEAR
FIGURE 2.-Plan of the radiation experiment.
once more with some mass selection for early egg production. This short generation permitted a recovery of hatchability and egg number due to elimination of dominant deleterious genes and major chromosome rearrangements. Similar samples of hens from X and P lines were taken off without semen irradiation in the second, third, and fifth generations of the radiation phase. These samples served for an evaluation of genetic damage accumulated in the ancestry of the radiated line.
The selection phase: The second part of the experiment was planned to apply equal selection i n all populations and has progressed six generations to date. Each of the three population lines (P, C, X) was divided into two sublines, one kept under floor management, the other in single wire cages, as shown i n Figure 2. This use of two environments was dictated by space limitation. But the two sublines of each population differed in still another way. In the lines kept under floor management a restriction on selection was imposed so as to prevent a reduction in average egg size, a trait known to be negatively correlated with egg number (BLYTH 1952; ABPLANALP
1957). In cage replicates selection was solely on the egg number index, using combined indi- vidual and family performance.
In addition to three pairs of selected lines (P, and P,; C, and C,; X, and X c ) , a pair of relaxed lines (R, and R,) was extracted from P as shown in Figure 2. While the lines selected upward were reproduced with fixed population structure of ten males each mated to five females, the randomly selected lines were propagated in mass matings of ten males with 50 females; conse- quently no pedigrees were available for them. The R lines were included in the experiment as indicators of major environmental changes between generations. Since no directed selection was to be practiced among R individuals, only enough birds were hatched to give 50 female and some 15 male survivors at reproduction time.
SELECTION O N INDUCED V A R I A TI O N 1087 (3) Samples of hens from each subline and cross were housed under both cage and floor manage- ment, in order to evaluate the restriction of egg size on the selection of floor replicates inde- pendently of environmental differences between cage and floor.
10
RESULTS
Short-term radiation eflects: Comparisons of fertility and hatchability of the
C and X lines during the radiation phase are shown in Table 1 and Figure 3 . The percent fertility of eggs fertilized by irradiated semen was lowest (about 30 percent) in the first two generations of irradiation and increased gradually to over 50 percent in the seventh generation. The causes of this improvement are not obvious but a similar increase of fertility in controls suggests that improved techniques, such as more rapid handling of semen samples may have been in- volved. Higher dose rates in the fifth and sixth generations gave somewhat lower fertility than adjoining generations, as expected. Hatchability of fertile eggs of the radiated line showed a fairly consistent decline from 53 percent in the first to 20 percent in the seventh generation of irradiation. The data suggest that by the seventh generation the elimination of accumulated harmful mutations was nearly in equilibrium with the induction, by 1000r, of new genetic radiation damage. Further information on this point was obtained in generations 3 (2000r ac- cumulated dose), 5 (5500r), and 7 (8000r), when samples of eggs from the X
-
cyu..m om",
10- .om .ooo
.-
uoo. m r,000. .O*1088 H. ABPLANALP et al.
line were inseminated with nonirradiated semen of that line. Hatchability of these eggs was improved by some 20 percent (Figure 3) and demonstrates the rapid elimination of dominant deleterious genes or chromosome rearrangements by natural selection. Within two generations after cessation of irradiation the hatchability of the X population had reached almost control levels.
Recovery of hatchability under natural selection following suspension of irradi- ation was paralleled by considerable recovery of egg production in the X line as shown in Figure 4 for samples of about 50 pullets raised in the second, third, and fifth generations of irradiation, respectively. However, some deleterious effects of radiation persisted and resulted in a reduction of egg production to about 80 percent of the normal egg number and in a retardation of sexual maturity as measured by age at first egg (Figure 5 ) . No radiation effects on average egg size were observed, however (Figure 5).
In the course of the irradiation work several additional fertility tests were per- formed and resulted in the de:ection of at least one translocation, which was later demonstrated cytologically (LERNER, DEMPSTER, and INOUYE 1958). Two additional translocations were diagnosed by initial breeding tests but could not be confirmed cytologically, nor could stocks be established to maintain them, leaving their existence in doubt.
Selection results: As mentioned earlier, the last irradiated generation in 1957 was followed in the X and C lines by a generation without pedigrees and a short egg-production period so that sufficient selection intensities could be used in subse- quent generations. Aside from hatchability data in Figure 3 no detailed results
200-
-
5 190-
g 160-
0 170- 160
-
I
Cumulative Dosage in Ancestry of
n
I
2000, 3000, 5 5 0 0 , 60
- I I
$ 5 0 - m
FIGURE 4.-Egg Production per pullet housed for samples of hens of the radiated line
( X ) produced by non irradiated semen from individuals of the second, third, and fifth generations.
E
FIGURE 5.-April egg weight and age at first egg f o r samples of hens of the radiated line ( X ) produced by non irradiated semen from parents of the second, third, and fifth generations. Circled numbers give the number
SELECTION O N INDUCED V A R I A TI O N 1089 are given here, since the production period fell into a different season than subse- quent generations, making comparisons difficult. Selection results from 1958 are shown in Figure 6 for egg production index to January 1, the primary selection criterion, and in Table 2 for other traits as well. It can be seen that selection response was obtained in cage replicates; but the situation is less clear for floor replicates where selection was restricted to prevent a reduction in egg size. Thus of the floor replicates only the P line appears to have made consistent gains. The randomly selected sublines (Rf and R,) seem to have lost some egg production in the course of the experiment. This decline cannot readily be ascribed to a
gradual deterioration in the environmental conditions judging from manage- mental observations on disease and other adverse incidents. The most likely explanation for the decline in egg number of R-lines is inbreeding depression, and confirmation of this assumption can be found in crosses of replicates as shown later.
Similarly adverse effects of inbreeding on egg production would have to be assumed for all selected lines, so that the potential response in egg number might have been somewhat greater than shown in Figure 6.
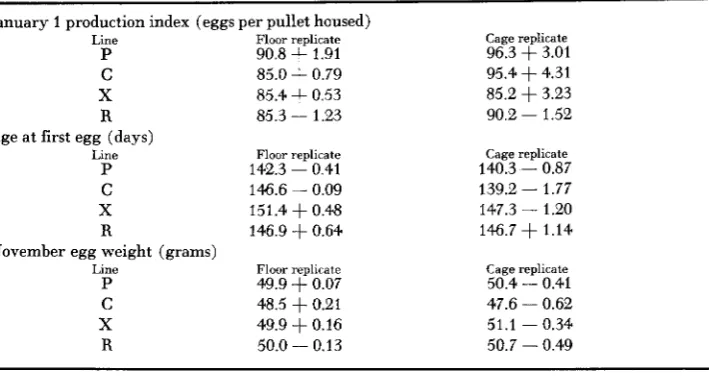
In order to obtain a single estimate of selection response f o r each subline, linear regressions of mean performance on year were calculated. These estimates are shown in Table 3 for January production index, age at first egg, and November egg weight. It can be seen that the response for egg number in the X line was slightly less than that of C in both replicates, but slightly greater than for P. There
are thus no indications that the sublines derived from irradiated ancestry re-
sponded better to selection than their controls.
FLOOR
r - l
I 1 I I I I 1
1958 1959 1960 1961 1962 1963 1958 1959 1960 1961 1962 1963
YEAR YEAR
1090 H. ABPLANALP et al.
TABLE 2
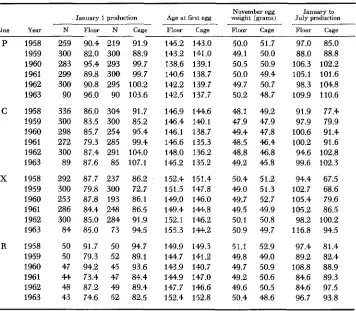
Average performance of populations during the selection phase of the experiment for egg production of pullets housed to January I , age at first egg, November egg
weight and egg production from January I to July 1
November egg January to
. January 1 production Age a t first egg weight (grams) July production
Line Year N Floor N Cage Floor Cage Floor Cage Floor Cage
1958 1959 1960 1961 1962 1963 1958 1959 1960 1961 1962 1963 1958 1959 1960 1961 1962 1963 1958 1959 1960 1961 1962 1963 259 300 283 299 300 90 336 300 298 272 300 89 292 300 253 286 300 84 50 50 47 44 48 43 90.4 82.0 95.4 89.8 90.8 96.0 86.0 83.5 85.7 79.3 87.4 87.6 87.7 79.8 87.8 84.4 85.0 85.0 91.7 79.3 94.2 73.4 87.2 74.6 219 300 293 300 295 90 304 300 254 285 291 85 237 300 193 243 284 73 50 52 45 47 49 52 91.9 88.9 99.7 99.7 100.2 103.6 91.7 85.2 95.4 99.4 104.0 107.1 86.2 72.7 86.1 86.5 91.9 94.5 94.7 89.1 93.6 84.4 89.4 82.5
145.2 143.0 143.2 141.0 138.6 139.1 140.6 138.7 142.2 139.7 142.5 137.7
146.9 144.6 146.4 140.1 146.1 138.7 146.6 135.3 148.0 136.2 145.2 135.2
152.4 151.4 151.5 147.8 149.0 146.0 149.4 144.8 152.1 146.2 155.3 144.2
149.9 149.3 144.7 141.2 143.9 140.7 144.9 147.0 147.7 146.6 152.4 152.8
50.0 51.7 49.1 50.0 50.5 50.9 50.0 49.4 49.7 50.7 50.2 48.7
48.1 49.2 47.9 47.9 49.4 47.8 48.5 46.4 48.8 46.8 49.2 45.8
50.4 51.2 49.0 51.3 49.7 52.7 49.5 49.9 50.1 50.8 50.9 49.7
51.1 52.9 49.8 49.0 49.7 50.9 49.2 50.6 49.6 50.5 50.4 48.6
97.0 85.0 88.0 88.8 106.3 102.2 105.1 101.6 98.3 104.8 109.9 110.6
91.9 77.4 97.9 79.9 100.6 91.4 100.2 91.6 94.6 102.8 99.6 102.3
94.4 67.5 102.7 68.6 105.4 79.6 105.2 86.5 98.2 100.2 116.8 94.5
97.4 81.4 89.2 82.4 108.8 88.9 84.6 89.3 84.6 97.5 96.7 93.8
Selection response in egg number of cage replicates can be seen to have been made by lowering the age at first egg and by a reduction in average egg size as expected from genetic correlations. The irradiated lines were at a disadvantage from the outset by having somewhat later age at first egg than controls, and they showed less response in that characteristic in the course of selection.
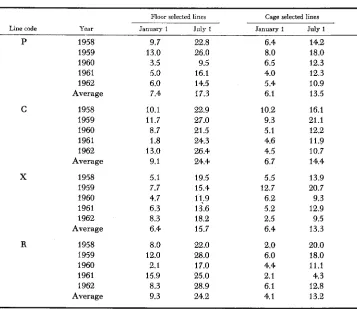
Somewhat surprising results were obtained for mortality of pullets to January 1 (about 42 weeks of age) and July 1 (about 65 weeks of age) respectively, as shown in Table 4. Of the four floor populations, Xf had lowest mortality over the
SELECTION O N INDUCED VARIATION 1091
TABLE 3
Estimates of initial performance and selection response per generation as determined from linear regression of performance averages on year for separate lines and sublines
January 1 production index (eggs per pullet housed)
Line Floor replicate Cage replicate
P 90.8
+
1.91 96.3 f 3.01C 85.0
+
0.79 95.4+
4.31X 85.4
+
0.53 85.2 f 3.23R 85.3 - 1.23 90.2 - 1.52
Age at first egg (days)
Line Floor replicate Cage replicate
P 142.3 - 0.41 140.3 - 0.87
C 146.6 - 0.09 139.2 - 1.77
X 151.4 f 0.48 147.3 - 1.20
R 146.9 f 0.64 146.7 f 1.14
Line Floor replicate Cage replicate
P 49.9
+
0.07 50.4 - 0.41C 48.5 f 0.21 47.6 - 0.62
X 49.9 f 0.16 51.1 - 0.34
R 50.0 - 0.13 50.7 - 0.49
November egg weight (grams)
dominant deleterious genes, than for C lines. No explanation can be offered for the high mortality in the floor replicates of the C and R lines.
While the selection results presented lend little support to the initial expecta- tion of inducing polygenic variability useful for selection of high egg number, it is possible that such potential response may have been partly concealed or re- tarded in the X lines. One possibility is that inbreeding effects in the X lines were more pronounced than in other lines because of higher frequency of deleterious recessive genes. Another factor may have been the slowing of selection response due to overdominance between induced mutations and alleles initially present in the irradiated populations.
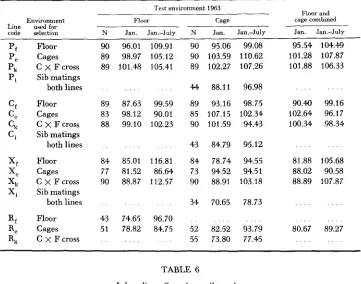
Inbreeding efeccts: The importance of inbreeding effects and of the effects of different environmental conditions used in selection were first studied in the 1963 generation, and the results obtained from this one generation must be considered preliminary. The results of crosses between corresponding sublines and sib matings within them are given in Table
5
for January 1 production and produc- tion between January 1 and July 1. Samples of pullets from each subline were housed under both cage and floor conditions but inbreds were housed in cages only, and no inbreds could be obtained in the unpedigreed R lines. Adverse in- breeding effects from sib mating as measured by the difference between combined subline averages and inbreds, respectively, can be seen for January 1 production in all lines. The loss in egg number from January 1 to July 1 was most pro- nounced for the irradiated replicates ( X ) ; but when total egg production is con- sidered the relative inbreeding effects from sib mating in the irradiated lines appear comparable to those of controls (Table 6).1092 H. ABPLANALP et al.
TABLE 4
Percent mortality from hatch to about 40 weeks of age (January f) and
to about 65 weeks of age (July f)
C
X
R
~ Floor selected lines Cage selected lines
Line code Year January 1 July 1 January 1 July 1
P 1958 9.7 22.8 6.4 14.2
1959 13.0 26.0 8.0 18.0
1960 3.5 9.5 6.5 12.3
1961 5.0 16.1 4.0 12.3
1962 6.0 14.5 5.4 10.9
Average 7.4 17.3 6.1 13.5
1958 10.1 22.9 10.2 16.1
1959 11.7 27.0 9.3 21.1
1960 8.7 21.5 5.1 12.2
1961 1.8 24.3 4.6 11.9
1962 13.0 26.4 4.5 10.7
Average 9.1 24.4 6.7 14.4
1958 5.1 19.5 5.5 13.9
1959 7.7 15.4 12.7 20.7
1961 6.3 13.6 5.2 12.9
1962 8.3 18.2 2.5 9.5
Average 6.4 15.7 6.4 13.3
1958 8.0 22.0 2.0 20.0
1959 12.0 28.0 6.0 18.0
1960 2.1 17.0 4.4 11.1
1961 15.9 25.0 2.1 4.3
1962 8.3 28.9 6.1 12.8
Average 9.3 24.2 4.1 13.2
1960 4.7 11;9 6.2 9.3
and their cross on the other, may be taken as a measure of inbreeding effects accumulated during the selection phase because of limited population size. In- breeding coefficients calculated for the P, C , and X lines are given in Table 7, including crosses and sib matings. A difference of 6 to 8 percent of inbreeding existed between sublines and their respective crosses. For January production inbreeding in sublines resulted in a loss of about four eggs over six generations and there is no indication of greater inbreeding depression of the X lines than in controls (Table 8).
Taken together with the results from sib mating, this finding might suggest that some of the selection pressure in the X lines was used to counteract its larger deleterious effects of inbreeding during the selection phase with a consequent reduction in the observed selection response as well as inbreeding effects observed in the 1963 generation.
SELECTION ON INDUCED VARIATION 1093
TABLE 5
1963 comparisons of replicate lines selected under floor and cage environments respectively, their crosses and sibmatings from them under both environments. Production index
to January 1 and from January I to March 1
Test environment 1963 Floor and
Environment Floor Cage cage combined
Line used for
code selection N Jan. Jan.-July N Jan. J a m J u l y Jan. Jan.-July
Floor Cages C x F cross Sib matings both lines Floor Cages C X F cross Sib matings both lines Floor Cages C x F cross Sib matings both lines Floor Cages C
x
F cross90 96.01 109.91 89 98.97 105.12 89 101.48 105.41
89 87.63 99.59 83 98.12 90.01 88 99.10 102.23
84 85.01 116.81 77 81.52 86.64 90 88.87 112.57
43 74.65 96.70 51 78.82 84.75
90 95.06 99.08 90 103.59 110.62 89 102.27 107.26
4 4 88.11 96.98 89 93.16 98.75 85 107.15 102.34 90 101.59 94.43
43 84.79 95.12 84 78.74 94.55 73 94.52 94.51
90 88.91 103.18
34 70.65 78.73
. . .
52 82.52 93.79 55 73.80 77.45
95.54 104.49 101.28 107.87 101.88 106.33
. . .
90.40 99.16 102.64 96.17 100.34 98.34
. . .
81.88 105.68 88.02 90.58 88.89 107.87
. . . . . .
80.67 89.27
. . .
TABLE 6
Inbreeding effects from sib mating
Lines Production Production, Production (in cages) to January 1 January 1-July 1 to July 1
P, and P, 11.21 7.88 19.09
C, and C, 15.37 5.42 20.79
x
f 8.09 15.82 23.91TABLE 7
Average and range of inbreeding coefficients f o r the 1963 generation of selected lines, the crosses of sublines and sib matings within lines
~~ Liue
P C X
1933 basis 1958 basis 1958 basis
Floor sublines 34.2 (33-49) 11.2 ( 6-30) 11.2 ( 9-31)
Cage sublines 32.3 (30-39) 7.4 ( 6-28) 9.5 ( 7-13)
1094 H. ABPLANALP et al.
TABLE 8
Inbreeding effects accumulated during seLction phase
Production Production, Production Lines to January 1 January 1-July 1 to July 1
P -3.47 -0.15 -3.63
C -3.82 -0.68 -4.50
X -3.94 -9.74 -13.68
of first crosses to the contributing sublines. The outstanding result in both years is that hatchability of inbreds of the irradiated line fell far below the level of inbreds from the other sublines, to about 65 percent (Tables 9 and I O ) . This observation suggests that the irradiated sublines, after six generations of artificial selection for egg number and of natural selection for hatchability, still carry concealed deleterious variation. Hatchability of sublines and crosses vanes con- siderably between years and lines, and it is clear from these data that more definitive results are required to arrive at satisfactory quantitative estimates of concealed genetic radiation damage still remaining in the X lines.
TABLE 9
Percent hatchability ( H ) of fertile eggs ( N ) 1963
Line
P C X R
Sublines N %H N %H N %H N %H
Floor 622 84.2 580 81.9 724 74.8 500 78.0
Cage 549 83.6 568 81.0 535 72.2 729 86.6
F x C cross 587 89.8 581 79.9 580 79.8 298 74.0
Sibmatings 208 76.3 268 73.8 148 62.8 . . .
These data include all four hatches for all groups.
TABLE 10
Percent hatchability ( H ) of fertile eggs ( N ) 1964. Hatches I through IV
Line
P C X R
-__.
Sublines N %H N %H N %H N ?AH
Floor 254 85.0 249 78.3 268 93.7 133 85.7
Cage 267 90.6 227 81.9 277 73.6 169 84.6
C x Fcross 260 84.2 235 87.7 232 84.9 308 81.5
Backcross 267 88.4 231 78.8 210 88,t 250 88.8
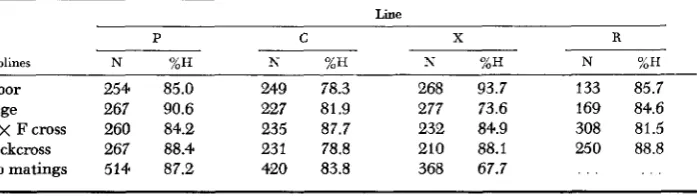
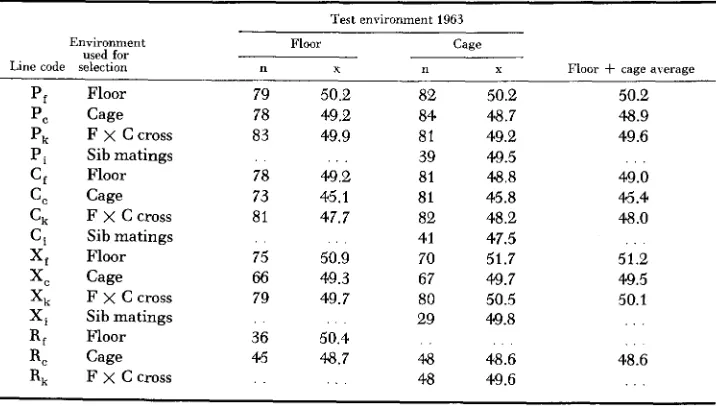
SELECTION O N I N D U C E D V A R I A T I O N 1095 In Table 11 the 1963 results on November egg weight are summarized.
NO
inbreeding effects are apparent and all indications are that egg size is inherited in an additive manner and is not adversely affected by irradiation.
Comparisons of sublines of all lines in 1963 under both environments permit a somewhat more precise evaluation of the effects of restricting egg size in floor replicates. Combining information from cage and floor samples belonging to each subline the following differences between cage and floor replicates were obtained:
Comparison
Production November egg
to January 1 weight (grams)
pc-p, 5.74
cc-c,
12.24xc-x,
6.14-1.2 -3.6 -1.8
It is apparent that selection response for egg number was inversely related to changes in egg size.
Genetic variances: One of the effects of radiation on populations should be an increase in genetic variance of affected traits. Experiments with plants and the Drosophila studies on bristles by SCOSSIROLI (1954, 1958) and by CLAYTON and ROBERTSON (1955) all show this phenomenon. I n the present experiment the first four generations of the selection phase were analyzed. Estimates of variance components were made for sire effects (expected to represent one-quarter of the genetic variance), for dam effects (representing one-quarter of the additive and
TABLE 11
1963 comparisom of average November egg weight, replicate lines. their crosses and
sib matings under cage and floor enuironments ~
Test environment 1963
Environment Floor Cage
used for
Line code selection n T n X Floor
+
cage averageP, Floor 79 50.2 82 50.2 50.2
P, F
x
Ccross 83 49.9 81 49.2 49.6C, Floor 78 49.2 81 48.8 49.0
C, F
x
C cross 81 47.7 82 48.2 48.0X, Floor 75 50.9 70 51.7 51.2
Xk F x C cross 79 49.7 80 50.5 50.1
P, Cage 78 49.2 84 48.7 48.9
Pi Sib matings . . . . . 39 49.5 . . .
C, Cage 73 45.1 81 45.8 46.4
Ci Sib matings . . . . 41 47.5 . .
X, Cage 66 49.3 67 49.7 49.5
Xi Sib matings . . . . . 29 49.8 . . .
R, Floor 36 50.4 . .
R, F ~ C c r o s s . . . . . 48 49.6 . . .
. . . . .
1096 H. ABPLANALP et
al.
one-quarter of the dominance variance plus maternal effects) and for individual differences. These results are shown in Table 12. Radiation-induced additive vari- ability should be reflected in enlarged sire components of the X lines. But it ap- pears that the sire components of January 1 production were smaller for the radiated lines than found in control lines (P and C )
.
Dam components on the other hand were larger for the two radiated sublines suggesting that nonadditive genetic variability may have been increased by radiation. These conclusions are in general agreement with inbreeding and selection results. For egg size the sire and dam components of variance were closely comparable to those of controls, with only a slight indication of increased genetic variability.DISCUSSION
The main conclusion that can be drawn from our results at this stage is that irradiated populations have shown no more and possibly less response to selection for egg number, the primary criterion of selection, than control populations. Thus the initial hope that X-ray treatment could induce genetic variation useful for achieving gains in egg number in sufficient amounts to be demonstrated by selection has not been fulfilled up to now. This does not mean, however, that none has been produced. Brother-sister matings and crosses of replicate lines have indicated greater inbreeding depression in hatchability for the irradiated than for the control lines. The results for full-sib matings obtained so far also suggest that concealed deleterious genetic variation induced by radiation is still present in the populations so treated. Finally, analyses of variance indicate an increase in the
amount of dominance variance in the irradiated lines.
A number of explanations may be offered for the relatively slow response to selection for egg number in irradiated lines. Since these lines had somewhat lower hatchability than control lines (Figure 3) one might surmise a reduction in their selection intensity and selection differentials. In fact, however, selection differentials for the selection index used were closely comparable in magnitude for corresponding replicates.
A second rationale for the behavior of irradiated lines may be based on the hypothesis that the bulk of induced mutations was deleterious. While dominant deleterious genes were to a great extent discarded in the course of the irradiation phase and the first generation of selection (see Figure 3 for hatchability results), it must be assumed that recessive deleterious genes would remain in the popula- tions for a long time. This mutational load may have had a relatively small effect
TABLE 12 Variance components for sires (cos), dams
(&d)
and individuals (ge), and heritability estimates based on sire components for production to January I and November egg weight Statistic Year Production to January 1 November egg weight -- u2s1958 1959 1960 1961
Average
u2d
1958 1959 1960 1961
Average
U2e
1958 1959 1960 1961
Average
1958
u2s+u~~+u*e
1959 1960 1961
Average
4
UZs
~~
15.5 23.2 7.1 9.7 13.9 23.9 37.7 30.6 37.5 32.4
285.5 221.7 213.4 229.6 237.5 0.19 0.33 0.1
1
0.14 0.19 20.2 6.5 5.2 16.7 12.2 19.7 53.7 31.3 52.2 39.2 231.5 187.4 212.5 243.5 218.7 0.30 0.10 0.08 0.21 0.18
42.8'
-6.3 16.4 38.2 22.8 -8.4 31.6 15.9 31.3 17.6 303.6 170.2 194.1 206.6 218.6 0.5
1
-0.13
0.29 0.55 0.35 13.6 16.8 38.1 7.9 19.1 62.6 54.3 2.4 31.8 37.8 174.3
240.4 242.6 225.3 220.6 0.22 0.22 0.54 0.12 0.28 -8.3 20.4
2.0 0.6 3.7 61.4 11.4 55.3 39.2
41.8
244.8 213.3 191.3 296.2 236.4 -0.1
1
0.33 0.03 0.01 0.07
28.9
-11.5 -3.5
11.2 6.3 13.8 72.4 51.8 64.0 50.5
249.3 227.3 280.1 282.7 259.8 0.33 -0.16 -0.04
0.13 0.08
pr pc 0.32 1.36 0.77 1.39 -0.41 4.08 0.37 2.06 0.26 2.22 0.74 0.30 2.10 0.60 1.44 1.55 0.40 0.84 1.17 0.82 8.33 6.89 6.59 8.01 7.04 7.79 6.63 6.17 7.15 7.22 0.14 0.64 0.33 0.56 0.20 1.22 0.20 0.91 0.12 0.87
=* 1.53 0.70 0.34 1.94 1.13 1.65 0.76 0.32 0.43 0.79 4.68 5.42 5.72 4.24 5.02 0.78 0.41 0.21 1.17 0.65
~.
cc 0.72 0.43 1.30 0.54 1.71 0.94 1.95 0.48 1.27 5.41 5.32 5.80 5.06 5.40
-0.16
0.41 0.21 0.76 0.30
1098 H. ABPLANALP et al.
that crosses of irradiated replicates exceeded the corresponding replicates no more than did the crosses of control replicates.
Still another possibility is that deleterious induced mutations persisting after the irradiation phase were heterotic with existing alleles, thus constituting what MORTON, CROW and MULLER (1956) have termed segregational load. But we have no evidence to suggest that radiation-induced segregational load has retarded selection response. Even for Drosophila populations there is still considerable controversy as to the nature of radiation-induced variability. Some experiments with Drosophila show evidence for the existence of overdominance between in- duced mutations and genes already present ( WALLACE 1958). But others (e.g. FALK 1961 ) have questioned interpretation and have given evidence presumably supporting the prevalence of deleterious recessives. The controversy on this issue at this time has not been resolved (WALLACE 1963).
There is yet another way in which induced deleterious mutations could be retained in irradiated populations. I n the present experiment mutations were introduced via male gametes over seven generations. Under these circumstances it would be possible for mutations to be induced in successive generations and in close proximity to already existing deleterious genes so that some might constitute linked pairs in replusion phase. Deleterious recessive mutations so situated would then constitute a temporary system of balance deleterious genes. Pseudo-over- dominance of this type has been shown by COMSTOCK (1961) to arise in non- irradiated Drosophila populations when linkage disequilibrium is created through inbreeding. It remains to be shown theoretically whether or not the number and kind of mutations induced by radiation with 8000r was sufficient, in our case, to create a substantial genetic load of this pseudo-segregational type.
Thus, the problem of induced genetic loads seems to us of sufficient importance for an interpretation of our results to warrant further theoretical and experi- mental investigation.
From our results to date one may suggest that egg number in chickens, being a component of reproductive fitness, reacts to radiation in much the same way as do viabilty
(WALLACE
1956) and other fitness components (CARSON, 1964) ob- served in Drosophila experiments. There is general agreement in those cases that the induced variation persisting after radiation has ceased is primarily deleter- ious.In contrast to the results obtained from observations on fitness components, there is good evidence that radiation-induced variation can successfully be ex- ploited by subsequent selection when the traits involved are not directly connected with fitness. Thus, selection experiments with bristles in Drosophila have shown varying degrees of response attributable to X-ray-induced variation ( SCOSSIROLI 1954, 1958; CLAYTON and ROBERTSON 1955). In plants radiation-induced varia- tion followed by selection has been demonstrated to increase yield in soya beans (RAWLINGS et al. 1958) and peanuts (GREGORY 1955), plant height in rice (OKA
et al., 1958) and has been used to advance or delay flowering time in subterranean
SELECTION O N I N D U C E D VARIATION 1099 pointed out, however, by BROCK and LATTER, that the induced variation tends to be symmetrical about the mean only in characters not previously subject to long- term selection, whereas traits such as yield tend to regress under irradiation, with induced variability predominantly in the direction of the original state of the population. According to such reasoning it should be possible, in our case, to detect and exploit variability in traits other than those previously under direct artificial selection. However, analyses of variance for egg production and egg weight show no conclusive evidence of increased genetic variability in irradiated lines (Table 12) for either.
I n retrospect, it appears that 8000r of radiation may not be sufficient to clearly establish the magnitude of induced polygenic variation which can be utilized by selection. This objective might be easier to achieve with a character such as egg size than with egg number, where nonadditive induced Variability apparently comes into play and obscures effects of possibly induced additive variability. W e must conclude from our results that induction of polygenic variability and its subsequent use by selection in higher animals will be a slow and tedious process, requiring probably several tens of thousands of roentgen units of irradiation to produce economically important gains. In addition there will arise serious prob- lems of eliminating induced deleterious variability.
This work was made possible by grants from The National Science Foundation (NSF-G20
and NSF-G18789). Paper given at a symposium on “The effects of radiation on the hereditary fitness of mammalian populations” at The Jackson Laboratory, Bar Harbor, Maine, June 29- July 1, 1964, supported in part by Contract AT(49-9)-2457 with the United States Atomic Energy Commission.
S U M M A R Y
1100 H. ABPLANALP et al.
unnoticed in the noninbred selected populations but are exposed when made homozygous by inbreeding.
LITERATURE CITED
ABPLANALP, H., 1957 Genetic and environmental correlation among production traits of poultry. Poultry Sci. 36 : 226-228.
The correlation between egg number and egg weight in the fowl: An investigation of its inconsistency. Poultry Sci. 31 : 254-268.
Radiation-induced quantitative variation in subter- ranean clover. pp. 205-215. Proc. 3rd Australasian Conf. on Radiobiology (Sidney). Edited P. L. T. ILBERY.
Population size and genetic load in irradiated populations of Drosophila melanogaster. Genetics 49 : 521-528.
Mutation and quantitative variation. Am. Naturalist 89: 151-158.
Linkage in relation to evidence concerning level of dominance. Proc. BLYTH, J. S. S., 1952
BROCK, R. D., and B. D. H. LATTER, 1961
CARSON, H. L., and N. H. GILES, 1964
CLAYTON, G., and A. ROBERTSON, 1955
COMSTOCK, R. E., 1961
10th Natl. Breeders’ Roundtable, Chicago. pp. 94-1 12. FALK, R., 1961
GREGORY, W. C., 1955 LERNER, I. M., 1958
LERNER, I. M., and E. R. DEMPSTER, 1951
Are induced mutations in Drosophila overdominant? Genetics 46: 727-757. X-ray breeding df peanuts (Arachis hypogaea, L.) Agron. J. 47: 396-399. The Genetic Basis of Selection. Wiley, New York.
Attenuation of genetic progress under continued selection i n poultry. Heredity 5: 75-94. - 1956 An empirical test of part-record selection for egg production. Poultry Sci. 35: 1349-1355.
Preliminary reports on X-ray induction of variability in polygenic traits of chickens. (Abstr.) Proc. 10th Intern. Cong. Genet. 2: 164. An estimate of the mutational damage in man from data on consanguineous marriages. Proc. Natl. Acad. Sci. U.S. 42: 855-863.
Induced mutations of polygenes for quanti- tative characters in rice. J. Hered. 49 : 11-14.
Variation in quantitative characters of soybean after seed irradiation. Agron. J. 50: 524-528.
Experimental analysis of the problems of selection by X-ray irradiation. Uspehi ZootehniEeskih Nauk 2: 161-202.
Effectiveness of artificial selection under irradiation of plateaued popu- lations of Drosophila melanogaster. Symp. Genetics of Population Structure, Pavia. Edited by A. A. BUZZATI-TRAVERSO. pp. 42-66.
On the relative role of mutation and recombination in responses to selection for polygenic traits in irradiated populations of Drosophila melano- gaster. Intern. J. Radiation Biol. 1 : 61-69.
Acceleration of the rate of selection of quantitative characters in D . melanogaster by the action of X-rays. ZoologiEeskii Zurnal 14: 465480.
Studies on irradiated populations of Drosophila melanogaster. J. Genet. 54: 280-293.
-
1958 The average effect of radiation-induced mutations on viability in Drosophila melanogaster. Evolution 12: 532-556.-
1963 Further data on the over- dominance of induced mutations. Genetics 48 : 633-652.LERNER, I. M., E. R. DEMPSTER, and N. INOUYE, 1958
MORTON, N. E., J. F. CROW, and H. J. MULLER, 1956 OKA, HIKO-ICHI, J. HAYASHI, and I. SHIOJIRI, 1958 RAWLINGS, J. O., D. G. HANWAY, and C. 0. GARDNER, 1958
ROKIZKY, P., 1936
SCOSSIROLI, R. E., 1954
SCOSSIROLI, R. E., and S. SCOSSIROLI, 1959
SEREBROVSKY, R. E., 1935