ADAPTATION AT SPECIFIC LOCI. 111. FIELD BEHAVIOR AND
SURVIVORSHIP DIFFERENCES AMONG COLIAS PGI
GENOTYPES ARE PREDICTABLE FROM
IN VITRO
BIOCHEMISTRY
WARD B. WATT,' RICHARD C. CASSIN AND MARY S. SWAN Department of Biological Sciences, Stanford University, Stanford, California 94305
ond The Rocky Mountain Biological Laboratory, Crested Butte, Colorado 81224
Manuscript received October 24, 1982 Revised copy accepted December 20, 1982
ABSTRACT
Previous work on the phosphoglucose isomerase (PGI) polymorphism of Colias butterflies led to predictions concerning aspects of differential survivor- ship and fecundity among the polymorphic genotypes in the wild. Explicit assumptions underlying these predictions were that functional differences among genotypes at the in vitro biochemical level reflected roughly correspond- ing differences in vivo, and that the interaction of such differences with the thermal dependence of flight capacity was correctly understood. All those predictions tested were confirmed. We now report experimental designs for testing three more of these predictions. They concern both differential survi- vorship and the flight activity component of differential fecundity. We find, as predicted: (1) certain heterozygotes, kinetically most effective at low tempera- ture, begin flight earlier in the day than do other genotypes (six replicates); (2) among the three most common genotypes, the order of kinetic effectiveness, i.e., 3/4 > 3/3 >> 4/4, is reflected in asymmetric order of heterotic advantage, 3/4 > 3/3 >> 4/4, in time of flight initiation, breadth of flight time and/or overall flight density through the day (six replicates): (3) under high temperature stress, the usual survivorship advantage of kinetically favored genotypes is reversed, and the three most thermally stable genotypes show better survivor- ship.--These results strengthen further the case for direct natural selection on this locus. Implications for population sampling practices, for studies of the adaptive organization of metabolism, and for studies of the interaction of genetic variation with patterns of environmental variability are discussed.
HE preceding paper in this series (WATT 1983) made predictions about
T
patterns of variation in survivorship and fecundity components of fitness in the wild among genotypes of the phosphoglucose isomerase (PGI) locus of Colias butterflies. Several of these predictions were in agreement with data already on hand. Here we report the test of several others.The resolution of several important, interrelated issues rests on these predic- tions.
' Please send reprint requests to: DR. WARD B. WATT, Department of Biological Sciences, Stanford University. Stanford, California 94305.
726 W . B . WATT, R. C. CASSIN A N D M. S. S W A N
First, there are consistent patterns of allele and genotype frequency variation seen at this locus in the wild (WATT 1977, 1983). Are they caused by selection directly on this locus, or by selection on closely linked loci of unknown identity-“hitchhiking”? A third, purely demographic explanation of these patterns has been ruled out (WATT 1983), although demographic factors do interact with whatever form(s) of selection pressure are active here. Congruence of functional properties so far studied, and predictions already made, with variation seen in the field has argued strongly for direct locus-specific selection rather than hitchhiking (WATT 1977, 1983), but more testing is desirable. If a direct-selection explanation is sustained, it establishes the action of intense selection on this case of allozyme variation, as functional differences and the patterns seen in the field both imply large selection coefficients. If not, w e have to explain how such major functional differences at a known, physiologically important locus can be without realized effects on organism fitness.
A different, albeit related, issue is the interaction of these variants with the organization of metabolism, especially with respect to the impact of thermal- ecological constraints on the operation of metabolism. One of the original objectives of this work was to probe the adaptive organization of glycolysis, as a “model” for metabolism in general, using natural genetic variants as tools. If w e understand the operation of these PGI variants well enough to make successful predictions about new field data, w e are on the way to the realization of this purpose.
Further, the opportunity to study the mechanistic interaction of variants at a n y locus with known selective pressures and with well understood demo- graphic processes (given our knowledge of Colias’ thermal ecology and popu- lation structure) may yield powerful insight into microevolutionary processes. The present theory of formal properties-level population genetics is necessary for understanding evolution, but it is not sufficient. Some aspects of adaptation and of natural selection may only be understood by generalizing from mecha- nistic studies of those processes. Success of mechanistic analysis in this case would be a major step toward more general understanding along these lines. Other such steps are being taken in other systems, e.g., mouse hemoglobins (SNYDER 1978a,b, 1981), fish LDH (PLACE and POWERS 1979; DIMICHELE and POWERS 1982a,b), coelenterate PGI (SHICK, HOFFMAN and LAMB 1979; HOFFMANN 1981a,b), copepod amino acid-metabolizing enzymes (BURTON 1981; BURTON and FELDMAN 1981), etc.
We assume in our predictions, and observational/experimental tests of them, that the biochemical data reflect the nature, direction and order of functional differences among the genotypes in vivo and in the wild. Testing of fully quantitative correspondence between biochemical-level predictions and field data awaits comparisons of these PGI genotypes in vivo in various biochemical and physiological properties, which is just now beginning.
The present work concerns the four frequent-to-common Colias PGI alleles
conditions, the latter being a component of differential fecundity a s well as of differential survivorship.
MATERIALS AND METHODS
Populations of two “semi-species” isolates in Colias’ lowland species complex have been studied here: C. p. eriphyle Edwards at Gunnison, Colorado, elevation 2350 m (7700 ft), and C. eurytheme Boisduval at Tracy, California, elevation about 30 m (100 ft). In both cases the neighborhoods actually sampled are embedded within area-continuous populations (sensu WRIGHT 1946, 1951; cf. WATT, HAN and TABASHNIK 1979) of high density, occupying large surrounding regions of similar habitat. Environmental conditions at any one time are very similar among different portions of each habitat. Both sampling sites span, in linear dimensions or area, a small fraction of the average daily dispersal movement of individuals of this species complex, whether measured in native or agricultural-pest ecology (WATT et 01. 1979; TABASHNIK 1980). These populations are especially dense under the late-season conditions of the present sampling. Sampling these populations approximates sampling with replacement, given the local density and the effective surrounding area of habitat with which the sampling sites themselves exchange freely mixing individuals. As seen below, this is very important to our experimental design.
Field sampling, gel electrophoresis, and basic statistics were all done a s before (WATT 1977,1983; GOLDSTEIN 1964; ROHLF and SOKAL 1969; SOKAL and ROHLF 1969). Ambient air temperatures at 20-25 cm above ground were monitored with standard shielded thermocouples and a n Omega portable thermocouple monitor, and wind speeds were monitored with a Thermonetics hotwire anemometer. Orientations of Colias to incoming solar radiation were estimated by eye in 15’ increments around yaw and roll axes as before (WATT 1968). Multiway contingency table (G test) analysis of subsample comparisons within days was done in the manner of SOKAL and ROHLF (1969).
EXPERIMENTAL DESIGN
Several of the present questions revolve around differences in flight capacity, as assessed at the behavioral level, among different Colias PGI genotypes. The ideal situation would be to establish populations with known numbers of each genotype present at the outset, and then sample at various times in the day and thus in the diurnal thermal cycle. This cannot now be done. However, we can use the thermal ecology of these animals (see summary in WATT 1983; also WATT 1968; KINGSOLVER 1983a,b; KINGSOLVER and WATT 1983) to ascertain at what times of day peak flight density of each population occurs, and compare genotypic composition of “subsamples” taken at this time against those taken at other times on the same days.
Maximal flight occurs under solar radiation load, air temperature, and wind speed conditions such that the members of the population experience body temperatures optimal for flight (35-39’). This usually produces a single flight density peak in late morning to early afternoon, with colder conditions before that peak, and either overheating (warmer habitats) or cooler conditions again following it. In the warmest habitats, a bimodal flight pattern may be seen when severe overheating occurs at midday (LEIGH and SMITH 1959); we have not yet studied such habitats.
For this design to be valid, we must be sampling populations so large, compared to subsample size, that sampling at one time has no significant effect on the composition of later samples. In all cases, population sizes satisfied this requirement.
This design is conservative; it is somewhat biased against finding genotypic differences in activity, as each genotype is referenced to its own peak flight density. Genotype-specific differences in activity level that would be manifest even at peak flight density thus cannot be detected. For this reason, and because in many cases we are concerned with comparison of genotypes outside the environmental thermal optimum, peak density subsamples themselves should properly be omitted from statistical comparisons of genotype activity levels.
728 W. B. WATT. R. C. CASSIN AND M. S . SWAN
value was 81% of peak flight density. We have assumed this to be random fluctuation, and have not tried to correct for it. Subsamples were taken within given time periods, rather than with a predetermined maximum sample number, so as to maximize the numerical independence of genotype counts within the subsamples. The subsample size range used means that detailed comparisons of minor genotype flight densities by themselves are not possible, but overall compar- isons of homozygosity vs. heterozygosity, and individual study of the most common genotypes, are feasible.
Weather conditions sometimes interrupted population flight, preventing taking of some subsam- ples. Late subsamples could also interact with the activity rhythm of Colias adults, which makes them more likely to roost as the afternoon wears on, or if interrupted in activity late in the day, less likely to resume activity than they would have been to continue activity without interruptions (E. M. GONTERO and W. B-WATT, unpublished results). Two subsamples of the 21 among our 6 sampling days were or may have been subject to these effects.
The last sample of November 2, 1980, was begun only a very few minutes before the animals began to roost, even though at least a n hour of thermal conditions seemingly usable for flight was left. We suspect that interaction of shorter photoperiod with the animals’ activity rhythm caused this. Orientation sampling of animals at rest was impossible, as immediately upon lighting they would crawl down plant stems and be lost to view. Sampling was carried through as best it could be done, but this subsample is manifestly not comparable to any of the others in terms of animals’ motivation to fly. The last sample of August 25, 1981, was taken in renewed sunshine after a hard thunderstorm of an hour’s duration; this may, as a result, not represent the animal flight densities that would have been seen at that time without the long interruption in flight, but its lack of comparability to other subsamples is less certain than in the November 2, 1980, case.
We documented the thermal biology of the animals during sampling days in two ways: first, by recording environmental thermal variables such as air temperature, etc. directly in the sampling site; second, by observing and recording the orientation to sunlight of unrestrained animals in the field. When their body temperatures, Tb, are below the optimum for activity, the insects orient perpendicular to sunlight for warming. When in the optimum, they orient at random, when experiencing overheating, they orient parallel to sunlight if they cannot or will not move into shade (WATT 1968). Thus, sampled orientations can directly index the present thermal experience of the insects in the habitat during genetic sampling. The greater the average orientation angle of resting Colias to sunlight, the more they are experiencing cold, solar warmup conditions. Conversely, a predominance of parallel orientation indicates overheating.
We could repeat this design at different times in the flight of one brood in a population, in different broods, and in different years, to compare combinations of demography and climatically determined fluctuation in thermal selection pressures. The procedure could also be applied to different populations, perhaps even in different isolates of a species complex, to see whether the predictions, if verified in one situation on one type of genetic background, could also be verified in similar environments on different genetic backgrounds. Here, we studied a population of C. p. eriphyle in Colorado, at two different times in the flight period of the second brood, in each of two successive summers with different associated climatic temperature patterns. We also twice studied its close relative C. eurytheme in the Central Valley of California.
In testing specific predictions using these populations, we have routinely used one-tailed tests wherever the issue of “tailed-ness” arose. In each such case, the null hypothesis entails a n y failure to observe the predicted result. It is immaterial whether this comes in the form of a simple absence of any trend, or in a ”significant” trend in the opposite direction to that predicted. Thus it is not only proper, but necessary, to concentrate the whole power of the test on that tail of the possible distribution of results that can test presence or absence of the specifically predicted result. To do otherwise would seriously bias the evaluation toward committing the type I1 error, false acceptance of the null hypothesis (cf. SOKAL and ROHLF 1969).
RESULTS
heterozygote 3/4, than subsamples on the same days a t peak flight density under warmer temperatures. This follows from findings that at low temperature, all heterozygotes except 4/5 are heterotic for glycolytic
K,
at low temperature,3/4 (the most common heterozygote) and 3/5 are heterotic for V,,/K, at low temperature, and 3/4 shows these effects particularly strongly. As a result, these heterozygotes, especially 3/4, should be able to support, via greater glycolytic flux capacity, faster crawling from the roost up into sunlight as compared to other genotypes, and should (again via greater glycolytic flux capacity) be able to initiate flight, or sustain it, to a somewhat greater degree at suboptimal body temperatures. The fitness consequences of such advantages have been discussed earlier (WATT 1983).
This prediction was examined on six occasions, four in 1980 and 1981 in the Gunnison, Colorado, population of C. p. eriphyle, and two in 1980 in the Tracy, California, population of C. eurytheme. Table 1 shows that in all six cases, the earliest subsample had greater, frequently much greater, heterozygosity than the peak density subsample on that day. This is true over all heterozygous genotypes, and as well for the most common heterozygote 3/4. In both cases the Wilcoxon test is highly significant. The prediction is supported.
Prediction: among the three most common genotypes, 3/4 will fly under colder conditions and/or fly over a greater span of time through the day than will 3/3
or 4/4, but 3/3 will be more similar to 3/4 than to 4/4 in these respects. This follows from the kinetic heterosis of 3/4 at all temperatures as compared to 3/ 3 and 4/4, and from the fact that 3/3 is closer in kinetic properties, overall, to 3/ 4 than to 4/4. The translation of these functional differences into greater activity under cool conditions, or under conditions requiring sustained endurance, is similar to that argued for the previous prediction, and is discussed earlier (WATT
1983).
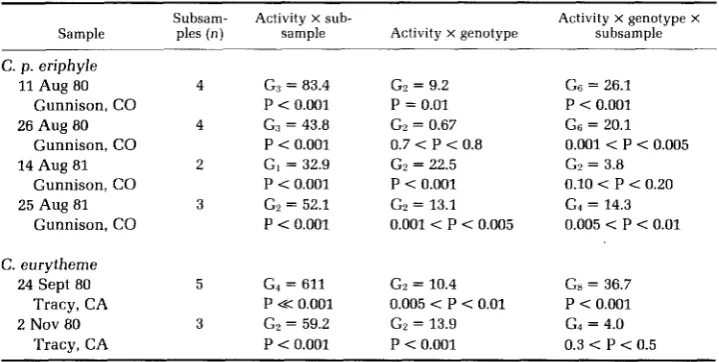
Figure 1 illustrates one of our six test series, using C. eurytheme at Tracy, Calfornia, and subsampling five times through a September day. It displays variation in flight density for each genotype through the day and in relation to ambient air temperatures. It also includes distributions of the insects' orientation to sunlight at each sampling time, which index their own experience of thermal conditions as noted above: perpendicular orientation to the solar beam around yaw and roll axes (total 180') when warming up, random orientation at optimal body temperatures, and parallel orientation to the solar beam (limiting orienta- tion 0') as overheating becomes more prevalent. Summarized data for this and the other five trials are presented in Table 2; statistical evaluations of all the data are presented in Tables 3 and 4. These data show genotypic differences in activity in the directions predicted. Each of the 6 days shows significant G test heterogeneity either as activity x genotype interaction (overall differences in activity level) or as the three-way interaction (e.g., 3/4 flies disproportionately better in colder conditions than does 4/4, etc.), or both. Uniform significance of the activity x subsample interaction expresses the expected dependence of overall flight activity on the insects' thermal biology. Detailed statistical discrim- ination of the genotypic comparisons is a more complex task.
730 W. B. WATT, R. C. CASSIN AND M . S. SWAN
TABLE 1
Early morning vs. peak flight density subsomples observed heterozygosity vs. Hardy-Weinberg expectotions
Sample
Total heterozygosity 3/4 heterozygosity
Rank Rank
Early Peak dif dif Early Peak dif dif
C. p. eriphyle 11 Aug 80
Gunnison, CO n, = 52, n2 = 62
Gunnison, CO n, = 63, n2 = 58
Gunnison, CO
nl = 55, na = 59
Gunnison, CO n, = 52, ne = 65 26 Aug 80
14 Aug 81
25 Aug 81
C. eurytheme 24 Sept 80
Tracy, C A
n l = 63, n2 = 193
Tracy, CA 2 Nov 80
ni = 57, nz = 68
+0.099 -0.013 +0.112
-0.015 -0.138 +0.123
+0.065 -0.054 +0.119
+0.061 +0.014 +0.047
+0.016 -0.041 +0.057
+0.034 -0.016 +0.050 +4
+6
+5
+1
+ 3
+2
+0.081 -0.024 +0.105
-0.030 -0.113 +0.083
+0.082 -0.063 +0.145
+OB50 +0.014 +0.036
+0.032 -0.033 +0.065
-0.026 -0.030 +0.004 +5
+4
+6
+2
+3
+1
Wilcoxon matched pair signed rank tests comparing early flight subsample with peak flight density subsample as to heterozygosity difference from Hardy-Weinberg expectations (calculated separately for each subsample), overall and for the most common heterozygote 3/4. nl = number of animals in early subsample: n2 = number of animals in peak density subsample; dif = total difference between each early and peak subsample pair departure from Hardy-Weinberg expecta- tion; rank dif = signed rank of that difference within each comparison series. In both comparisons samples = 6, T, = 0, P = 0.016, and the early subsamples are more heterozygous than the peak density subsamples. See the text for further details.
early parts of the day. Further, 3/3 and 3/4 are so far above 4/4 in overall flight density that both can be distinguished from 4/4, subsample by subsample, by Wilcoxon matched pair rank tests including all subsamples, even the peak- density ones that bias against detection of differences. For 3/4 vs. 4/4, the Wilcoxon score T, = 39.5, n = 21, P
<
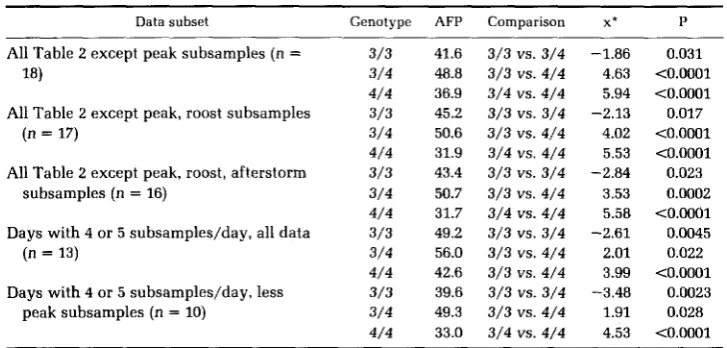
0.005; for 3/3 vs. 4/4, T, = 40.5, n = 21, P c 0.005. However, 3/4 and 3/3 are so close that the Wilcoxon test does not distinguish them.Over all subsamples on all days, the average percentage flight activities for the three genotypes are: 3/4, 59.2; 3/3, 55.8; 4/4,42.5. Since we are not interested in comparison of the peak density subsamples, where by design (see above) all three genotypes will be closely similar, we should deduct these; the average percentages are then 3/4,51.0; 3/3,46.3; 4/4,31.4. Table 4 shows the GOLDSTEIN’S
DISTRIBUTIONS OF ORIENTATION TO SUNLIGHT
TIME OF DAY
FIGURE 1.-Flight density comparisons through the day for the three most common genotypes of Colias PGI in the subsample series A-E of September 24, 1980, studying C. eurytheme at Tracy, California. Time of day within which each subsample was taken is indicated at the bottom. T, = ambient air temperature. % peak flight density is taken from Table 2 and calculated as explained in the text. Distributions of actual orientations to sunlight are also figured, corresponding to the average orientations presented for each subsample in Table 2. Animals were active on this day at higher air temperatures than in other samples. This has nothing to do with PGI effects but stems from the low solar absorptivity, hence lower body temperatures at the same air temperature, of the “summer” photoperiod-morph adults present on this day, as compared with the “fall” morphs sampled at the Tracy site on November 2, 1980, or the C. p. eriphyIe studied in Colorado.
greater flight density than 3/3
-
P = 0.031-
and both these genotypes show great significance of their flight advantage over 4/4. If the late afternoon, roosting subsample of November 1980 is excluded too, as it should be (see above), Table 4 shows that the discrimination between 3/4 and 3/3 increases both in magnitude and in significance level.Another possible view is to consider only the three most extensively subsam- pled days, those with four or five subsamples each, as more accurately exam- ining the issue of overall, through-the-day flight density. In that case, even without excluding any subsamples, the percentages are 3/4, 56.0; 3/3, 49.2; 4/4, 42.6; and excluding peak subsamples they are 3/4,49.3; 3/3, 39.6; 4/4, 33.0. Table
4 shows that both data subsets show high significance of the 3/4-3/3 separation, as well as the others.
PGI ALLOZYME PREDICTION TESTS
E\
m 3 3 3 3
- 3 s
cy
N Z S
r.
& % % % l a @ J a * m
m v v
h l d N
d
4
%
%
4
mmk o a
3
V ' 4 "V ) Z d r ( d U 3 0 )
z
s
a
s
3
s
z
z
r( m m w m m
~ m m
d
W N N
G ; f Z % 9 s l a w
e m *
N N *
* e J $ Z %
w
-Js
s
r. N V )
m
z
5
2 % :
r(ZE3388
: z %
m d m
" N
o w w ~ r . a m m
W N N N " w m
a * * v) m
2
2
2
XZ!$"2
2
2
B
d
c c z C C C C C c c C G
2
2
5
2 2 2 2 2 2 2 2 . 5c U U.5 U I I Y F I k U U Y ' g-"
3w w- w- c -w -w - w + w + w
$
$
4 0
aw a a % : = Z 2 % *w* ddo" p
2 2 :
[4 012
. ; ? c y @ ? ?
. ; % ?2 - 4 2
??ZEE
S
N
Z
% Z % 3 %
A m & % & %
,&bw&@J:z:,&
F d w? s p ? T s
d N Nmm m m m m m m m m m m
v
v
u
u
v
v
v
u
V!X0 0 0 0 0 0 0 0 0 0
2 4 2 + d
2
2
c s c y
r( N * W N * N
h d d
* N d
N d
N "
m w d
g s d m m
4,E:
4
0 2 5 O d d
; x * m m g z sm m2 5
3
2
5
v n w d m v a w L U X
x
-2
x
E
I2
d
S
m
5
V d5 8 s
z s
6
.s
Z e 2
> mY g 8
< U
S Z G
g c
O N N
ii
m N
733
-
0 0 - M' 6.x Oa'$ c '3 a
a
c 6 . s
g 0 c u . - Z * a-.sa
g
w - 1Ip g ? g 5 . ! 4
h , a z 5
c mz z
s
w e 8 6a- c c m E . 9 & $ .
g'g
mo-!iz
9
&c 0 : "'is w-a c M 3 3 $ E m C E S f w
0
azz
v E . - - m " m q = r E.s
z
,8
e-2 g%E-.
a ce
g B0
s-,
m L.Sm c g 3
g I1 2,e'aw (I h
1 ¶ U o o . ~ $ C Q C
ksz
Z$B$$
-"$ A- m G Z '
.3
2 3 2 . g j
$2
5 2 . 2
20
2
2 :3 oo E ._.-
E .5
4
.E
2
II ;.g
$1 h m c . z
8
* 2
l l T Q & w >
a - 2 m a m" Cu al
6 2
.g
af#J 0" $' v + e ? s *".e
$ m m E z $ x S $
.- e % 11 z , " $ g . s C
00 E-.- 3 2 2 a-ag
4 @ z ~ I ~ o 3 $ E 2
3 o S ; ~ + E ~ ~
22
2* k . s z ;
s
:s;-u;-s-,-
8
'2 ,o * 2 e o 0 00.- EE 4
4 "
*.;
:;.a,
-
A %g d
u::-3
2
E c cu$$zz
5 2: + 7 3 . e 2 g
a = m 3 6 2 . 5 2
E
.: 2
.s
g
,g
e c Z-g O r S Q Z1 2 g . z m a W "
v z m o 0 % E
c a
z z . a s E m = +
v , z m - p p , " k
.g
k
g
s
e . g z
0 -"e
e E
6;s
s
&'a
8; g
U?
& 3 & ' j-a
E +
2 822
$js
O
s
0 B o II?$E
3 2 3 * 2 . g i G . a l l d u o . 5 SE:-'-- 2 2 %
n.sa3
8 i;o s g z ' -
oat;,
m ,c
$.%%z
01b Mtd.O,C E 2 0 0 0
:
L E S S 3zE a & 0 )
a v)
-
U w w , c Pm ..e m ¶ - m
E
2.Z.g:
2
6;:+ m c m E . c
m e w > * - CO-
I-. V) m n , . - + ; ; T
-
- 0 0 0Z 3 a E ~ g ~ g . g
2
$ ' Z mc a 7 ; j . o w c
3 m E O rJl m.-
11 8 II
:2,2;,;2
m .-U *
1 ; & s . S U P
e z s
m .e I+ 0 .-734 W. B. WATT, R. C. CASSIN AND M. S. S W A N
TABLE 3
Doily-subsample experiment series evaluoting activity differences omong PGI genotypes 3/3, 3/4, and 4/4 in Colios
Sample
Subsam- Activity X sub-
Pies t n ) sample Activity x genotype
Activity x genotype X
subsample
C. p. eriphyle 11 Aug 80
26 Aug 80 14 Aug 81 25 Aug 81
Gunnison, CO
Gunnison, CO
Gunnison, CO
Gunnison, CO
C. eurytheme 24 Sept 80 2 Nov 80
Tracy, CA
Tracy, CA
4 GS = 83.4 P € 0.001 4 G:$ = 43.8 P < 0.001 2 G , = 32.9 P < 0.001
3 Gz 52.1
P < 0.001
5 Ga = 611 P << 0.001 3 GZ = 59.2
P < 0.001
Gz = 9.2 P = 0.01 Gz = 0.67 0.7 < P < 0.8 Gz = 22.5 P < 0.001 Gz = 13.1 0.001 < P < 0.005
G2 = 10.4 0.005 < P < 0.01 Gz = 13.9 P < 0.001
Gs = 26.1 P < 0.001 Gs 20.1 0.001 < P < 0.005 G2 = 3.8 0.10 < P < 0.20 Gd = 14.3 0.005 < P < 0.01
Ga = 36.7 P < 0.001 G4 4.0 0.3 < P < 0.5
The multiway G test protocol of SOKAL and ROHLF (1969), including interaction analysis, has been used to evaluate the data of Table 2. G, = G value with i degrees of freedom. All overall independence (homogeneity) tests depart significantly at P < 0.001 and, thus, are not tabled. By hypothesis, no genotype X subsample interactions depart from homogeneity, as "animals available" are calculated from peak flight density subsamples as explained in the text.
verified: the order of overall flight density through the day is 3/4
>
3/3>>
4/4,and the 4/4 genotype is specifically most disadvantaged at lower environmental temperatures, where 3/4 and 3/3 are more kinetically similar.
Prediction: In contrast to the situation prevailing under low to moderate temperature conditions, under conditions of high heat stress, the most stable genotypes 4/4,4/5 and 5/5 will show better survivorship than other less stable, initially kinetically favored genotypes. This follows from the idea that the less stable genotypes, as their PGI is denatured under environmental thermal stress, will lose their initial kinetic advantage over the more stable genotypes, unless resynthesis of PGI is both present and very rapid. Thus the more stable genotypes may acquire a relative advantage of kinetic capacity at the PGI step, by retaining disproportionately more of their original capacity, if the thermal stress is severe enough. Our samples involving brood 198011 at Gunnison, Colorado, provide the requisite environmental condition of unusual heat stress. The second brood in this region is normally exposed to a higher degree of afternoon heat than the first brood, but through the first half of the 198011 brood flight period, including the August 11 sample series, a n unusual heat spell was experienced [see air temperature data in Table 2, also the Gunnison entries in NOAA Colorado climatological records (1980)l. Under such conditions, the prediction leads us to expect a n increase in the frequency or average age of heat-stable genotypes in the latter part of this brood.
The three most heat-stable genotypes are 4/4,4/5 and 5/5 (WATT 1977, 1983).
TABLE 4
Tests of differences among Colias PGI genotype flight percentages
Data subset Genotype AFP Comparison x* P
All Table 2 except peak subsamples (n = 18)
All Table 2 except peak, roost subsamples (n = 17)
All Table 2 except peak, roost, afterstorm subsamples (n = 16)
Days with 4 or 5 subsamples/day, all data (n = 13)
Days with 4 or 5 subsamples/day, less peak subsamples (n = 10)
3/3 3/4 4/4 3/3 3/4 4/4 3/3 3/4 4/4 3/3 3/4 4/4 3/3 3/4 4/4
41.6 3/3 VS. 3/4 -1.86 48.8 3/3 vs. 4/4 4.63 36.9 3/4 vs. 4/4 5.94
50.6 3/3 vs. 4/4 4.02 31.9 3/4 vs. 4/4 5.53
50.7 3/3 vs. 4/4 3.53 31.7 3/4 vs. 4/4 5.58
56.0 3/3 vs. 4/4 2.01 42.6 3/3 vs. 4/4 3.99 45.2 3/3 VS. 3/4 -2.13
43.4 3/3 VS. 3/4 -2.84
49.2 3/3 VS. 3/4 -2.61
39.6 3/3 VS. 3/4 -3.48 49.3 3/3 vs. 4/4 1.91 33.0 3/4 vs. 4/4 4.53
0.031 <0.0001
<0.0001
0.017
<0.0001
t O . O O O 1 0.023 0.0002 t0.0001 0.0045 0.022 tO.OOO1 0.0023 0.028 to.ooo1
GOLDSTEIN’S (1964) percentage difference tests of average flight percentage (AFP) among PGI genotypes. n = number of subsamples pooled for comparisons. Peak subsamples omitted where noted because these by definition bias against detection of flight differences; roosting or after-storm subsamples omitted where noted because animals’ motivation to fly is/may be different from ordinary flight sampling; see text for further details of both situations.
in frequency of alleles 4 and 5 from early to late in the brood under thermal stress conditions. Given the specificity of genotypic differences in thermal stability, allele frequencies might be a relatively insensitive indicator. There is a difference of allele 4
+
5 frequency, from mid- to late brood, in the direction predicted: August 11, 1980, n = 458, P 4 + = 0.334; August 26, 1980, n = 474, P 4 + 5 = 0.386, and by GOLDSTEIN’S test (see above), one-tailed, this is just barely significant: x* = 1.65,P
= 0.0495. The frequency of these three genotypes shows a more pronounced shift, indicating greater survivorship: August 11, 1980, n = 229, P4/4 + 415 + 515 = 0.109: August 26, 1982, n = 237, P4/4 + 4 / 5 + 5 / 5 = 0.177, and bythe same GOLDSTEIN’S test, the difference is highly significant: x* = 2.09,
P
= 0.018.Finally, one could ask what the difference in wear rating, as an indicator of relative age and hence duration of survival, is between the most stable genotypes and all others in the sample. The wear rating, R, measures on a scale of 1 to 5, by 0.5 increments, the degree of erosion of scales and tearing of wing cuticle. It has been shown in demographic studies (WATT 1977; WATT, HAN and TABASHNIK 1979) to index the age of individuals roughly, and the average age of samples quite well (cf. also WATT 1983).
In the sample of August 11, 1980, early in brood 198011 and in the midst of heat stress, Ii4/4+ 4 / 5 + 5 / 5 = 3.02, n = 25, whereas Rothers = 2.90, n = 204. On
736 W. B. WATT. R . C. CASSIN AND M. S. S W A N
be lumped classes of a continuous distribution): FI,z? = 0.38, 0.5
<
P<
0.75. However, for the August 26, 1980 sample, there is a clear wear-indexed age differential, with the most stable genotypes older as predicted: F1,235 = 5.8, 0.01<
P<
0.025. This difference cannot be accounted for by a n earlier emergence ofcarriers of the most stable genotypes; this would have produced higher frequen- cies of these genotypes, and of alleles 4 and 5, earlier in the generation, and as we have seen already the opposite occurred. In this case, the prediction is confirmed at all accessible levels of analysis.
In 1981, brood I1 at this site was not subjected to such extreme overheating conditions, although as usual the weather was warmer than for the first brood. In the early (August 14, 1981) sample, Rstable = 2.58, n = 6, whereas Rothers = 2.61, n = 108; this difference was insignificant by ANOVA, P
>
0.75. For the later (August 25, 1981) sample, Rstat,le = 3.42, n = 12, whereas Rothers = 3.14, R = 156; this difference was also insignificant by ANOVA, 0.25<
P 0.5, but perhaps suggestively, the trend of relative age was in the same direction from early to late sample as in 1980. Further work may reveal whether or not this warmer- weather second brood does usually experience some selection favoring the more stable genotypes, even though this would usually be less severe than in 1980.DISCUSSION
Our findings show that, for some loci at least, genetic sampling of natural populations must be done with attention to the specific ecology of the organisms studied, if the samples are to be valid or consistently interpretable. Suppose one were to begin sampling a geographical transect of Colias populations in early morning, and progress through that transect in the course of 1 day. The samples thus obtained would, without thermal microenvironment data, at least some comparative demographic information (see WATT 1983), and reference to time- of-day of each sample, be completely noncomparable with respect to PGI genotype frequencies. One is led to suspect that population genetic sampling of other organisms may often in the past have seriously obscured such patterns of spatial and temporal variation in the wild, which more careful work would have detected.
or no credibility as an alternative explanation for the maintenance of this polymorphism.
It is possible that the magnitude of some of the effects seen in the wild might result from close linkage association between the PGI locus and other loci whose genotypes interact with selective pressures in ways closely parallel to the PGI genotypes, so that genotype frequency changes at any one of these loci would reflect the summation of similar selective pressures on all of them. This would require not only an extraordinary matching of allelic and genotypic properties across the loci in question, but also an effective means of maintaining precise linkage disequilibria among the various gametic combinations, as occurs in the chromosomal inversions of Drosophila. However, no evidence for such mechanisms exists to date in this system.
We will pursue experimental understanding of the in vivo effects of these genotypes on glycolytic pool sizes and fluxes, and on their physiological consequences for walking and flight capacity, under a natural range of body temperature and activity demand conditions. It may also be possible to design artificial selection experiments, and further experimental studies in the field, to examine additional features of this polymorphism. It should then become possible to evaluate net fitness differences among genotypes at this locus, and perhaps tn make connections between strength of physiological effects and of the resulting fitness differences.
Comparison of this locus to other polymorphic loci in glycolysis will be of great interest. In many of the sample series studied here, the polymorphic loci phosphoglucomutase (PGM) and glucose-6-phosphate dehydrogenase (GGPdH), which share the substrate G6P with PGI in the branch point among storage, glycolysis, and the pentose shunt, have also been studied. These loci, which are not genetically linked to PGI in Colias (W. B. W A T T , unpublished results), do
not appear to covary in any systematic way with the PGI variants in these samples. This suggests that the (now unknown) explanations for the mainte- nance of these other glycolytic polymorphisms are quite distinct from that appropriate to PGI. (These results will appear in detail elsewhere.) This opens up the possibility of studying a spectrum of selection pressure modes and strengths, still possibly including some cases of no selection, at functionally related loci.
738 W. B. WATT, R. C. CASSIN AND M. S. SWAN
genotype frequencies, driven by thermally based selection pressures, at this single locus analogous to the seasonal cycling of chromosomal inversion fre- quencies in Drosophila pseudoobscura (DOBZHANSKY 1970). Studies proceeding in parallel on the structure of environmental thermal variability relative to Colias’ thermal adaptations (e.g., KINGSOLVER 1983a,b; KINGSOLVER and WATT 1983) should help to clarify the interaction of such selection patterns on different time scales.
We are grateful to: CAROL BOGGS, RON BURTON, BRYAN CLARKE, PAUL EHRLICH, KENT HOLSINGER and JOEL KINGSOLVER for stimulating commentary on this work and/or manuscript; ALAN MALONEY for help in taking one of the subsample series; and the National Science Foundation (DEB 75-23458, DEB 80-11129) and the National Institutes of Health (GM 26758) for grant support.
LITERATURE CITED
BURTON, R. S., 1981 Ecological Genetics of the Intertidal Copepod, Tigriopus californicus. Ph. D.
Population genetics of Tigriopus californicus. 11. Differ-
LDH-B genotype-specific hatching times of Fundulus Thesis, Stanford University.
entiation among neighboring populations. Evolution 35: 1192-1205.
heteroclitus embryos. Nature 296: 563-564.
between LDH-B genotypes of Fundulus heteroclitus. Science 216 1014-1016.
York.
BURTON, R. S. and M. W. FELDMAN, 1981
DIMICHELE, L. and D. A. POWERS, 1982a
DIMICHELE, L. and D. A. POWERS, 1982h Physiological basis for swimming endurance differences
DOBZHANSKY, TH., 1970 Genetics of the Evolutionary Process. Columbia University Press, New
GOLDSTEIN, A., 1964
HOFFMANN, R. I., 1981a
HOFFMANN, R. J., 1981h
KINGSOLVER, J. G., 1983a
KINGSOLVER, 1. G., 1983b
Biostatistics. Macmillan, New York
Evolutionary genetics of Metridium senile. I. Kinetic differences in phosphoglucose isomerase allozymes. Biochem. Genet. 19 129-144.
Evolutionary genetics of Metridium senile. 11. Geographic patterns of allozyme variation. Biochem. Genet. 19 145-154.
Thermoregulatory strategies in Colias butterflies. I. The determinants of flight activity: elevational patterns and mechanistic limitations. Ecology. In press.
Thermoregulatory strategies in Colias butterflies. 11. Thermoregulation and the ecological significance of flight activity: implications for reproductive strategy and population structure. Ecology. In press.
Thermoregulatory strategies in Colias butterflies. 111. Thermal stress and the limits to adaptation in temporally varying environments. Am. Nat. 121:
Flight activity of Colias philodice eurytheme Boisduval in KINGSOLVER, J. G. and W. B. WATT, 1983
32-55.
LEIGH, T. F. and R. F. SMITH, 1959
response to its physical environment. Hilgardia 28: 569-624.
LEVINS, R., 1968
National Oceanographic and Atmospheric Administration, 1980
PLACE, A. R. and D. A. POWERS, 1979
Evolution in changing environments. Princeton University Press, Princeton.
Colorado, June-August. Clima- tological Data 85: 6-8.
Genetic variation and relative catalytic efficiencies: lactate dehydrogenase B allozymes of Fundulus heteroclitus. Proc. Natl. Acad. Sci. USA 76: 2354- 2358.
ROHLF, F. J. and R. R. SOKAL, 1969
SHICK, 1. M., R. J. HOFFMANN and A. N. LAMB, 1979 Asexual reproduction, population structure, Statistical tables. W. H. Freeman, San Francisco.
SNYDER, L. R. G., 1978a Genetics of hemoglobin in the deer mouse, Peromyscus maniculatus. I.
Genetics of hemoglobin in the deer mouse, Peromyscus maniculatus. 11.
Deer mouse hemoglobins: is there adaptation to high altitude? Bioscience Multiple a- and P-globin structural loci. Genetics 8 9 511-530.
Multiple alleles at regulatory loci. Genetics 8 9 531-550.
SNYDER, L. R. G., 197813
SNYDER, L. R. G., 1981 3 1 299-304.
SOKAL, R. R. and F. J. ROHLF, 1969
TABASHNIK, B. E., 1980
Biometry. W. H. Freeman, San Francisco.
Population structure of pierid butterflies. 111. Pest populations of Colias
WATT, W. B., 1968 Adaptive significance of pigment polymorphisms in Colias butterflies. I.
WATT, W. B., 1977 Adaptation at specific loci. I. Natural selection on phosphoglucose isomerase
WATT, W. B., 1983 Adaptation at specific loci. 11. Demographic and biochemical elements in the
WATT, W. B., D. HAN and B. E. TABASHNIK, 1979 Population structure of pierid butterflies. 11. A
WRIGHT, S., 1946 Isolation by distance under diverse systems of mating. Genetics 31: 39-59.
WRIGHT, S., 1951 The genetical structure of populations. Ann. Hum. Genet. 15: 323-354.
philodice eriphyle. Oecologia 47: 175-183.
Variation of melanin pigment in relation to thermoregulation. Evolution 2 2 437-458.
of Colias butterflies: biochemical and population aspects. Genetics 8 7 177-194.
maintenance of the Colias PGI polymorphism. Genetics 103: 691-724.
"native" population of Colias philodice eriphyle in Colorado. Oecologia 44: 44-52.