ABSTRACT
ZHANG, CHI. Three Essays on Cross-border M&A. (Under the direction of Ivan Kandilov and Mark Walker.)
My dissertation consists of three chapters about cross-border M&As. The first chapter searches
the papers about cross-border M&A. I find that the majority of previous research agrees on the
negative role of distance between the host country and the home country. Prior literature also
discusses ways to shorten the distance between the host country and the home country in
cross-border M&A. The distance not only refers to the geographic distance between the host country and
the home country, but also the other distances including the cultural distance, financial institutions
distance, differences in regulation, and political distance. Following this line of thought, the second
chapter concentrates on how the government policy can shorten the institutional distance between
the host country and the home country. Specifically, the second chapter investigates the Belt and
Road Initiative and Chinese cross-border M&A. The third chapter focuses on how more efficient
transportation shortens the geographic distance between the host country and the home country.
© Copyright 2020 by Chi Zhang
Three Essays on Cross-border M&A
by Chi Zhang
A dissertation submitted to the Graduate Faculty of North Carolina State University
in partial fulfillment of the requirements for the Degree of
Doctor of Philosophy
Economics
Raleigh, North Carolina
2020
APPROVED BY:
Jesse Ellis Jared Smith
Ivan Kandilov
Co-chair of Advisory Committee
Mark Walker
DEDICATION
BIOGRAPHY
I was born in Guangzhou, China. I received my bachelor degree in Economics from Guangdong
University of Foreign Studies, China. I was also a visiting student at Columbia University in the City
of New York in 2015. Following my graduation from Guangdong University of Foreign Studies, I
studied economics at North Carolina State University, earning a master’s degree in 2018. My doctoral
ACKNOWLEDGEMENTS
I would like to thank my advisors, Ivan Kandilov and Mark Walker for their help. And I would also
TABLE OF CONTENTS
LIST OF TABLES . . . vi
LIST OF FIGURES. . . vii
Chapter 1 PREVIOUS RESEARCH ON CROSS-BORDER M&A. . . 1
1.1 Introduction . . . 1
1.2 Cross-border M&A as the Main Entry Mode of FDI . . . 1
1.3 The Factors Affecting The Target Selection in Cross-border M&As . . . 3
1.4 The Factors Affecting The Market Return in Cross-border M&As . . . 5
1.5 The Impact after the Cross-border M&As . . . 6
1.6 Shortening the Distance between Host Country and Home Country . . . 6
Chapter 2 THE BELT AND ROAD INITIATIVE AND CHINESE CROSS-BORDER M&A . . . . 8
2.1 Introduction . . . 8
2.2 Literature Review . . . 11
2.3 Data and Identification Strategy . . . 13
2.3.1 Data . . . 13
2.3.2 Identification Strategy . . . 16
2.4 Empirical Results . . . 17
2.4.1 Baseline Regression . . . 17
2.4.2 Sub-sample Regression . . . 19
2.4.3 Robustness Tests . . . 22
2.5 Conclusion . . . 28
Chapter 3 DIRECT FLIGHTS AND CROSS-BORDER M&A . . . 29
3.1 Introduction . . . 29
3.2 Conceptual Framework and Data . . . 34
3.3 Identification Strategies and Empirical Results . . . 36
3.3.1 Identification Strategies . . . 36
3.3.2 Summary Statistics . . . 40
3.3.3 Baseline Results and Robustness Tests . . . 42
3.3.4 Impact of Direct Flight on Premiums and Returns . . . 53
3.4 Conclusion . . . 57
BIBLIOGRAPHY . . . 58
APPENDIX . . . 67
LIST OF TABLES
Table 2.1 List of Treatment Country and Control Country . . . 14
Table 2.2 Summary Statistics . . . 15
Table 2.3 Baseline Regression . . . 18
Table 2.4 The Impact of B&R Initiative on Number of Cross-border M&A Deals in Dif-ferent Industries . . . 19
Table 2.5 The Impact of B&R Initiative on Dollar Value of Cross-border M&A Activity in Different Industries . . . 20
Table 2.6 The Impact of B&R Initiative on State-owned Enterprises compared to Private Enterprises . . . 20
Table 2.7 The Impact of B&R Initiative in Coastal Provinces compared to Interior Provinces 21 Table 2.8 The Impact of B&R Initiative, Alternative Specifications . . . 23
Table 2.9 Falsification Tests . . . 23
Table 2.10 Summary Statistics, Cumulative Abnormal Announcement Returns . . . 25
Table 2.11 The Impact of B&R Initiative on Cumulative Abnormal Announcement Returns 26 Table 2.12 The Impact of B&R Initiative on Trade Volume . . . 27
Table 3.1 Summary Statistics in US MSA-Chinese City Pair Level . . . 40
Table 3.2 Summary Statistics by US Acquirers and Chinese Acquirers . . . 41
Table 3.3 Summary Statistics in Transactions Level . . . 42
Table 3.4 The Non-stop Direct Flight and Cross-border M&As in City Pairs . . . 43
Table 3.5 The Non-stop Direct Flights and Cross-border M&As in State-Province Levels 46 Table 3.6 The t-test by Reduction of Flight Time and Cross-border M&A . . . 46
Table 3.7 Regressions of Reduction of Flight Time and Cross-border M&A . . . 47
Table 3.8 The Non-stop Direct Flights and Cross-border M&As in City-City Levels . . . . 48
Table 3.9 Endogeneity Tests for the Reverse Causality – Leads and Lags . . . 50
Table 3.10 Endogeneity Tests for Omitted Variables –Randomized Direct Flights . . . 51
Table 3.11 The Non-stop Direct Flights and Cross-border M&As-Symmetry of Impact . . 52
Table 3.12 The Event Study of Non-stop Direct Flight and Cross-border M&As . . . 54
Table 3.13 The Alternative Specification for the Event Study . . . 55
Table 3.14 The Event Study of Cross-border M&A by US Acquirers . . . 56
Table A.1 The Chronology of Introduction of Non-stop Direct Flights . . . 69
Table A.2 Definition of Variables . . . 70
Table A.3 Randomized Non-stop Direct Flights . . . 71
LIST OF FIGURES
Figure 2.1 The Difference in the Number of Cross-border M&As in Treatment Countries and Control Countries with 95% confidence interval . . . 24 Figure 2.2 The Difference in the Transaction Amount of Cross-border M&As in
Treat-ment Countries and Control Countries with 95% confidence interval . . . 24
CHAPTER
1
PREVIOUS RESEARCH ON
CROSS-BORDER M&A
1.1
Introduction
The literature review begins with a discussion on Foreign Direct Investment (FDI) and
cross-border M&A as the main entry mode of FDI. Second, I review the external factors and internal
factors affecting the target selection in cross-border M&As. Third, I consider the external factors and
internal factors affecting the market returns in cross-border M&As. Finally, I discuss other impacts
following a cross-border M&A and introduce the following two chapters.
1.2
Cross-border M&A as the Main Entry Mode of FDI
Foreign direct investment (FDI) is a well researched topic in both international trade and finance.
Much of the previous research focuses on the factors that drive FDI. Prior evidence indicates that
home country exports to the host country, and the larger the home country market size, the greater
the volume of FDI because of better networks and more access to credit[GR96]. Further, the better political stability and infrastructure in host country can also encourage FDI because of lower risk [LDW95]. Higher GDP per capita and more dense manufacturing in the host country[CC91], larger host country size[HA99], better access to credit in the home country (Klein, 2002) and less bank regulation in the host country[KIT16]also encourage FDI. On the contrary, more partisan conflict in the host country[M19]will discourage FDI because the investment will face more risk. Meanwhile, greater home country imports from the host country[GR96], and greater cultural and geographic distances of the home country from the host country[GR96]deter the FDI. The higher host country tax rate[HA99]discourages the FDI because the firms have to burden more tax. A more uncertain environment in the host country[RP96], the greater requirements for the headquarter in the home country[LDW95], the more pollution abatement fees in the host country[KW02]and the higher wages in the host country[CC91]deters the FDI. Furthermore, the FDI is affected by the exchange rate and the interest rate difference between home and the host country[GR96; KMW94; B97].
For the impact of FDI in the host countries, most of the previous papers suggest that FDI can
increase the productivity of domestic firms in the host countries. Domestic firms in the host countries
can enjoy the benefit of technology spillover and improve quality of management because of the
more fierce competition[ABJ99; LX00; S04]. However,[HM93]find improvement of productivity only in small domestic firms following FDI and no spillover effects created by FDI. Moreover, in
consistent with weak investor protections affects decisions to deploy technology through FDI as
opposed to arm’s length technology transfers[AP09].
The entry mode of FDI is also important. Entry modes of FDI include cross-border M&A,
green-field investment and joint ventures. The optimal entry mode of FDI depends on the industry and
available resources. For example,[BKD00]suggest that firms making relatively small investments, possessing high levels of technology and multinational experience, with high levels of diversity,
making investments in high growth, high uncertainty markets prefer greenfield start-up ventures
to acquiring existing organizations. Furthermore, in industries where firms differ mainly in their
mobility, the most efficient firms will engage in cross-border M&A, while in industries where firms
differ mainly in their country specific non-mobile capabilities, the greenfield investment and joint
For the absolute and relative resources,[AJ02]show that the higher the relative technological intensity of the host country in the entered industry, the greater the advertising intensity in the
entered industry and the more intensively sales forces are used in the entered industry, the greater
the probability the mode of foreign entry will be by acquisition. However, based on the United
Nations Conference on Trade and Development (UNCTAD) in 2019, the ratio of cross-border M&A
to total FDI is about 80%, indicating that cross-border M&A is the main entry mode of FDI. The
rest of this chapter will discuss the factors that affect the location selection and target selection in
cross-border M&As and the determinants of return in cross-border M&As.
1.3
The Factors Affecting The Target Selection in Cross-border M&As
Cross-border M&A has become more popular for firms as they seem to expand their business
across national borders. The aggregate dollar volume of cross-border acquisitions increased from
21% of total merger activity worldwide in 1996 to more than 35% in 2018 (Thomson Reuters, 2019).
The economic importance of cross-border M&A has naturally led to an growing literature. In
par-ticular, economists have focused on both external factors and internal factors affecting the target
selection in cross-border M&As.
The target location is a critical matter for acquirers to consider. One of most important external
factors is the difference in the legal system and regulation between the host country and home
country as large differences discourage cross-border M&A. The difference in law and regulation
between the host country and home country affects the corporate valuation, making proper
valua-tion of the target more challenging to engage in the cross-border M&A[LPR02]. Further, differences in corporate ownership structure creates challenges for the acquirers[LPR99]. Differing legal and regulatory regimes between the host country and home country causes differences between the
acquirer and the target in the way of external finance[LPR97], investor protection[LPR98], corporate governance[LPR00]and the self-dealing problem[DS08]. All of these issues makes it more difficult for the acquirer to manage a target post acquisition.
Another factor is the political risk and the economic policy uncertainty. Previous research
sug-gests that political risk and economic policy uncertainty in the host country deters local companies
uncer-tainty in the home country encourages the local acquirers to do more cross-border M&A deals[BPJ07; JB16; K.18; CC19]. Foreign investors face more uncertainty about the attitude of the government in the host country. This political risk as well as broader economic policy uncertainty, limits local
com-panies from becoming targets in cross-border M&A. In contrast, local acquirers participate in more
cross-border M&A deals with more political risk and the economic policy uncertainty as a hedging
device. The government support in host and home country can encourage more cross-border M&A [LY10; CL12; WC12; LJ14]through more access to credit with lower cost and government policies can facilitate firms after the deals are completed. However, some governments in the host country
prefers that target companies remain domestically owned rather than foreign-owned[DL13]. Financial markets in the host and home country are also important. Acquirers are likely to do
more cross-border M&A deals in larger financial markets in the home and host country as they
benefit from lower systematic risk as well as having more access to credit[D05; RP05]. There are more cross-border M&A deals when the stock market performance improves in the host country
indicating targets with better growth prospects are in higher demand[EI12]. Acquirers also tend to choose targets in host countries that have lower taxes than the home country to better manage tax
liabilities[GY19]. Acquirers in countries with lower accounting standards and worse shareholder protections tend to do more cross-border M&A[RS04]and they prefer targets in countries with less regulations[KGA15].
Travel time between the acquirer and potential targets is also an important determinant in
cross-border M&A. When travel time is less, firms make more investments in their divisions and
better manage the division[X13]. Proximity also assists in the functional specialization between the headquarters and divisions[CP18]. Venture capital firms[BS16]and hedge funds[EJA19]are also more likely to invest in firms with shorter travel time. Proximity also lowers search and outsourcing
costs leading firms to find better suppliers, reducing marginal costs[BAB19]. Collectively, this line of acquirers benefit from lower transaction costs with less travel time, which potentially assists
acquirers identifying targets ex ante and managing acquired assets ex post.
The internal firm specific factors are also important. From the perspective of acquirers,[FMA10] show that when the ownership of foreign institutional investors is higher, the firms will have more
cross-border M&A deals. Furthermore, the acquirers’ administrative heritage[S95]and the strategic aim of acquirer[BH98]will also affect the number and transaction amount of cross-border M&As. From the perspective of targets, firms with more strategic resource such as critical natural resources and
technologies are more likely to become targets in cross-border M&As[DP15].[BA16]suggest that the financial risk of target will deter the cross-border M&A and[FL16]suggest that acquirers will consider the target specialization in cross-border M&A.
1.4
The Factors Affecting The Market Return in Cross-border M&As
Next, I come to the external and internal factors that affect the market return in cross-border
M&As with a focus on the acquirers’ return. For external factors,[WU06]suggest that when the host country government have more severe corruption and greater policy uncertainty, the acquirers
gain a lower return because the financial market is more negative about potential risk. Similarly,
higher levels of institutional development in the host country is related to higher returns for
ac-quirers in cross-border M&As[CCM08; L14; DM15].[LC19]show that the country-dyadic military conflicts decrease the market return of acquirer in cross-border M&A due to increased risk. A more
controversial factor is the cultural differences between the home and the host country. Some papers
suggest that acquirers benefit from the cultural differences between the home and the host country [SGK08; CR09], while the other papers show that greater cultural differences between the home and the host country are associated with the lower returns in cross-border M&As[DDK95; WY96; BF14; AKR15].[A06]suggests that the large differences in national culture reduce foreign acquisi-tion performance if the acquired unit is tightly integrated into the acquirer, but that they enhance
acquisition performance if post-acquisition integration is limited. Meanwhile, the greater political
differences between host and home countries cause the lower returns in cross-border M&As[BO16]. For the firm specific factors, the presence of private equity shareholders in acquirers is related
with the higher market return as their presence provides a positive signal for the deal quality and
1.5
The Impact after the Cross-border M&As
Recent papers discuss the impact of cross-border M&As following the deals.[BH99]show that the transfer of technology is facilitated by communications, visits and meetings, while the transfer
of patents is associated with the articulability of the knowledge and the size of acquired unit.[BI07] show that cultural differences affect the post-acquisition capability transfer through their impact on
social integration, potential absorptive capacity, and capability complementarity in cross-border
M&As.[J16]provides evidence that innovation output in the merged entity increases substantially after cross-border M&As, and the increase is driven by the acquirer, while target’s innovation declines. [UD19]suggest that the migrant inventors’ international social networks can be leveraged by their employers in order to identify and integrate relevant knowledge bases of acquisition targets in the
inventors’ home country after the cross-border M&As.
Corporate governance is also imported by firm and country differences. Political connections
play an economically significant role in post-merger performance. The nature of this influence
depends crucially on the institutional environment[BP13].[EJ17]show that acquirers can transport the benefits from good country governance, increasing gains from acquiring targets with worse
country governance than their own.[AR19]suggest that cross-border M&A activity is associated with subsequent improvements in the governance of non-target firms when the acquirer country
has stronger investor protection than the target country. The effect is more pronounced when the
target industry is more competitive and cross-border M&As are also associated with increases in
investment and valuation of non-target firms. For the host country,[BA19]suggest that foreign ownership after cross-border M&As increases the overall energy usage due to expansion of output,
it also decreases the plant’s energy intensity.
1.6
Shortening the Distance between Host Country and Home Country
The majority of previous papers suggest that the distance between the host country and home
country discourages the acquirers from doing cross-border M&As and lowers the financial return
of cross-border M&As. The distance not only refers to the geographic distance between the host
country including cultural distance, financial institutional distance, regulation distance and political
distance. In an effort to improve our understanding of distance and cross-border investments, the
second chapter concentrates on how the government policy can potentially shorten the institutional
distance between the host country and the home country. Chapter two investigates the Belt and
Road Initiative and Chinese cross-border M&A. The third chapter focuses on how transportation
improvements can shorten the geographic distance between the host country and the home country.
CHAPTER
2
THE BELT AND ROAD INITIATIVE AND
CHINESE CROSS-BORDER M&A
2.1
Introduction
The Belt and Road Initiative was created to promote China’s economic cooperation with countries
in Asia, Europe, and Africa. President Xi Jinping expressed his vision of the Silk Road Economic Belt
in September of 2013 as part of his state visit to Kazakhstan. Subsequently, he introduced the New
Maritime Silk Road before the Indonesian Parliament in October of the same year as part of his state
visit to Indonesia. These two proposals, known jointly as the Belt and Road Initiative, were followed
by a series of policies introduced at the end of 2013 to strengthen political, economic, and cultural
ties between China and participating countries in Asia, Europe, and Africa.
The 21st Century Maritime Silk Road begins on the Chinese coast, extending to Europe and
East Africa via the South China Sea and the Indian Ocean on one route, and to the South Pacific
China with the Persian Gulf and the Mediterranean Sea through Central Asia and West Asia, as well
as connecting China with Southeast Asia, South Asia, and the Indian Ocean. In total, the Belt and
Road Initiative includes more than 60 countries with a total population of over 4 billion people,
representing a large fraction of the world’s output. For China, several factors led to the creation of the
Belt and Road Initiative. They include excess productive capacity in some sectors; the twin surpluses
in the current and capital accounts during 2001-2014 that has resulted in a substantial accumulation
of foreign reserves; and Chinese dependence on imports for some key inputs, especially oil, gas,
and minerals. Further, China’s infrastructure is primarily on its eastern coast with a less developed
interior. Improving infrastructure and promoting growth in the interior are priorities for the Silk
Road Economic Belt. Finally, many of China’s neighbors also have economic incentives to increase
their economic ties with one of the world’s largest economies.
The Belt and Road Initiative has a number of specific goals. First, it aims to improve infrastructure
in countries included in the Initiative by promoting Chinese outward foreign direct investment
(OFDI) to these nations. The Initiative has made China the main source of finance for many countries
included in the Silk Road Economic Belt for critical infrastructure projects such as roads, airports,
and railways. These types of projects facilitate transport among countries included in the Initiative
(as well as their neighbors) and China’s western regions. China’s leadership expects that the central
and western parts of China will experience faster economic development by becoming a new
frontier for the country. The Chinese government facilitates domestic firms’ foreign investment in
infrastructure projects in the identified Initiative countries through subsidies and greater access
to credit from state-owned Chinese banks. Further, the increased trade routes between China and
countries included in the initiative are expected to boost cross-border commerce and increase
access to natural resource inputs, critically including oil and gas from countries such as Russia and
Iran.
Many Chinese firms have chosen internationalization by cross-border mergers and acquisitions
(M&A). There are two main advantages of this mode of entry. First, M&A carries lower (institutional)
risk compared with green field investment. Second, the acquiring firm enjoys greater control than if
it had pursed a joint venture instead. Previous work by[DJ18]shows that the Belt and Road initiative mainly boosts cross-border M&As rather than greenfield investment by Chinese publicly listed
different sample and identification strategy.[DJ18]’ s sample includes all the countries that were originally part of the initiative planned by the Chinese government, however, some of these countries
did not join the Initiative, at least not initially. For example, France and South Korea were expected
to join, but their governments had not come into an agreement with the Chinese government until
years after the Initiative had begun. In contrast, some countries such as Afghanistan and Albania
that were not originally part of the Initiative joined during[DJ18]’ s sample period, yet they were excluded from their empirical analysis. Second, and more importantly,[DJ18]’ s identification strategy employs a control group of cross-border M&A source countries, such as Australia, Canada,
Japan, Singapore, United Kingdom and United States, which are likely not a good comparison group
for China. For example, there are few state-owned listed enterprises in the control group countries.
In this paper, we provide an arguably better set of estimates of the effects of the Belt and Road
Initiative on Chinese outbound cross-border M&A activity. To do so, we compare cross-border
M&A activity from China to countries included in the Belt and Road Initiative to cross-border M&A
activity from China to countries that are not included in the Initiative, before and after the Initiative
came into effect. The countries included in the control and treatment groups for the
difference-in-differences strategy we employ are based on their actual participation in the Initiative. Finally, we
use detailed transaction-level data on individual Chinese outward M&A deal activity from 2010 to
2016 in order to shed some light on the mechanisms behind our results.
Our empirical analysis reveals that the Belt and Road Initiative significantly increases both the
probability and the number of outbound cross-border M&A deals completed by Chinese enterprises
in countries included in the Initiative. In particular, we find that following the adoption of the
Initiative, the annual likelihood of outbound Chinese cross-border M&A activity in the included
countries grew by 20%, while the number of deals increased by 0.74. Moreover, the total dollar
volume of border M&A flows also rose, effectively doubling the pre-initiative level of
cross-border M&A flows. We show that these impacts are driven by state-owned enterprises, which should
be the firms most responsive to government programs. These firms likely have easier access to
cheaper (possibly subsidized) credit from the dominant state owned banks, which may be one
of the mechanisms behind the results.[FCF15]discuss how financial constraints in international capital markets affect firms’ choices on multinational investments. Our findings, that the likelihood
rises, and that these deals increase acquirer’s value and are confined to state-owned enterprises, are
consistent with the idea that these financial constraints have been loosened, directly or indirectly as
a result of the Initiative. We also find that the Belt and Road Initiative has the highest positive impact
on the number of outbound cross-border M&A deals for targets in the transportation, mining, and
energy industries, consistent with the stated goals of the Initiative. Finally, our estimates suggest that
exports from China to countries in the initiative rose significantly, but imports from these countries
to China were not affected, during our sample period of the early period of the Initiative.
The rest of the paper is organized as follows. Next, we provide a review of the existing literature
on the Belt and Road Initiative and outbound cross-border M&A activity by Chinese firms. Section
Three discusses the identification strategy and the data we use in our empirical work. The following
section discusses the results, and the last section concludes.
2.2
Literature Review
There is a small but rapidly growing literature on the economic and political impacts of the Belt and
Road Initiative. Recent work by the World Bank[Rut19]uses a computable general equilibrium model to show that overall FDI flows to countries included in the Belt and Road Initiative are projected
to grow by about 5 percent. In their analysis of Chinese foreign investment in Africa,[Che18]find that both horizontal and vertical FDI is profit-driven. Further, in skill-abundant countries, Chinese
FDI is relatively more concentrated in skill-intensive sectors. Previous work also has suggested that
the Initiative is not only an economic policy[Y16], but also a geopolitical project[P16; BJMF17]. When it comes to the impact of the Initiative on outbound foreign direct investment,[DJ18]find that the initiative has positive effects for cross-border M&As. They find that state-controlled acquirers
played a leading role in infrastructure sectors, while the non-state-controlled acquirers were more
active in non-infrastructure sectors. Central and West Asia, Western Europe and Russia are favorable
destinations of Chinese OFDI in the Belt and Road countries.
Much of the existing work on outbound Chinese OFDI has focused on motives for these
invest-ments. The literature suggests that the main goal of Chinese OFDI IS strategic assets such as natural
Additional work evaluates the location decision of Chinese OFDI. Prior evidence indicates that
the Chinese government plays an important role in the selection of location for such investments [LY10; CS12; WC12; LJ14]. Some previous research also suggests that high political risk in the host country does not discourage Chinese OFDI[BPJ07; KI12]. In contrast,[KY12]show that Chinese OFDI tends to flow into countries with well-developed institutional environments and good economic
conditions.
Evidence that is more general – beyond Chinese OFDI – indicates that policy uncertainty in
the source country[JB16]and differences in time zones[SE07]discourage OFDI. On the other hand, banking deregulation in the target market[KIT16], foreign ownership by shareholders in the source country[WJ15], and previous investment experience in that market[LJ14], tend to promote OFDI. Finally, local credit conditions in the source country[KIT17], institutional factors in the target economy[D05], and corruption in the source country[JBS09]all influence location choice of cross-border M&A.
Another strand of the literature focuses on the entry mode of Chinese OFDI. The evidence
shows that firms tend to adjust their entry strategies to attain regulative and normative institutional
legitimacy in host countries[CL12]. There is a difference between OFDI driven by state-owned enterprises and that initiated by non state-owned firms. State-owned enterprises are attracted to
countries with abundant natural resources and risky political environments in contrast to non
state-owned firms that more generally seek proximity to markets[RB12].
Finally, much research has been devoted to the factors that affect the performance of M&As.
2.3
Data and Identification Strategy
2.3.1 Data
In our empirical investigation, we employ cross-border M&A data from SDC Platinum and China
Stock Market & Accounting Research Database (CSMAR). Using information from both databases
allows us to compile a more comprehensive data set with fewer missing observations. Additionally,
data on the covariates we employ in our empirical models come from the Centre d’Etudes
Prospec-tives et d’Informations Internationales (CEPII) database. Our sample period starts in 2010 and ends
in 2016, with 2014 being the first year of the Initiative. We denote 2014 as the start of the Initiative as
President Xi’s announcements for the Initiative were in fall of 2013.
Our empirical analysis rests on the comparison of Chinese outbound cross-border M&A
ac-tivity between two groups of countries: the treatment group of countries, which includes
na-tions in the Initiative, and the control group, which includes most other nana-tions. The lists of
countries we include in the treatment group comes from official Chinese government sources
– https://www.yidaiyilu.gov.cn/. The majority of Initiative countries during 2010-2016 have at least one cross-border M&A. As such, the control group includes all other countries that have been the
target of at least one cross-border M&A transaction initiated by Chinese enterprises during the
sample period. We exclude firms from Hong Kong, Macau, and Taiwan (Republic of China) as either
acquirers or targets in those locations have fundamentally different political status as compared to
other sample countries. The list of the countries in the treatment and control groups is presented in
Table 3.1.
We begin our sample in 2010, immediately after the official end of the Great Recession in 2009,
in order to avoid identification concerns driven by the abnormal behavior of cross-border flows
during the global financial crisis. We end our sample in 2016 as a small number of countries joined
the Belt and Road Initiative in 2017. Thus, these countries move from the control group to the
treatment group in 2017. These contemporaneous policy shocks may be endogenous, and they
may affect cross-border M&A by Chinese publicly listed enterprises in the treatment group and the
control group differently. Based on the above considerations, the sample from 2010-2016 includes
Table 2.1List of Treatment Country and Control Country
A. Treatment Country List(Alphabetical Order)
Afghanistan Albania Armenia Azerbaijan Bahrain
Bangladesh Belarus Bhutan Bosnia Brunei
Cambodia Croatia Cyprus Czech Egypt
Estonia Georgia Greece Hungary India
Indonesia Iraq Iran Israel Jordan
Kazakhstan Kenya Kuwait Kyrgyzstan Laos
Latvia Lebanon Lithuania Malaysia Maldives
Macedonia Mongolia Montenegro Moldova Myanmar
Nepal Oman Pakistan Philippines Poland
Qatar Romania Russia Saudi Arabia Syria
Serbia Singapore Slovak Slovenia Sri Lanka
Tajikistan Thailand Turkmenistan Turkey Ukraine
Uzbekistan Utd Arab Em Vietnam Yemen
B. Control Country List(Alphabetical Order)
Angola Argentina Australia Austria Belgium
Botswana Bulgaria Cameroon Canada Chile
Colombia Congo Denmark Djibouti Eritrea
Finland France Gabon Germany Italy
Ireland Japan Luxembourg Madagascar Malta
Mauritius Mexico Netherlands New Zealand Nigeria
Norway Peru Papua New Guinea Portugal Samoa
Sierra Leone South Africa Sonania South Korea Spain
Sweden Switzerland Tanzania Togo Trinidad and Tobago
Tunisia United Kingdom United States Uruguay Venezuela
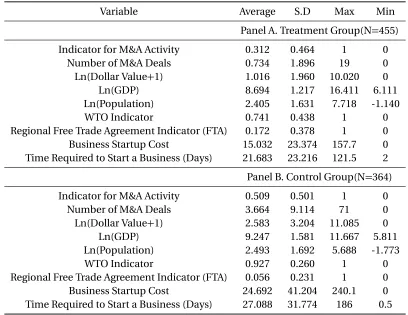
Table 2.2Summary Statistics
Variable Average S.D Max Min
Panel A. Treatment Group(N=455)
Indicator for M&A Activity 0.312 0.464 1 0
Number of M&A Deals 0.734 1.896 19 0
Ln(Dollar Value+1) 1.016 1.960 10.020 0
Ln(GDP) 8.694 1.217 16.411 6.111
Ln(Population) 2.405 1.631 7.718 -1.140
WTO Indicator 0.741 0.438 1 0
Regional Free Trade Agreement Indicator (FTA) 0.172 0.378 1 0
Business Startup Cost 15.032 23.374 157.7 0
Time Required to Start a Business (Days) 21.683 23.216 121.5 2 Panel B. Control Group(N=364)
Indicator for M&A Activity 0.509 0.501 1 0
Number of M&A Deals 3.664 9.114 71 0
Ln(Dollar Value+1) 2.583 3.204 11.085 0
Ln(GDP) 9.247 1.581 11.667 5.811
Ln(Population) 2.493 1.692 5.688 -1.773
WTO Indicator 0.927 0.260 1 0
Regional Free Trade Agreement Indicator (FTA) 0.056 0.231 1 0
Business Startup Cost 24.692 41.204 240.1 0
The summary statistics are presented in Table 3.2. On average, the likelihood of an outbound
cross-border M&A deal in countries included in the Initiative is substantially lower, at 0.312,
com-pared to the likelihood of a deal in the control group of countries at 0.509. Similarly, both the average
number of deals and the average transaction value are lower for countries in the Initiative. The
aver-age GDP in the control group countries is higher than that in the treatment group but the averaver-age
population is quite similar, resulting in a lower income per capita in countries that are included
in the initiative. The treatment countries are also geographically closer to China. Our empirical
specification will incorporate variables that can affect cross-border M&A activity as controls.
2.3.2 Identification Strategy
We start by estimating the impact of the Belt and Road initiative on the likelihood of at least one
Chinese outbound cross-border M&A transaction in the counties included in the initiative. To this
end, we specify a logit model, estimated via maximum likelihood, with a binary dependent variable
that is equal to one if at least one outbound Chinese M&A transaction occurred in target country i
in year t.
P r(Y =1) =f(β1Ti∗Pt+Xi t−1β+λi+γt) (2.1) where Y=1 if there is positive M&A activity in country i and in year t. The main variable of interest on the right-hand side isTi∗Pt, which is an interaction between two indicator variables,TiandPt.
The first,Ti, is equal to one if country i is included in the Belt and Road Initiative, and the second,Pt,
is equal to one, in year 2014 (when the Initiative began), and afterwards. As we discussed earlier, we
also include a vector of control variables that affect cross-border M&A activity and may be correlated
with main variable of interest,Ti∗Pt. The vector of controls includes the natural logarithm of GDP
per capita and population, membership in the World Trade Organization (WTO), membership in
a free trade agreement with China (FTA), as well as measures of the cost and the length of time
required to start a business. We include target country indicator variables to absorb time-invariant
target characteristics and year dummies to control for global macroeconomic shocks that affect all
target countries.
the number of cross-border deals to country i in year t,N u m b e ri t as the dependent variable,
N u m b e ri t=β1Ti∗Pt+Xi t−1β+λi+γt+εi t (2.2) and the second one with the total value (dollar amount) of all cross-border deals in country i
during year t,L o g(V a l u e+1)i t, as the dependent variable.
L o g(V a l u e+1)i t =β1Ti∗Pt+Xi t−1β+λi+γt+εi t (2.3)
We do not use the natural logarithm of the number of transactions in Eq. 2.2 because in some
years, some target countries have no cross-border M&A deals originating from China. For the same
reason, we add one to the total value of transactions before taking the natural log in Eq. 2.3. Both
of these models are estimated as (target country) fixed effects panel data models (including both
target country and year fixed effects), via OLS, using the same set of controls as in Eq. 2.1 above. In a
series of robustness checks, we also use a linear probability model instead of the logistic regression
for Eq. 2.1 above, and a Poisson (Pseudo Maximum Likelihood, PPML) model, typically used for
count data models and estimated via maximum likelihood, instead of the linear fixed effects models
like Eq. 2.2 and Eq. 2.3. We compute robust standard errors that are clustered by target country.
2.4
Empirical Results
2.4.1 Baseline Regression
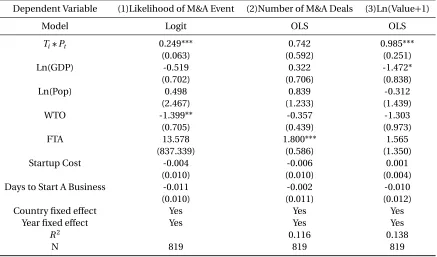
In Table 3.3, we start by presenting the estimates of the impact of the Belt and Road Initiative
on the probability and the number of cross-border M&A deals completed by Chinese enterprises.
In column (1), we report the estimate of the impact of the Initiative on the likelihood of a Chinese
outbound cross-border M&A deal. The estimated coefficient on the interaction term,Ti∗Pt, implies
that after the Initiative began in 2014, target countries included in the initiative experienced about 25
percentage point higher likelihood of a Chinese M&A deal. While most of the control variables have
the expected signs, all but one are statistically insignificantly different from zero. The exception is the
with cross-border M&A activity. The literature has documented that the WTO has a positive effect
on cross-border trade, which it is designed to facilitate. Because trade and foreign direct investment,
such as cross-border M&A activity, could be substitutes, it is not surprising that membership in the
WTO would promote trade at the expense of cross-border M&A.
Table 2.3Baseline Regression
Standard errors clustered by country pair are reported in parentheses. Column (1) reports the marginal effects from the Logit regression. ***,**,* denote statistical significance at the 1%, 5% and 10% level.
Dependent Variable (1)Likelihood of M&A Event (2)Number of M&A Deals (3)Ln(Value+1)
Model Logit OLS OLS
Ti∗Pt 0.249*** 0.742 0.985***
(0.063) (0.592) (0.251)
Ln(GDP) -0.519 0.322 -1.472*
(0.702) (0.706) (0.838)
Ln(Pop) 0.498 0.839 -0.312
(2.467) (1.233) (1.439)
WTO -1.399** -0.357 -1.303
(0.705) (0.439) (0.973)
FTA 13.578 1.800*** 1.565
(837.339) (0.586) (1.350)
Startup Cost -0.004 -0.006 0.001
(0.010) (0.010) (0.004)
Days to Start A Business -0.011 -0.002 -0.010
(0.010) (0.011) (0.012)
Country fixed effect Yes Yes Yes
Year fixed effect Yes Yes Yes
R2 0.116 0.138
N 819 819 819
We continue our empirical analysis in column (2), which reports the effects of the Initiative on
the number of outbound cross-border M&A deals. While imprecisely estimated, the effect is positive
and it suggests that following the Initiative, countries included in it, experienced an increase of about
0.74 M&A deals. Our estimate suggests that the Initiative effectively doubled that number, given that
the average number of deals annually in these countries during our sample period was about 0.73.
The last column of Table 3 presents the impact of the Initiative on the total volume (dollar value) of
cross-border M&A activity flowing into the target countries. Because some countries experience no
the total volume of M&A deals channeled into Belt and Road countries effectively doubles, as well.
2.4.2 Sub-sample Regression
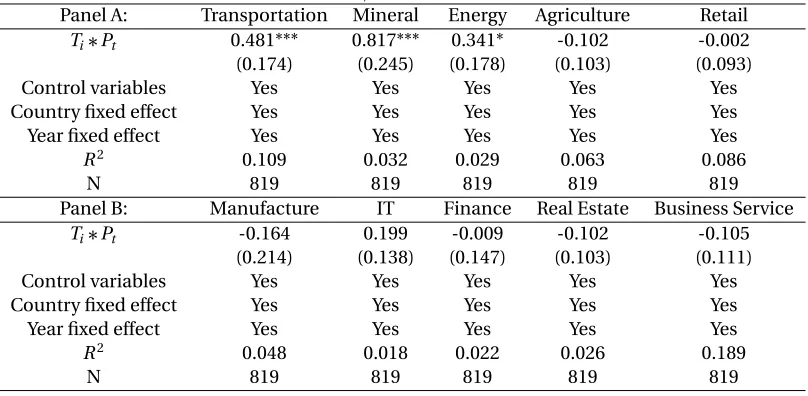
Table 2.4The Impact of B&R Initiative on Number of Cross-border M&A Deals in Different Industries
Standard errors clustered by country pair are reported in parentheses. ***,**,* denote statistical significance at the 1%, 5% and 10% level.
Panel A: Transportation Mineral Energy Agriculture Retail
Ti∗Pt 0.218*** 0.637* 0.103* -0.006 -0.059
(0.063) (0.364) (0.056) (0.043) (0.051)
Control variables Yes Yes Yes Yes Yes
Country fixed effect Yes Yes Yes Yes Yes
Year fixed effect Yes Yes Yes Yes Yes
R2 0.124 0.115 0.052 0.052 0.037
N 819 819 819 819 819
Panel B: Manufacture IT Finance Real Estate Business Service
Ti∗Pt -0.049 0.041 0.095 -0.005 0.038
(0.232) (0.056) (0.118) (0.007) (0.062)
Control variables Yes Yes Yes Yes Yes
Country fixed effect Yes Yes Yes Yes Yes
Year fixed effect Yes Yes Yes Yes Yes
R2 0.031 0.103 0.022 0.010 0.206
N 819 819 819 819 819
Our analysis continues in Table 3.4 and Table 3.5, where we investigate the heterogeneity of
the impact of the initiative by industry. We report models for the number of deals in Table 3.4 and
the total volume in terms of transaction amounts in Table 3.5 and discuss these tables together.
We find that the impact is positive in the Transportation, Mining, and Energy industries, in which
the Belt and Road countries experienced an increase in cross-border M&A activity following the
Initiative. This is true for both the number (Table 3.4) and the total volume (Table 3.5) of cross-border
M&A deals. The results indicate that the remaining industries (Agriculture, Retail, Manufacturing,
Information Technology (IT), Finance, Real Estate, and Business Services) have not seen a positive
effect on cross-border M&A activity stemming from the Initiative by the end of our sample period in
2016. These results are consistent with the stated goals of the Initiative.
In Table 3.6, we estimate the impact of the Initiative on outbound cross-border M&A deals
initiated by Chinese state-owned enterprises as compared to those initiated by non state-owned
Table 2.5The Impact of B&R Initiative on Dollar Value of Cross-border M&A Activity in Different Industries
Standard errors clustered by country pair are reported in parentheses. ***,**,* denote statistical significance at the 1%, 5% and 10% level.
Panel A: Transportation Mineral Energy Agriculture Retail
Ti∗Pt 0.481*** 0.817*** 0.341* -0.102 -0.002
(0.174) (0.245) (0.178) (0.103) (0.093)
Control variables Yes Yes Yes Yes Yes
Country fixed effect Yes Yes Yes Yes Yes
Year fixed effect Yes Yes Yes Yes Yes
R2 0.109 0.032 0.029 0.063 0.086
N 819 819 819 819 819
Panel B: Manufacture IT Finance Real Estate Business Service
Ti∗Pt -0.164 0.199 -0.009 -0.102 -0.105
(0.214) (0.138) (0.147) (0.103) (0.111)
Control variables Yes Yes Yes Yes Yes
Country fixed effect Yes Yes Yes Yes Yes
Year fixed effect Yes Yes Yes Yes Yes
R2 0.048 0.018 0.022 0.026 0.189
N 819 819 819 819 819
Table 2.6The Impact of B&R Initiative on State-owned Enterprises compared to Private Enterprises
Standard errors clustered by country pair are reported in parentheses. ***,**,* denote statistical significance at the 1%, 5% and 10% level.
State-owned Non State-owned
Dependent Variable (1)Number (2)Ln(Value+1) (3)Number (4)Ln(Value+1)
M&A Deals M&A Deals
Ti∗Pt 0.825*** 0.879*** -0.119 0.069
(0.362) (0.259) (0.424) (0.208)
Control variables Yes Yes Yes Yes
Country fixed effect Yes Yes Yes Yes
Year fixed effect Yes Yes Yes Yes
R2 0.171 0.167 0.048 0.058
uncovered in our baseline Table 3.3 are entirely driven by M&A deals initiated by state-owned
enterprises. While the Initiative increased both the number and the total volume of M&A deals
initiated by state-owned enterprises (columns (1) and (2) of Table 3.6), it did not have an impact
on Chinese non state-owned firm’s M&A activity (columns (3) and (4) of Table 3.6). This finding
may shed some light on one of the mechanisms that drive the positive effects of the Initiative on
Chinese outbound cross-border M&A activity. One reason for this positive impact could be easier
access to cheaper (subsidized) credit for state-owned enterprises compared to non state-owned
firms following the government-led Initiative.
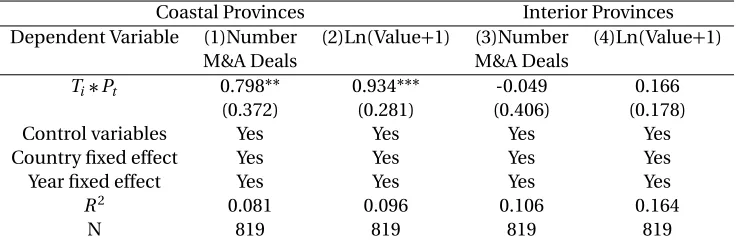
Table 2.7The Impact of B&R Initiative in Coastal Provinces compared to Interior Provinces
Standard errors clustered by country pair are reported in parentheses. ***,**,* denote statistical significance at the 1%, 5% and 10% level.
Coastal Provinces Interior Provinces
Dependent Variable (1)Number (2)Ln(Value+1) (3)Number (4)Ln(Value+1)
M&A Deals M&A Deals
Ti∗Pt 0.798** 0.934*** -0.049 0.166
(0.372) (0.281) (0.406) (0.178)
Control variables Yes Yes Yes Yes
Country fixed effect Yes Yes Yes Yes
Year fixed effect Yes Yes Yes Yes
R2 0.081 0.096 0.106 0.164
In Table 3.7, we examine the impact of the Initiative on Chinese firms headquartered in coastal
provinces, which are near navigable water, large population centers, and production facilities,
relative to firms in the interior provinces. One of the stated goals of the Initiative is to enhance
development in the interior of the country by facilitating trade via the new Silk Road. However, it
is likely that firms would better internalize the benefits of cross-border M&A activity spurred by
the Initiative if they already have developed organizational capabilities in place, prior to the policy.
These capabilities to grow through M&A are needed because of the complexities of international
transactions and the need to manage new assets in foreign countries. Firms in the more economically
developed and internationally connected coastal provinces are arguably more likely to have such
capabilities. The empirical evidence suggests that during the early period of the initiative, firms
headquartered in interior provinces did not increase their cross-border M&A activity. In contrast,
firms headquartered in the coastal provinces experienced a significant growth in the volume and
frequency of M&A transactions in Initiative countries following 2013. The evidence suggests that
firms in the interior provinces may not have been initially prepared to take advantage of the Initiative
through the M&A channel.
2.4.3 Robustness Tests
In Table 3.8, we perform a number of robustness checks. In columns (1) and (2), we re-estimate
the impact of the Initiative on the likelihood of cross-border M&A activity using a linear probability
model and a Probit specification instead of the Logit model we employed in column (1) of 3.3.
The results are very similar to those in our baseline specification. In columns (3) and (4) of 3.8,
we re-estimate the regression equations for the number of cross-border deals and the volume
of M&A transactions using a Poisson model. The estimates of the impact of the initiative on the
number of transactions appear fragile: the impact is estimated to be close to zero and it is statistically
insignificant, while the effect on the volume of M&A transactions is still positive and quite robust.
In Table 3.9, we perform a number of falsification tests, where we reclassify the start of the
Initiative to begin in 2011, 2012, or 2013, instead of 2014, when it actually started. If pre-trends
exist, and they cause our identification strategy to erroneously attribute an increase in cross-border
M&A activity to the discrete change in the policy environment with the arrival of the Initiative
the reclassified interaction termTi∗Pt is still positive and statistically significant, that can signal
spurious results caused by pre-existing trends.
Table 3.9 shows that results from the different falsification test we perform. While almost all
coefficients are positive, they are all economically small in magnitude, and none of the them are
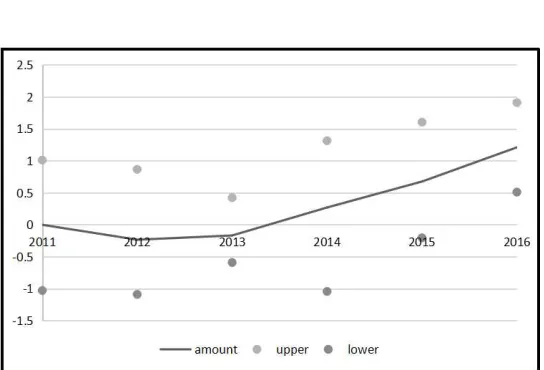
statistically significantly different from zero. Fig. 2.1 and Fig. 2.2 show the comparison of difference
in number and transaction value of cross-border M&A between the treatment country and control
country. These results provide some assurance that the results showing the impact of the Initiative
are not driven by pre-existing trends in cross-border M&A activity.
Up to this point, we have provided evidence that the Initiative was followed by an increase in
M&A activity by Chinese firms in Initiative countries. We find that the Initiative was more important
for firms in certain industries, government ownership, and geographic location. The channel for
how the Initiative spurred such M&A activity is likely unobservable. One possibility is that the call to
action from the President of China has been met by a patriotic response or perhaps by
behind-the-Table 2.8The Impact of B&R Initiative, Alternative Specifications
Standard errors clustered by country pair are reported in parentheses. Column (2) reports the marginal effects from the Probit regression. ***,**,* denote statistical significance at the 1%, 5% and 10% level.
Dependent Variable (1)Likelihood (2)Likelihood (3)Number (4)Value M&A Event M&A Event M&A Deals
Method OLS Probit Poisson Poisson
Ti∗Pt 0.237*** 0.231*** 0.001 1.699***
(0.057) (0.278) (0.478)
Control variables Yes Yes Yes Yes
Country fixed effect Yes Yes Yes Yes
Year fixed effect Yes Yes Yes Yes
R2 0.032
N 819 819 819 819
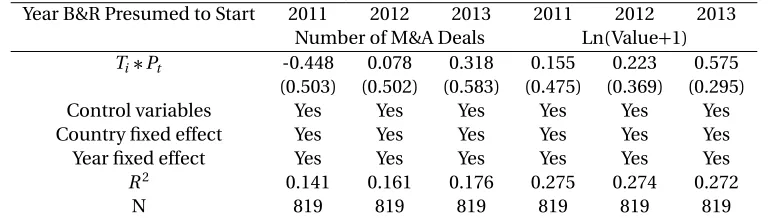
Table 2.9Falsification Tests
Standard errors clustered by country pair are reported in parentheses. ***,**,* denote statistical significance at the 1%, 5% and 10% level.
Year B&R Presumed to Start 2011 2012 2013 2011 2012 2013 Number of M&A Deals Ln(Value+1)
Ti∗Pt -0.448 0.078 0.318 0.155 0.223 0.575
(0.503) (0.502) (0.583) (0.475) (0.369) (0.295)
Control variables Yes Yes Yes Yes Yes Yes
Country fixed effect Yes Yes Yes Yes Yes Yes
Year fixed effect Yes Yes Yes Yes Yes Yes
R2 0.141 0.161 0.176 0.275 0.274 0.272
Figure 2.1The Difference in the Number of Cross-border M&As in Treatment Countries and Control Coun-tries with 95% confidence interval
scenes pressure. Another non-mutually exclusive explanation is that there are economic incentives
such as greater access to capital on generous terms, other subsidies, or preferential treatment.
To shed some further light on the firm’s incentives, we examine the valuation impact on the
acquiring firm associated with these deals. In Table 3.10, we present the estimates of the impact of
the Belt and Road Initiative on the acquirer’s Cumulative Abnormal Announcement Return (CAAR).
In this event study, we include deals using the following selection criteria: (1) the announcement
data of the cross-border M&A deal is after January 1st, 2010; (2) the transaction amount of the deal is
greater than 1 million US dollars (following previous work by[MSB04]and[NJ11]); (3) the acquirer is listed on the Chinese A stock market;1and (4) the M&A deals with missing data are excluded. Based on the criteria above, we are left with 385 cross-border M&A deals from 2010 to 2016 for purposes
of our event study. We compute CAARs using market-adjusted returns employing three, five, and
seven day windows centered on the announcement date. We use market-adjusted returns following
previous work by[FJPH07; C07; HDA16].
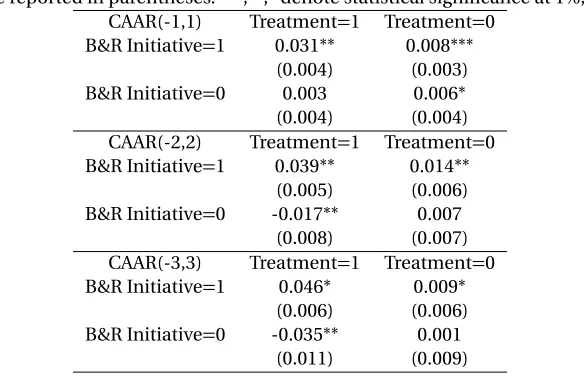
Table 2.10Summary Statistics, Cumulative Abnormal Announcement Returns
Standard errors are reported in parentheses. ***,**,* denote statistical significance at 1%, 5% and 10% level. CAAR(-1,1) Treatment=1 Treatment=0
B&R Initiative=1 0.031** 0.008*** (0.004) (0.003) B&R Initiative=0 0.003 0.006* (0.004) (0.004) CAAR(-2,2) Treatment=1 Treatment=0 B&R Initiative=1 0.039** 0.014**
(0.005) (0.006) B&R Initiative=0 -0.017** 0.007
(0.008) (0.007) CAAR(-3,3) Treatment=1 Treatment=0 B&R Initiative=1 0.046* 0.009*
(0.006) (0.006) B&R Initiative=0 -0.035** 0.001
(0.011) (0.009)
The evidence in Table 3.10 suggests that the acquirer’s CAAR for firms in the control group does
not change much after the Initiative was put in place. On the other hand, acquirers in the treatment
range. The abnormal returns for the treated group prior to the Initiative and for the control group
before and after the Initiative are near zero, consistent with the stylized results in the M&A literature.
Additionally, we estimate a difference-in-differences model (via OLS) similar to that in equation
(2) using the same set of deals that meet the selection criterion above. The dependent variable, CAAR,
is regressed on the following control variables for the acquirer: (the natural log of ) the total assets,
the debt ratio, the book-to-market ratio, the fraction of independent directors, an index measuring
the separation between ownership and management, and finally the ratio of free cash-to-assets.
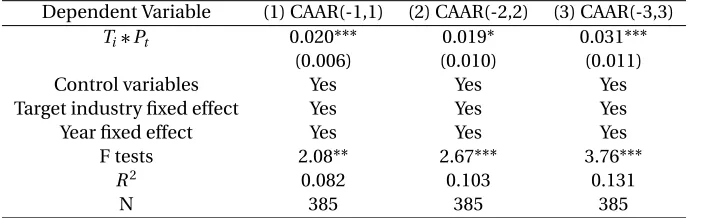
We further include target industry fixed effects and year effects. The estimates presented in Table
2.11, indicate that following the adoption of the Belt and Road Initiative, the cumulative abnormal
announcement return is higher. These results suggest that economic incentives are part of the
Initiative rather than firms simply following moral suasion from the government.
Table 2.11The Impact of B&R Initiative on Cumulative Abnormal Announcement Returns
Standard errors are reported in parentheses. OLS regressions in all columns. ***,**,* denote statistical significance at the 1%, 5% and 10% level.
Dependent Variable (1) CAAR(-1,1) (2) CAAR(-2,2) (3) CAAR(-3,3)
Ti∗Pt 0.020*** 0.019* 0.031***
(0.006) (0.010) (0.011)
Control variables Yes Yes Yes
Target industry fixed effect Yes Yes Yes
Year fixed effect Yes Yes Yes
F tests 2.08** 2.67*** 3.76***
R2 0.082 0.103 0.131
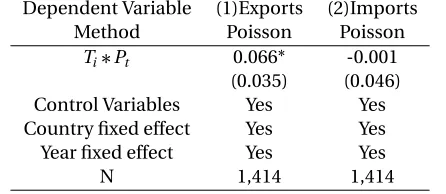
Before we conclude, we also investigate the impact of the Initiative on Chinese cross-border
trade. The results, which are presented in Table 3.12, indicate that the Initiative likely increased
exports to Belt and Road countries by about 6.6%, but it did not change imports from these trading
partners. If the Initiative aimed at increasing foreign subsidiaries in transportation, mining, and
the energy industries with the intention of increasing such imports, it may take time following the
implementation of the Initiative before this happens. For example, improvements in infrastructure
(building and improvements of roads and ports) will have to be completed first, before imports start
flowing. Hence, our short sample period may prevent us from detecting growth in imports following
the Initiative. The small, but positive impact of the initiative on Chinese exports is consistent with
some of the existing literature on the complementarity of exports and FDI[LRE84; H91; RR10].
Table 2.12The Impact of B&R Initiative on Trade Volume
Standard errors are reported in parentheses.* denote statistical significance at 10% level. Dependent Variable (1)Exports (2)Imports
Method Poisson Poisson
Ti∗Pt 0.066* -0.001
(0.035) (0.046)
Control Variables Yes Yes
Country fixed effect Yes Yes
Year fixed effect Yes Yes
2.5
Conclusion
In this paper, we evaluate the impact of the Belt and Road Initiative championed by the Chinese
President Xi Jinping on outbound cross-border M&A deals initiated by Chinese enterprises. In our
empirical work, we use transaction level M&A data from 2010 to 2016 to evaluate the impact of the
Initiative on the incidence and the number of transactions, as well as the total volume of M&A activity.
Our estimates suggest that the likelihood of outbound M&A deals rose by about 25 percentage points
following the Belt and Road Initiative. Further, total volume of M&A deals flowing into target Belt and
Road countries almost doubled reaching 6.3 billion US dollar by 2016, three years after the Initiative
began. We find that the impacts are driven by M&A transactions initiated by Chinese state-owned
enterprises that appear to have positive economic incentives for doing so, perhaps through easier
access to cheaper credit following the Initiative compared to non state-owned companies. Finally,
our empirical results imply that the Initiative has had the highest positive impact on outbound
cross-border M&A activity for targets in the transportation, mining, and energy industries, which is
CHAPTER
3
DIRECT FLIGHTS AND CROSS-BORDER
M&A
3.1
Introduction
A growing literature has provided consistent evidence that investors prefer more proximate
invest-ments where distance is viewed in the context of travel time. Examples include portfolio investinvest-ments [EJA19], venture capital[BS16]and internal capital market budgeting[X13]. The implication of this evidence suggests that human interaction matters, and electronic connections are not a complete
substitute for in person meetings when making capital allocation decisions. The advantage of
face-to-face interactions could come from better ex ante information acquisition as well as ex post
monitoring. Further, another related literature provides evidence that greater proximity can improve
economic growth. Prior studies provide evidence for a causal link between improved travel access,
such as improved flight connections and better rail access, and economic growth.1
1Most notably,[CFR18]show that increased air connections are related to satellite-measured night-lights.[K03]and
We extend these lines of inquiry by investigating another economically important channel
where improved connections can plausibly have a positive and economically meaningful effect. We
examine non-stop direct flight introductions and their relation to cross-border M&As. A non-stop
direct flight not only decreases travel time between two markets, but also reduces travel uncertainty
associated with a connecting flight. Adding more flights to an itinerary increases the likelihood of
delays, cancellations, and lost luggage. Therefore, the decline in time spent in transit for a traveler is
just one of the savings generated by the introduction of a direct flight.
Cross-border M&As have characteristics where decreased travel times could have large economic
effects. Prior work has found that flight introductions are important in security selection for portfolio
managers[EJA19]and for capital allocations within internal capital markets[X13]. The selection of any one stock in a well-diversified portfolio will only have a modest impact on the overall risk-return
characteristics of that portfolio. Yet,[EJA19]find that flight introductions affect stock selections suggesting that the relative cost of information acquisition matters. Likewise,[X13]finds that budget allocations in internal capital markets are also influenced by flight introductions, presumably
through lowered cost of acquiring information. M&A is less likely to be a part of a well-diversified
portfolio for the acquirer, at least from the point of view of the firm, increasing downside risks
associated with making a bad investment. Further, a target firm has much greater information
asymmetry as compared to a division that is already part of the enterprise. Greater proximity
that results in shorter travel time lowers transaction costs associated with both the acquisition of
information and as well as ex post monitoring. As such, we predict that flight introductions will be
particularly important for cross-border M&A given that these prior studies have found economically
important effects in settings that either have less downside risk or have less information asymmetry.
Our setting is M&A activity between China and the U.S. using flight introductions as our
treat-ment for proximity. China and the U.S. provide us with an interesting laboratory for this study due to
several favorable characteristics. First, in the last twenty years, China and the U.S. have experienced
greatly increased cross-border economic activity. Second, the opening of Artic routes to better
connect the eastern and central U.S. with China.2Finally, China has built up enormous foreign reserves due to their twin surpluses (from 2001 to 2014) in the current and capital accounts. These
papers that show increased rail connections dating to the 19th century were associated with increased asset prices and economic growth such as in[DD16]and[D18].
reserves have provided a war chest for outbound investment.
We use data on cross-border M&A, both for Chinese and U.S. targets and sources, between
2003 and 2016. In our main empirical specification, we use the introduction of direct flights as the
treatment variable to investigate its effects on cross-border M&A activity between pairs of Chinese
and U.S. cities. We evaluate the impact of direct flights on the number and the total volume of
cross-border M&A transactions. We find that the introduction of a direct flight between cities in
China and the U.S. significantly increases the probability of cross-border M&A activity between the
pair of cities connected by the flight. Further, the introduction of a direct flight raises the number of
cross-border M&A deals between the pair of cities by 1 transaction annually, and it increases the total
volume of M&A transactions by about $12.6 million annually. While there were only 5 cross-border
M&A transactions between China and the U.S. in 2003 at the start of our sample period (see Figure
A.1), there were 55 M&A deals completed in 2016, the last year in the sample. Given our estimate of
an additional cross-border transaction (between a pair of cities) for every new non-stop direct flight
introduced, the 30 new direct flights introduced between 2003 and 2016 (see Appendix Table A.1),
can account for 60 percent of the actual increase of 50 transactions (30 out of 50 transactions) in
that time period.
We further examine this finding to investigate the direction of causality. It is possible that
anticipated increase in economic activity between two locations is an impetus for adding a direct
flight. Thus, the observed increase in M&A activity may not be the result of the flight addition, rather
the causality runs in the other direction. We utilize an identification strategy previously used by[X13] in the context of domestic U.S. manufacturing plant-level investment in order to better determine
the direction of causality. Specifically, we estimate the effect of a direct flight on cross-border M&A
activity between U.S. and Chinese cities that are not directly connected by it, but experience a
decline in travel time associated with the flight introduction. For example, Phoenix and Wuhan
do not have a direct flight connecting them. However, a direct flight between San Francisco and
Wuhan, which began service in 2013, improved travel between the two cities through an improved
connection. The introduction of the flight between San Francisco and Wuhan is unlikely to be related
to increased economic ties between Phoenix and Wuhan. Thus, these indirect improvements in
travel allow us to more confidently identify the causal impact in our empirical setting given that our
Our results using this identification strategy indicate that the decline in flight time brings about
a greater likelihood of cross-border M&A activity and a larger number of deals. The impact of
reduced travel time on cross-border M&A due to indirect flight introductions are economically
and statistically significant, but as expected, the impact is smaller in magnitude compared to the
effects on cities that are directly connected. The evidence suggests that greater proximity and lower
transaction costs have a positive, causal impact on cross-border M&A activity between China and
the U.S.
We include two additional robustness tests in order to further assure a causal interpretation of
our results. First, we estimate lead and lag effects, and find no evidence of reverse causality. Second,
we conduct a placebo test by randomly, reassigning flights to different locations in order to detect
an omitted variables bias. The placebo test fails to provide any evidence of endogeneity driven by
omitted variables.
We continue our analysis by investigating the firm level economic impacts of the deals. We
document that the introduction of a direct flight is associated with a lower premium paid by acquirers,
in both directions. Further, the evidence indicates that these deals are valuable to shareholders rather
than simply facilitating agency spending. We estimate that for publicly traded firms, acquisitions
following direct flight introductions experience abnormal announcement returns, an economically
important 2.3 percent greater return relative to those of acquirers that buy targets in cities without
a direct flight. Taken together, the evidence suggests that improved flight connections increase
valuable M&A activity.
Cross-border M&A is an important method for foreign direct investment (FDI), and FDI can be
an important channel for economic growth. M&A allows for investment in a new market in a less
risky manner compared to green field investment. Our conjecture is that lower cost of acquiring
information and monitoring due to reduction in travel time facilitates new investment, particularly
so for markets where travel is time consuming. Our evidence suggests M&A is a channel for economic
growth associated with improved air links as shown by[CFR18].
Our findings are related to the literature on transportation infrastructure and trade cost.[Pap19] investigates the impact of the opening of Soviet airspace allowing direct Europe to Asia flights. His