INVESTIGATION
Large-Scale Mapping of Transposable Element
Insertion Sites Using Digital Encoding of
Sample Identity
Daryl M. Gohl,*,1Limor Freifeld,†,‡,1Marion Silies,* Jennifer J. Hwa,* Mark Horowitz,†
and Thomas R. Clandinin*,2 *Department of Neurobiology and†Electrical Engineering, Stanford University, Stanford, California 94305, and‡Department of Electrical Engineering and Computer Science, Massachusetts Institute of Technology, Cambridge, Massachusetts 02139
ABSTRACT Determining the genomic locations of transposable elements is a common experimental goal. When mapping large collections of transposon insertions, individualized amplification and sequencing is both time consuming and costly. We describe an approach in which large numbers of insertion lines can be simultaneously mapped in a single DNA sequencing reaction by using digital error-correcting codes to encode line identity in a unique set of barcoded pools.
N
EXT-generation sequencing (NGS) technologies have greatly reduced the cost of DNA sequence analysis through the parallel sequencing of many short fragments. However, many applications, including molecular cloning and mutational analysis continue to rely on conventional capillary electropho-resis Sanger sequencing methods, as these are well-suited to sequencing individual fragments. Thus, one challenge in using NGS technologies in such applications lies in preserving sam-ple identity while sequencing many samsam-ples simultaneously. This challenge can be addressed by encoding sample identity through either DNA barcoding or directed pooling (Mazurkiewicz et al.2006; Erlichet al.2009; Goodmanet al.2009; Prabhu and Pe’er 2009).Transposable elements represent powerful tools for manip-ulating the genomes of many model organisms (Bellenet al. 2011; Bire and Rouleux-Bonnin 2012). Thus, determining the genomic location of transposon insertion sites is a common experimental goal. Several methods, such as inverse PCR and splinkerette PCR, are used to amplify a short fragment of the genome directly adjacent to an insertion (Ochmanet al.1988;
Devon et al. 1995). Subsequently, capillary electrophoresis Sanger sequencing is used to sequence each amplicon. As a result, all processing reactions must be performed indepen-dently on each sample, making the cost and labor associated with mapping collections of thousands of insertion lines sig-nificant. Several techniques have used NGS to map trans-posons in large populations of bacteria or yeast (Goodman et al.2009; Urenet al.2009; Iskowet al.2010; Febreret al. 2011). However, most of these approaches do not allow the insertion site to be associated with the identity of the original sample.
While DNA barcoding can be used to encode sample identity prior to NGS, adding the barcode requires either individualized molecular manipulation of each sample or prior construction of a sequence-tagged transposon library (Mazurkiewicz et al. 2006; Hamadyet al.2008). As an alternative, pooling strate-gies can be used to encode sample identity, and several recent studies have reported strategies for efficient, error-resistant encoding in pooled DNA samples (Erlichet al.2009; Goodman et al. 2009; Prabhu and Pe’er 2009). However, none of these approaches have been applied to the large genomes of mul-ticellular eukaryotes, which present unique challenges due to repetitive sequences, increased sequence complexity, and an 100- to 1000-fold reduction in the ratio of transposon sequence to genome sequence.
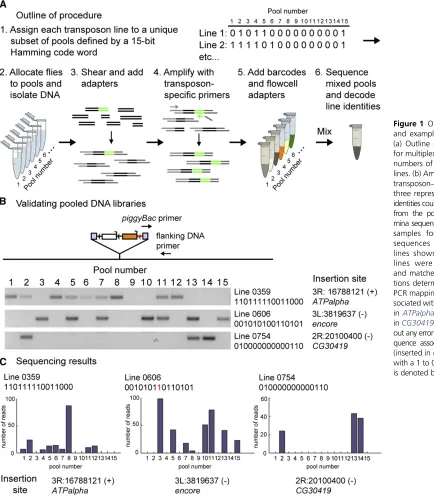
We have developed a method for mapping transposons in multicellular eukaryotes that allows large numbers of transposon inserts to be mapped in a single NGS reaction (Figure 1A). This Copyright © 2014 by the Genetics Society of America
doi: 10.1534/genetics.113.159483
Manuscript received November 8, 2013; accepted for publication December 21, 2013; published Early Online December 27, 2013.
Supporting information is available online athttp://www.genetics.org/lookup/suppl/ doi:10.1534/genetics.113.159483/-/DC1.
1These authors contributed equally to this work.
2Corresponding author: Department of Neurobiology, Stanford University, 299 West
method makes use of a pooling strategy that encodes sample identity using error-correcting Hamming codes (Hamming 1950). Hamming codes make use of a small number of addi-tional bits of information, so-called parity bits, to detect and correct errors. The error detecting and correcting capacity of Hamming codes and other error-correction codes, such as the Golay code (Golay 1949), depend upon the Hamming dis-tance between code words (messages), a reflection of the number of parity bits used. The Hamming distance is defined as the number of changes in a binary sequence that would be necessary to change one code word into another code word. As such, if an estimate of the expected error rate in a pooled mapping experiment can be made, an error correcting code with sufficient detection and correction capabilities can be matched to this expected noise. The method we describe further enables the incorporation of additional error-correcting steps and associates a quantitative measure of confidence with each decoding. This strategy greatly reduces the cost asso-ciated with mapping libraries of insertions compared to the widely used conventional methods.
Materials and Methods
Hamming encoding of sample identity
A collection of 1065piggyBactransposon insertion lines was generated as previously described (Gohl et al. 2011; Silies et al. 2013). Of these, 126 lines were inserted on the 1st chromosome, 351 lines were inserted on the 2nd chromosome, 584 lines were inserted on the 3rd chromosome, and 4 lines were inserted on the 4th chromosome. Since the insertion chromosome was known for each line, codes were selected for each of these populations independently (allowing the use of the same code words for lines in which the insertions were on different chromosomes). To encode at least 584 lines, a minimum of 10 data bits are required. For each line with an insertion in a particular chromosome, we assigned a unique 11-bit binary identification (ID) number. Since line numbers require no more than 10-bit encoding, parity bits were in-cluded in these IDs. The ID numbers were then encoded as 15-bit Hamming code words. This encoding guarantees a minimal Hamming distance of at least 3 bits between code words and thus enables correcting single bit errors (if a single bit error occurs, there is only one valid code word at a Hamming distance of 1 from the error-containing 15-bit sequence). All code for encoding and decoding and subsequently described analysis was written in Matlab (Mathworks, Natick, MA).
A singlefly was allocated to the specified subset of the 15 pools for each line. DNA was isolated from each pool by grinding theflies in 2.75 ml of lysis buffer (0.1 M Tris pH 8.0, 0.4 M NaCl, 25 mM EDTA, 1% SDS) on ice, adding 2.75 ml of Tris-buffered phenol (Invitrogen, Carlsbad, CA), and then extracting three times with 2 ml of 25:24:1 phenol:chloroform: isoamyl alcohol (IAA) (Invitrogen). The resulting sample was extracted once with 2 ml of chloroform (EM Science, Gibbstown, NJ) and 1.2 ml of the aqueous phase was precipitated
with 4 ml of.99.5% ethanol (Sigma-Aldrich, St. Louis) and placed in the freezer for 30 min. The sample was then centri-fuged for 10 min at 13,200 relative centrifugal force and the resulting pellet was washed twice with 0.5 ml of 70% ethanol and allowed to air dry for 10 min. The pellet was resuspended in 1 ml of distilled water (dH2O).
Library preparation and validation
A total of 200 ng of each of the 15 pooled DNA samples was sheared to an average size of 200 bp using a Covaris S2 ultrasonicator (Covaris, Woburn, MA). Shearing was con-firmed using an Agilent Bioanalyzer High-Sensitivity chip (Agilent, Santa Clara, CA). The sheared DNA was end repaired and Illumina-compatible adapters were added following the protocol described by Meyer and Kircher (2010). A total of 50ml (50–150 ng) of sheared DNA was incubated together with 7 ml T4 ligase buffer [New England Biolabs (NEB), Ipswich, MA], 0.28 ml 25 mM dNTP mix (Invitrogen), 0.7ml 100 mM dATP (Invitrogen), 3.5ml T4 polynucleotide kinase (NEB), 1.4 ml T4 DNA polymerase (NEB), and 7.12 ml dH2O for 15 min at 25°, followed by 5 min at 12°.
End-repaired DNA was purified using 1.83 Agencourt AMPure XP beads (Beckman-Coulter, Danvers, MA) and resuspended in 20 ml elution buffer (EB) (10 mM Tris-Cl, pH 8.0; Qiagen, Valencia, CA). Next, adapters were prepared as follows: 40ml of 500mM IS1_adapter.P5 and IS3_adapter. P5+P7 oligos and IS2_adapter.P7 and IS3_adapter.P5+P7 oligos (Supporting Information,Table S1), and annealed in a 100-ml reaction with 10ml of 103hybridization buffer (500 mM NaCl, 10 mM Tris-Cl, pH 8.0, 1 mM EDTA, pH 8.0), by heating to 95°and ramping to 12°at 0.1°/sec in a thermal cycler. The annealed adapters were mixed together and 1ml of adapter mix was added to 20 ml of end-repaired DNA, together with 4 ml T4 ligase buffer, 1 ml T4 DNA ligase (NEB), and 14 ml dH2O and incubated at 22°for 30 min.
Adapter-ligated DNA was purified using 1.83 Agencourt AMPure XP beads and resuspended in 20ml EB. Next, adapt-ers were filled in by incubating 20 ml of purified, adapter-ligated DNA with 4ml Thermopol reaction buffer (NEB), 0.4ml 25 mM dNTP mix, 1.5ml Bst large fragment DNA polymerase (NEB), and 14.1ml dH2O at 37°for 20 min. The resulting DNA
was purified using 1.83 Agencourt AMPure XP beads and resuspended in 20ml EB.
Transposon enrichment and DNA sequencing
To amplifypiggyBactransposon sequences from the pooled libraries, primers were designed that had homology to the 59 or 39ends of thepiggyBactransposon and also contained the p7 end Illumina adapter sequence (pBac5_sr_adapt and pBac3_sr_adapt; Table S1). The 59 and 39 transposon ends were separately amplified from each of the 15 pools for 25 cycles using Phusion polymerase (Thermo Scientific, Wilming-ton, DE) with either the pBac5_sr_adapt or pBac3_sr_adapt primer and the IS4_indPCR.P5 primer. To minimize amplifi -cation artifacts, two independent PCR reactions were set up for each sample and pooled prior to purification using the MinElute PCR purification kit (Qiagen). Samples were
The amount of enrichment of transposon sequences relative to genomic loci was determined by comparing amplification with a primer set specific to thepiggyBac59end (PB59qPCR for-ward/PB59 qPCR reverse) and a primer set specific to the
apterous gene (ap qPCR forward/ap qPCR reverse). A total
of 30ml of this mixed sample was purified using 1.83 Agen-court AMPure XP beads to remove primers and the concentra-tion of this sample was measured using an Agilent Bioanalyzer High-Sensitivity chip. The resulting sample was sequenced to generate paired-end 150-bp reads using a MiSeq Benchtop sequencer (Illumina, San Diego).
Data analysis
The process by which insertion positions were assigned can be divided into two parts: first, reads were processed and mapped to chromosomes; second, read positions were assem-bled into codes and associated with the corresponding line.
Preprocessing of sequenced reads and mapping to the Drosophila genome
First, sequence reads with many undetermined base pairs were edited to remove the portion that failed to sequence. Next, sequences werefiltered by whether they contained the transposon sequences associated with the 59 and 39 ends using Matlab’s built-in implementation of Barton’s local alignment algorithm (Barton 1993). The transposon refer-ence sequrefer-ences are as follows:
piggyBac 39 end: CGTACGTCACAATATGATTATCTTTCTAG-GGTTAA
piggyBac59end: GCATGCGTCAATTTTACGCAGACTATCT TTC-TAGGGTTAA.
Alignments were considered successful if the transposon reference sequence aligned to the beginning of the read, the alignment score was.15, the alignment length was equal to the reference sequence length, and a perfect match was found to a 2-bp sequence at the end of the 39end transposon reference sequence and a 12-bp sequence at the end of the 59end transposon reference sequence (boldface text above, seeFigure S1). Thesefinal sequences were absent from the amplification primers and thus were useful in distinguishing
true transposon-containing reads from off-target amplification events. Because this signature sequence was longer for the 59 end of the transposon, we were able to select 59piggyBac -containing reads with higher confidence than 39piggyBac -containing reads. If a reference transposon sequence was identified in a read, it was removed prior to subsequent anal-ysis; otherwise the read was discarded.
In reads that contained the reference transposon sequence we also looked for the Illumina p5 adapter sequence using the same local alignment algorithm as described above: p5 side Illumina adapter: AGATCGGAAGAGCGTCGTGTAGGGAAAGAGTGTAGA-TCTCGGTGGTCGCCGTATCATT. We defined an alignment to the adapter reference sequence as correct if the alignment score was.15 and encompassed the entire reference sequence or if the alignment score was.10 and the alignment was to the end of the sequenced read. If the adapter sequence was identified in a read sequence, it was removed from subsequent analysis.
Following removal of transposon reference sequences and Illumina adapter sequences (if found), each read was mapped to the Drosophila melanogaster FlyBase r5.22 refer-ence genome using Bowtie, a fast, memory-efficient short-read aligner (Langmeadet al.2009). A single best alignment was used for subsequent analysis and was considered to define the position in the genome to which the read mapped (representing a position near a transposon insertion site).
Associating putative transposon insertion positions with lines
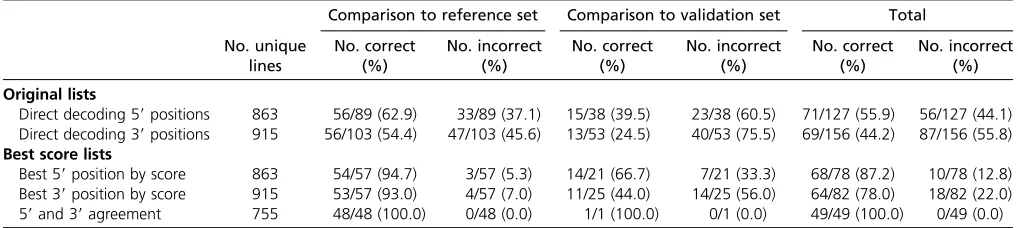
The 39and 59end reads were processed separately. Wefirst identified positions that had many sequencing reads associ-ated with them and thus were likely to represent an insertion position. Only reads longer than 12 bp were considered. For 59end reads, we required 5 or more reads to map to a position for it to be considered as a putative insertion position. For 39 end sequenced reads, we required 25 or more sequence reads to map to a position. For every position considered as a po-tential insertion position, the following procedure was ap-plied to derive a line assignment:first, a 15-bit-long digital sequence, representing the presence (“1” bit) or absence (“0”bit) of reads from each of the 15 pools, was generated. We then decoded this sequence using the Hamming code to Table 1 Accuracy of the original lists and best score lists compared to splinkerette mapping
Comparison to reference set Comparison to validation set Total
No. unique lines No. correct (%) No. incorrect (%) No. correct (%) No. incorrect (%) No. correct (%) No. incorrect (%) Original lists
Direct decoding 59positions 863 56/89 (62.9) 33/89 (37.1) 15/38 (39.5) 23/38 (60.5) 71/127 (55.9) 56/127 (44.1) Direct decoding 39positions 915 56/103 (54.4) 47/103 (45.6) 13/53 (24.5) 40/53 (75.5) 69/156 (44.2) 87/156 (55.8)
Best score lists
find a corresponding line ID (Table S2)—this procedure allows correction of a single error in the digital sequence with respect to the code word associated with the corre-sponding line. If the decoded message was indeed a line ID, we also checked whether the chromosome containing the sequenced reads matched the annotated chromosome of insertion for the line. Decoded identities corresponding to a line with an incorrect chromosome assignment were kept for subsequent analysis. Decoded identities correspond-ing to a correct chromosome assignment were considered as potentially correct (but see additional validation steps be-low). In addition, we generated a second digital sequence for each putative insertion position by requiring reads from a particular pool to represent a distribution of lengths with more than one length so as to ensure independence. Thus, if all reads from a particular pool had the same length, the bit corresponding to this pool was set to 0 rather than to 1 in this alternate code. This 15-bit code word was also decoded using the Hamming code as described above and the result-ing decodresult-ing was assigned to either the incorrect chromo-some list or the potentially correct line assignment list.
The resulting list of assignments of lines to insertion positions consisted of both multiple position suggestions for the same line and multiple line assignments to the same position. In addition, there was significant overlap between the 39and 59end lists. We therefore derived multiple procedures for attributing confidence levels for suggested position-line pairings as well as for extracting a single insertion position assignment for each line.
First, since 39and 59end sequences represent completely separate amplification and processing, lines that were assigned the same insertion position in both lists were likely to be cor-rectly assigned. Thus, we used the list of lines that mapped to the same insertion position based on 39end reads and 59end reads to compute metrics by which confidence could be de-duced for other lines that were not included in this list. The following characteristics were used for confidence assignment:
(1) The number of reads that mapped to the putative inser-tion posiinser-tion and used for generating the digital code. (2) The distance between the digital sequence representing
the presence or absence of reads mapping to the current position in each of the 15 pools and the Hamming code for the line. This distance is 1 for line assignments refl ect-ing Hammect-ing decodect-ing corrections but can be larger when pools with reads of a unique length are assigned 0s. (3) The difference between the mean number of unique read lengths in pools assigned a 1 in the code word associated with the assigned line and the mean number of unique read lengths in pools assigned a 0 in the code word associated with the assigned line.
(4) The difference between the mean number of reads in pools assigned a 1 in the code word associated with the assigned line and the mean number of reads in pools assigned a 0 in the code word associated with the assigned line.
(5) The mean length of reads that mapped to the position associated with the line.
(6) The number of pools represented by a 1 bit in the code word associated with the line in which the number of unique read lengths is one.
We refer to these parameters as the “agreement-based clean-up parameters.”For each of these parameters, we de-termined the minimal or maximal value (depending on which represents lower confidence) represented in the list of lines that decoded in the same manner using 39end reads and 59end reads. We then examined other lists (see below) by requiring that suggested decodings be associated with parameter values that are not worse than the worst param-eter value identified in the corresponding (39end or 59end) agreement list. The lists of suggested decodings based on 39 end reads and on 59end reads were then screened according to this criterion. Next, we extracted a single suggestion for each line on these lists by selecting the decoding that had a maximal difference between the mean number of unique lengths of reads in pools assigned a 1 in the code word associated with the line and the mean number of unique lengths of reads in pools assigned a 0 in the code word associated with the line (parameter 3 above). If, however, this suggested decoding had a nonspecific chromosome as-signment and a suggested decoding for the line existed that had a specific chromosome assignment, the decoding associ-ated with the specific chromosome assignment was preferred even if it had a lower score.
We next compared these lists and extracted lists of suggested decodings that were in agreement (lines assigned to the same position), lists of lines that were in disagreement (lines assigned to different positions), and lists of lines that were only included in one of the lists (39end or 59end sequenced reads). This comparison implied different confidence levels for the lines appearing in different lists. Since 59suggestions were generally more reliable than 39 suggestions, in cases where the 59and 39suggestions disagreed, only 59suggestions were retained.
Finally, we attempted to derive additional decoding sug-gestions for putative insertion positions that were not success-fully assigned by the above described procedures:i.e., suggested decodings associated with incorrect chromosomes or suggested decodings with line assignments where a better assignment was found for the same line. To do so, we considered lines in thefinal agreement lists between 39end and 59end sequences as correctly assigned lines and attempted to match putative insertion positions to the remaining lines by applying two different procedures:
(1) For putative insertion positions consisting of reads in a set of pools representing a subset of the pools associated with an unassigned line, the corresponding unassigned line was suggested as a decoding. In this manner, a“multiple zero-to-one error list”was generated.
positions together with additional reads from other pools, the corresponding unassigned line was suggested as a decoding. In this manner, a “multiple one-to-zero error list”was generated.
The above described lists were further cleaned using the same agreement-based clean-up criteria described above. Furthermore, we compared the 39end and 59end versions of these lists to each other and to previously generated lists to search for matches to increase confidence in particular suggested decodings.
Code
Matlab code for Hamming encoding of line identities and decoding peaks of mapped reads is available for download at: http://www.stanford.edu/group/clandininlab/hamming.
Results
We tested our method on a collection of 1065 transposon insertion lines inDrosophila, generated using apiggyBac ele-ment (Gohlet al.2011; Silieset al.2013). Within this collec-tion, the vast majority of strains contained a single insertion into the genome. Insertion strains werefirst grouped by the targeted chromosome (determined during strain construc-tion) and then each line on a given chromosome was assigned a unique ID number. Next, each ID number was encoded as a 15-bit binary Hamming“code word.”The use of 15-bit code words, as opposed to the 11 bits that would be the minimum necessary for representing 1065 lines, allowed us to create distance between code words such that at least three errors would be needed to convert one code word into another. Specifically, using a Hamming code, we guaranteed this sep-aration between all code words, enabling the detection of up to two errors and correction of single errors (Hamming 1950). Each of the 15 bits represented a pool of animals. Animals from a specific line were added to each pool corresponding to a digital 1 in the code word encoding the line ID and were not added into pools corresponding to digital 0s. Next, genomic DNA was extracted from each pool, mechanically sheared to an average fragment size of 200 bp, and attached to Illumina adapters (Meyer and Kircher 2010). To verify the distribution of sample DNA within the correct subset of pools, we designed primers to amplify several insertions that had previously been mapped using conventional splinkerette PCR (Potter and Luo 2010). For each of these, the predicted PCR products were observed in the anticipated subset of pools (Figure 1B). Trans-poson sequences in each pool were then amplified using hemi-specific PCR using one primer in the transposon and one primer in the Illumina adapter. Pool-specific DNA barcodes andflow cell adapters were then added using another round of PCR amplification. Next, DNA from the individual, barcoded pools was mixed and sequenced in a single 150-bp, paired-end MiSeq run (Bentleyet al.2008). Using the barcode informa-tion, sequence reads were divided by the pools from which the DNA samples were extracted.
Prior to generating a list of putative insertion sites, the following processing steps were performed. First, sequence reads for each pool werefiltered by whether they contained piggyBactransposon sequence and trimmed to remove trans-poson and adapter sequences. Then, sequences were map-ped to the genome using the short-read alignment program, Bowtie (see Materials and Methods for details) (Langmead et al.2009). Next, we generated lists of suggested line iden-tities for insertion positions for both the 59 and 39 trans-poson junctions (which were amplified and barcoded in independent reactions). To do this, wefirst identified puta-tive transposon insertion sites, positions in the genome to which many reads mapped. Then, we inferred line identity corresponding to each position based on the digital se-quence defined by the presence or absence of sequencing leads mapped to this position across the 15 pools (Figure 1C). Because the DNA samples were mechanically sheared, in-dependent reads from the same pool should vary in length. We therefore also attempted to assign a second suggested code word for each position byflipping 1 bits to 0 bits when the corresponding pools only contained reads of a single length, meaning that the putative insertion site had only been identified once. Finally, these digital sequences, of which there were either one or two for every position, were decoded to retrieve the line IDs from the corresponding code words. At this point, corrections based on the Hamming code were made. Since we knew the insertion chromosome for each line, we excluded mapping suggestions that pointed to an incor-rect chromosome and set these aside for subsequent analysis (see below). In sum, following all data processing steps above, each position was associated with either one or two suggested lines, thereby generating a comprehensive list of possible map position assignments.
suggested positions were correct (see“Original lists,”Table 1). Thus, direct decoding was insufficient to reliably map lines.
To extract more accurate lists, consisting of single insertion suggestions for each line, we derived a score to capture the confidence in the match between the reads associated with a position and the corresponding line. This score was designed to reflect the fact that a large number of different read lengths associated with a specific position in a particular pool indicated a higher likelihood that the corresponding insertion was truly in that pool. We therefore calculated the difference between the mean number of unique read lengths found in pools assigned 1s in a given code and the mean number of unique read lengths in pools assigned 0s. We then selected the highest scoring single insertion position for each line and discarded all other suggested positions. Using this approach we generated very accurate lists with signifi -cantly fewer erroneous map position suggestions. In particu-lar, the lists derived from 59and 39end sequences consisted of 54/57 (94.7%) and 53/57 (93%) correct insertion position suggestions for lines in the reference set, respectively (see
“Best score lists,”Table 1). As expected, there was substantial overlap and agreement between these two lists, with 755/1065 (70.1%) of lines having the same suggested position for both the 59and 39end decodings. This“agreement”list was perfectly accurate when compared to the reference list, as 48/48 (100%) of the reference insertions were correctly mapped (Table 1).
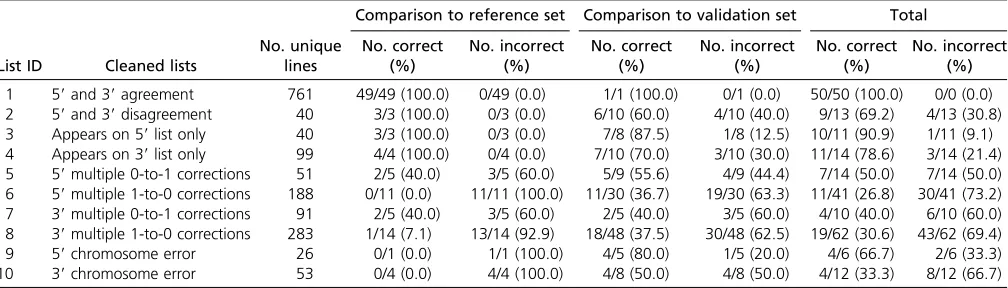
Since this agreement list was highly reliable, we used it to characterize the properties of insertion position - line assign-ment pairings that were indicative of accuracy. From this, we derived additional criteria to eliminate inaccurate mapping suggestions (seeMaterials and Methodsfor details). When these criteria were applied to the original direct decoding lists, 841/ 1065 (79.0%) of lines were represented in the cleaned 59list, 900/1065 (84.5%) of lines were represented in the cleaned 39 list, and 761/1065 (71.5%) were on the agreement list (Table 2). These new lists correctly captured 55/55 (100%; 59end) and 53/56 (94.6%; 39 end) of the lines in the reference set (data not shown).
To increase the fraction of mapped lines, we next sought additional insertion positions for lines that were not included in the agreement list. To do this, we generated additional suggested decodings by allowing two or more digital bits to differ between the codes derived from sequence reads and code words that were used in the pooling design but not yet reliably assigned to positions. Thefirst of these lists consisted of suggested decodings where reads from more than one pool were expected by the code word but missing in the set of mapped sequence reads (creating a multiple zero-to-one error list, see Materials and Methods for details). The second of these lists included lines that were assigned to positions consisting of reads not only from the pools associated with the code word but also from other pools (creating a multiple one-to-zero error list). This latter list was designed to obtain suggested map positions in cases where multiple lines shared the same insertion position. Finally, we generated lists in which there was a mismatch between the suggested position and the chromosome determined during strain con-struction (creating a“chromosome error list”). These lists were then processed using the same quality criteria described above. To assess the accuracy of these additional lists, we mapped 50 more lines by splinkerette PCR, focusing on lines that were not included in the agreement list (File S2). Comparing all of these error lists to this validation set revealed that many lines were correctly mapped, with accuracy ranging between 36.7% and 80%, depending on the list (Table 2). Among these correct suggestions, we even found several instances in which we recovered the correct insertion position for multi-ple lines where the transposable element had targeted exactly the same genomic site in the same orientation (Figure S2). Thus, in some instances, our analysis was able to separate mixed codes.
Our analysis generated map positions for 761/1065 (71.5%) of lines with a measured accuracy of 100%, as well as map positions for an additional 179/1065 (16.8%) of lines with an accuracy of between 69.2% and 90.9% (Table 2), representing 88.5% of the collection in aggregate. Table 2 Accuracy of cleaned lists compared to splinkerette mapping
Comparison to reference set Comparison to validation set Total
List ID Cleaned lists
In addition, for lines that were not mapped with 100% ac-curacy, by additional data processing, we generated 692 partially overlapping suggested map positions, which have lower confidence (26.8–66.7%, based on all splinkerette mapping data, Table 2). In total, this analysis generated map position suggestions for 1060/1065 lines (99.5% of the collection; Table 2 andTable S3). We note that the list of suggested map positions can be further refined by prior-itizing suggestions on lists with higher accuracy, suggestions with higher scores, suggestions in which the 59and 39 data-sets agree, or by using machine-learning methods to identify position features reflective of accuracy.
Discussion
Here we describe how the sequencing efficiencies associated with NGS technology can be combined with a directed pooling strategy to efficiently map large numbers of transposon insertion sites in a multicellular genetic model organism. Using this approach, we mapped a collection of .1000 independent insertions, obtaining 88.5% coverage with high confidence. Digital encoding of the samples allowed for the identities of .1000 samples to be encoded in 15 pools, representing an 70-fold reduction in time and reagent costs associated with sample processing and an 5-fold reduction in per sample sequencing costs, a difference that will continue to grow as the cost of NGS continues to fall.
While our current approach succeeded, we note that several simple improvements are possible. For instance, since the p7-side Illumina adapter is added to the end of the primer during transposon amplification, omitting the p7-side adapter from the initial adapter ligation and/or performing nested PCR could dramatically reduce the number of non-transposon reads. In addition, limiting the pool of used Hamming code words to those with high entropy, or in-creasing the Hamming distance between used code words, would facilitate decoding. That is, using code words that contain comparable numbers of digital 1s and 0s, as well as using code word libraries that require several errors to convert a code word used for one line into a code used for another line, would make decoding simpler. Nonetheless, our approach reduces the workload associated with mapping large numbers of insertions, reducing the number of reactions necessary to map nearly 1000 insertions to 15 samples and requiring only a simple set of barcodes necessary to define this small group of pools. The 15 pools that were required to encode 1000 lines using our method represent roughly half the number of pools that would be needed for either a plate/ row/column pooling scheme (which scales roughly linearly with sample size) or using DNA Sudoku (which scales as a function of the square root of the number of samples) (Erlich et al.2009). Using Hamming codes, the number of additional samples that can be encoded scales roughly as a factor of 2n, wherenis the number of pools, allowing large
numbers of additional samples to be encoded by a small in-crease in pool number. Thus, the scale of the pooling strategy
can be readily adapted to the scale of the library to be map-ped and offers larger and larger increases in efficiency as the number of lines grows. Finally, we note that this approach is not, by design, limited to the sequencing of insertion fragments, but rather can be extended to multiplex the sequencing of any collection of different DNA fragments.
Acknowledgments
We thank Yvette Fisher, Jonathan Leong, and Samuel Lasse for helpful discussions; the Stanford Functional Genomics Facility, particularly Xuhuai Ji and Vanita Natu, for experi-mental advice and assistance; and Xiaojing Gao, Jessica Tsai, Mya Win, and Wes Grueber for contributing splinkerette mapping data. We thank Jennifer Esch, Yvette Fisher, Xiaojing Gao, Tina Schwabe, and Helen Yang for comments on the manuscript. D.M.G was supported by a Ruth L. Kirschstein National Research Service Award postdoctoral fellowship (F32 EY020040) from the National Eye Institute. L.F. was supported by a Fulbright International Science and Technology scholar-ship and a Bio-X Stanford Interdisciplinary graduate fellowscholar-ship (Bruce and Elizabeth Dunlevie fellow). M.S. was supported by a postdoctoral fellowship from the Jane Coffin Childs Memo-rial Fund for Medical Research. This work was funded by a National Institutes of Health Director’s Pioneer award DP1 OD003530 (T.R.C.) and by R01 EY022638 (T.R.C).
Literature Cited
Barton, G. J., 1993 An efficient algorithm to locate all locally optimal
alignments between two sequences allowing for gaps. Comput.
Appl. Biosci. 9: 729–734.
Bellen, H. J., R. W. Levis, Y. He, J. W. Carlson, M. Evans-Holmet al.,
2011 The Drosophila gene disruption project: progress using
transposons with distinctive site specificities. Genetics 188:
731–743.
Bentley, D. R., S. Balasubramanian, H. P. Swerdlow, G. P. Smith, J.
Miltonet al., 2008 Accurate whole human genome sequencing
using reversible terminator chemistry. Nature 456: 53–59.
Bire, S., and F. Rouleux-Bonnin, 2012 Transposable elements as
tools for reshaping the genome: it is a huge world after all!
Methods Mol. Biol. 859: 1–28.
Devon, R. S., D. J. Porteous, and A. J. Brookes, 1995 Splinkerettes–
improved vectorettes for greater efficiency in PCR walking. Nucleic
Acids Res. 23: 1644–1645.
Erlich, Y., K. Chang, A. Gordon, R. Ronen, O. Navon et al.,
2009 DNA Sudoku–harnessing high-throughput sequencing for
multiplexed specimen analysis. Genome Res. 19: 1243–1253.
Febrer, M., K. McLay, M. Caccamo, K. B. Twomey, and R. P. Ryan,
2011 Advances in bacterial transcriptome and transposon
insertion-site profiling using second-generation sequencing.
Trends Biotechnol. 29: 586–594.
Gohl, D. M., M. A. Silies, X. J. Gao, S. Bhalerao, F. J. Luongoet al.,
2011 A versatile in vivo system for directed dissection of gene
expression patterns. Nat. Methods 8: 231–237.
Golay, M. J. E., 1949 Notes on digital coding. Proceedings of the
IRE 37: 657.
Goodman, A. L., N. P. McNulty, Y. Zhao, D. Leip, R. D. Mitraet al.,
2009 Identifying genetic determinants needed to establish
a human gut symbiont in its habitat. Cell Host Microbe 6:
Hamady, M., J. J. Walker, J. K. Harris, N. J. Gold, and R. Knight,
2008 Error-correcting barcoded primers for pyrosequencing
hundreds of samples in multiplex. Nat. Methods 5: 235–237.
Hamming, R., 1950 Error detecting and error correcting codes.
Syst Tech J XXIX: 147–160.
Iskow, R. C., M. T. McCabe, R. E. Mills, S. Torene, W. S. Pittard
et al., 2010 Natural mutagenesis of human genomes by
endog-enous retrotransposons. Cell 141: 1253–1261.
Langmead, B., C. Trapnell, M. Pop, and S. L. Salzberg, 2009 Ultrafast
and memory-efficient alignment of short DNA sequences to the
human genome. Genome Biol. 10: R25.
Mazurkiewicz, P., C. M. Tang, C. Boone, and D. W. Holden,
2006 Signature-tagged mutagenesis: barcoding mutants for
genome-wide screens. Nat. Rev. Genet. 7: 929–939.
Meyer, M., and M. Kircher, 2010 Illumina sequencing library
prep-aration for highly multiplexed target capture and sequencing. Cold Spring Harb. Protoc. (6): pdb prot5448.
Ochman, H., A. S. Gerber, and D. L. Hartl, 1988 Genetic
applica-tions of an inverse polymerase chain reaction. Genetics 120:
621–623.
Potter, C. J., and L. Luo, 2010 Splinkerette PCR for mapping
transposable elements in Drosophila. PLoS ONE 5: e10168.
Prabhu, S., and I. Pe’er, 2009 Overlapping pools for
high-throughput targeted resequencing. Genome Res. 19: 1254–
1261.
Silies, M., D. M. Gohl, Y. E. Fisher, L. Freifeld, D. A. Clark et al.,
2013 Modular use of peripheral input channels tunes
motion-detecting circuitry. Neuron 79: 111–127.
Uren, A. G., H. Mikkers, J. Kool, L. van der Weyden, A. H. Lund
et al., 2009 A high-throughput splinkerette-PCR method for
the isolation and sequencing of retroviral insertion sites. Nat.
Protoc. 4: 789–798.
GENETICS
Supporting Information http://www.genetics.org/lookup/suppl/doi:10.1534/genetics.113.159483/-/DC1
Large-Scale Mapping of Transposable Element
Insertion Sites Using Digital Encoding of
Sample Identity
Daryl M. Gohl, Limor Freifeld, Marion Silies, Jennifer J. Hwa, Mark Horowitz, and Thomas R. ClandininFigure S1 Sequenced Read Statistics
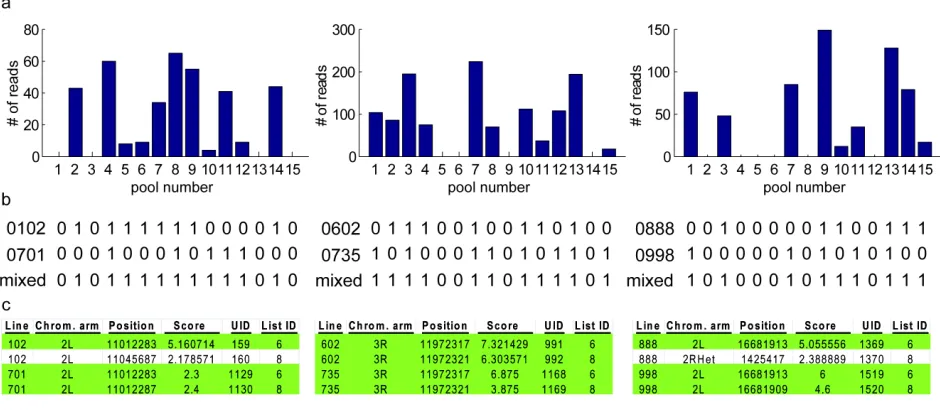
Figure S2 Identifying insertions in the same position with the same orientation
a) Distribution of reads in pools at three insertion positions that were unassigned in any of the agreement or single error-correction lists, but had suggestions in the multiple one-to-zero error lists.
b) The pools associated with the lines suggested by the multiple one-to-zero error lists at these positions and the expected codes resulting from mixtures of these pools.
c) For these three pairs of lines, 10 out of 12 map positions suggested by the multiple one-to-zero error lists (Table 2) were correct (highlighted in green). In these cases, correct mappings could be identified on the basis of their
Files S1 and S2
Available for download at http://www.genetics.org/lookup/suppl/doi:10.1534/genetics.113.159483/-/DC1 as PDF files.
File S1 Splinkerette sequencing data for reference set
FASTA sequences for the 66 lines used to characterize the decoding algorithm.
File S2 Splinkerette sequencing data for validation set
Tables S1-S3
Available for download at http://www.genetics.org/lookup/suppl/doi:10.1534/genetics.113.159483/-/DC1 as Excel files.
Table S1 List of the oligonucleotide sequences used in this study
For indexing primers, the DNA barcode sequence is in lowercase. * stands for a phosphorothiol modification at the indicated position.
Table S2 List of Hamming codes used for all lines
Table listing the line number, chromosomal location, ID number, and binary Hamming code word for each line.
Table S3 List of insertion sites, sequences, and metadata for all suggested line-position associations Table columns are as follows. UID: Unique ID assigned to each suggestion. Line: Line number. line_chrom: Annotated chromosome of insertion. read_chrom: Chromosome arm of suggested map position. position: Map position of sequence (putative insertion site). Score 1.0: mean number of reads in 1 bins - mean number of reads in 0 bins. Score 2.0 (as described in main text): mean number of unique read lengths in 1 bins - mean number of unique read lengths in 0 bins. example sequence: One of the mapped sequence reads. Orientation: orientation of the putative transposon insertion (‘+’ = 5’ to 3’, ‘-‘ = 3’ to 5’). List ID: List that the suggestion was drawn from (see Table 2). N different lines with the same insertion position. N reads: total number of reads in a given peak. N read containing pools: number of pools containing at least one read. N pools containing reads of a unique length only. mean read length. long sequence: longer read drawn from collection of reads mapping to a given position. long sequence primer: indicates whether the long sequence was drawn from a 5’ (5) or 3’ (3) pool. long seq.: Gene inserted in: BLAST result, if inserted within an intragenic region. long seq.: 5' gene and long seq.: 3' gene: BLAST result indicating the upstream and downstream gene if sequence maps to an intergenic region. correct: ‘1’ indicates a match between the suggested decoding and a splinkerette sequence from either the reference or validation set. error: ‘1’ indicates a mismatch between the suggested decoding and a splinkerette sequence from either the reference or validation set.