Sward and steer variables affecting feasibility of electronic
intake measurement of grazers
JAMES R. FORWOOD, ANA M.B. da SILVA, AND JOHN A. PATERSON
Abstract
Forage intake is perhaps the most critical parameter in under- standing performance of ruminants on pasture. The Thermal Con- ductivity Camudr (TCC) is an animal-carried device that measures forage intake without disturbing normal grazing patterns by count- ing the number of boli swallowed over time. To evaluate its accu- racy, studies of the effects of animal size, forage availability, qual- ity, and species differences were conducted. In a grazing study, bolus weights of heavy (533 kg) and light (360 kg) esophageally fistulated steers were monitored on 2 different grazing systems [tall fescue (Fezfucu urundinuceu Shreb) + red clover (Trflolium sp.) season-long vs. tall fescue + red clover in spring and fall and big bluestem (Andropogon gertvdi Vit; cv. Kaw) in summer]. Bali weight differences between steer weights indicated that TCC intake estimation will require calibration for steer weight or use of uni- form steers. Boli weights of heavy steers varied (P<O.O5) within (9.0 to 19.4 g) and among (19.4 to 30.2 g) forage species. That did not occur with light steers (g = 6.25). Analysis of data on a meta- bolic weight basis indicated that size of the oral cavity and the ‘critical mass’ needed to stimulate swallowing may be a factor as well as weight. Sward characteristics and quality parameters were poorly correlated with bolus weight. An indoor study using 3 steer weights (heavy-546 kg, medium-486 kg, and light-220 kg) fed orchardgrass (lOO%), alfalfa (lOO%), and orchardgrass X alfalfa hay (SO/SO) indicated that heavier steers always produced heavier boli but that the weight differences between steers had to be greater than 86 kg to be significantly different. Light steers produced most consistent boli weights over all feeds.
Key Words: ingestion, deglutition, grazing ruminants, forage- livestock
Authors are supervisory range scientist, USDA-AR& Great Plains Systems Research Unit and professorial affiliate, Colorado State University; former graduate studen!, and associate professor, Departments of Agronomy and Animal Science, respectively, University of Missouri, Columbia 65211.
Joint contribution of USDA-ARS and the Dept. of Agronomy, University of Missouri, Columbia 65211.
Manuscript accepted 27 April 1991.
Animal performance on pasture is largely a function of animal requirement, concentration, and availability (digestibility) of nut- rients multiplied by forage intake. Whereas the digestibility and metabolizability of the diet consumed may vary by a factor of about 2, herbage intake of ruminants may vary by a factor of at least 4, even under relatively unrestricted conditions (Hodgson 1982). This statement underscores the importance of understand- ing the factors which regulate intake and more importantly, the need for more accurate intake measurement.
Attempts of a more direct nature than the traditional total fecal collection or indicator methods have been made recently to mea- sure herbage intake of free roaming livestock. The Animal Weight Telemetry System (AWTS; Horn and Miller 1979) and multiple electrode impedance plethysmography (Stuth et al. 1981) system are examples of potential animal-carried devices that reduce han- dling of livestock and allow undisturbed grazing behavior.
The Thermal Conductance Cannula (TCC; Forwood and Hulse 1987) is an animal carried device which estimated intake by count- ing the number of boli swallowed by cattle. In-house studies with cattle fed various levels of forage show the number of boli swal- lowed to be highly correlated with intake (rz = .99) (Forwood and Hulse 1987). The assumption is made that boli are relatively uni- form, with differences in boli weight between grazing initiation and cessation being rather self-compensating. However, questions concerning the effect of animal weight, forage availability, quality, and species on bolus weight needed to be addressed before deci- sions concerning use of various sized animals and comparisons between varying forage species, qualities, and maturities could be made in the use and efficacy of this device. The present study was designed to investigate the effects of animal and forage species differences on bolus weight as related to the feasibility of electroni- cally measuring intake.
Material and Methods Grazing Study
This study was conducted within a larger grazing study compar- ing a Season-Long System (SLS) and a Complementary Grazing System (CGS) (Silva 1987). The SLS involved 2 pastures (all pastures equal 0.8 1 ha) of endophyte free tall fescue (Fesfuca arundinaceu Shreb; MO-96) and red clover (Trifolium sp.) with 1 pasture utilized in spring, the second during mid-summer, and the spring pasture grazed again during late-summer and fall. The CGS involved 1 tall fescue + red clover pasture (similar in species to that used in the SLS system) utilized during spring and late-summer or fall period and ‘Kaw’ big bluestem (Andropogon gerardi Vit; cv. Kaw) grazed during mid-summer. The study was conducted at the University of Missouri Agronomy Research Center during 1986 and 1987. Six tester steers (322 kg) grazed the pastures alongside the tistulated steers in order to collect weight gain data.
Three heavy (avg. 533 kg; range = 460 to 620 kg) and 3 light (avg. 280 kg; range q 250 to 300 kg) esophageally fistulated steers (Bos taurus L.) were used to determine the relationship between cattle bolus weight and body weights. Fistulated steers were lightly fasted (6-8 hours) the evening before bolus collection. Before bolus col- lection, esophageally fistulated steers were allowed to graze with their cannulas in place to familiarize them with the pasture and to avoid unusual boli weight resulting from initial morning grazing. Cannulas were then removed and bolus collection began. Ten distinct boli were collected from each animal as it grazed each treatment pasture. All collections were made within sample peri- ods of 6 consecutive days with each steer receiving 1 or more days of rest between sampling each treatment pasture. The order in which each steer began grazing each treatment pasture on each sample period was randomly assigned. Average weights of the 10 boli were used in analyses. Sample periods were the weeks of 30 May, 15 July, and 11 Aug. 1986, and 20 May, 17 June, 9 July, 11 Aug., and 10 Sep. 1987. Boli were considered distinct when all dimensions of the bolus were visible in order to ensure that all ingested material was exiting the fistula. Boli were placed in indi- vidual paper bags, dried at 40’ C for 48 hours, weighed, and ground to pass a l-mm screen (Wiley mill). In vitro organic matter digestibility (IVOMD) was determined on each of the collected boli using a modified 2 stage in vitro technique as described by Marten and Barnes (1980) followed by ashing samples at 500° C for 3 hours and weighing. Crude protein was determined from Kjeldahl N X 6.25 (AOAC 1976). Neutral detergent fiber (NDF) and Acid Detergent Fiber (AFD) were determined using the methods of Goering and Van Soest (1970) without sodium sulfite. Total dry matter (TDM) was determined by clipping twelve 0.50 mz quadrants per pasture to ground level on or within a few days of the above sample dates. Leaf dry matter (LDM) was determined by hand-separating leaf blades (at the collar) from stems and weighing each component from the above samples. Mean bulk density (BD) (kg KM ha-’ cm-‘) was calculated by dividing TDM by the mean sward height (mm) on each sample date. Forty measurements with a meter rule along equally spaced transects throughout the pasture were taken on each sample date and averaged to estimate sward height.
A split plot analysis of variance was used to test differences in boli weights as influenced by steer weights, grazing systems, and periods. Data were analyzed separately each year because of differ- ences in collection dates between 1986 and 1987. The linear statisti- cal model contained the effects of steer weight, steers within steer weights, grazing systems, periods, and all possible interactions of steer weight, grazing systems, and periods. The main effect of steer weight was tested using steer within weight as the denominator of F. All other effects in the model used the Residual Mean Square as the denominator of F. Since most of the comparisons of interest
compare only 2 means, differences were determined using the protected Least Significant Difference (LSD) procedure (P<O.O5) (Cochran and Cox 1967). Correlation coefficients were used to test the relationship between boli weights and sward and forage quality parameters.
Indoor Study
Nine esophageally fistulated steers, (Bos taurus L.) 3 each of heavy, medium, and light weights (averaging 546,486, and 220 kg, respectively) were confined to individual pens 2 weeks prior to study initiation at the Animal Science Research Center, University of Missouri, Columbia. Steers were maintained under thermal neutral conditions at all times. They were placed on treatment orchardgrass (Dactylis glomorata L.) and alfalfa (Mediago sativa sp.) hay diets 2 weeks before data collection. Hay offered to each steer was calculated on the basis of NRC 1984 requirements for beef cattle. A concentrate (1% of body weight) was available to the steers to balance total requirements(8l%TDN, 13%protein, .89% CA, and .40% P). Treatment hays tested were orchardgrass (100% of diet), alfalfa (100% of diet), and a SO/ 50 mixture of the orchard- grass and alfalfa hays on a dry weight basis. Orchardgrass had been harvested at late vegetative stage while the alfalfa was in full bloom at harvest.
Steers were lightly fasted (6 hours) the evening before data collection and were allowed to begin consuming forage with cannu- las in place. After a few minutes cannulas were removed and 10 distinct boli were collected from each steer. Average boli weight was calculated from these 10 boli. Boli were allowed to drop on the floor in order to collect them separately. Each bolus was placed in an individual paper bag, oven dried at 40° C and weighed.
Experimental design was three (3 X 3) Latin squares with rows defined as periods and columns as animals. During each of 3 periods, the steers were fed 1 of the 3 diets. The linear statistical model contained the effects of steer weight, steers within steer weight, period within weight, diets, and the interaction of diets by steer weights. The main effect of weight was tested using steers within weight as the denominator of F. All other effects used the Residual Mean Square as the denominator of F. Each Latin square was defined for a steer weight, while feeds were consistent for all treatment means separated using LSD (P<O.O5). Regression anal- ysis was used to determine the relationship between bolus weight and animal weight (Steel and Torrie 1960).
Results and Discussion Grazing Study
Average bolus weights from heavy and light steers were 14.1 and 5.69 g, respectively, on the SLS system and 21.5 and 8.48 g, respectively on the CGS in 1986 (Table 1); however the 3-way interaction of steer weight X grazing system X period was signifi- cant (P = 0.03).
Light steers boli weights on the SLS gradually increased (P<O.O5) as the 1986 season progressed but no change occurred on the CGS. Heavy steer boli on the SLS were heavier on 15 July (P<O.OS) and 11 Aug. (PCO.05) compared to 30 May. Boli from heavy CGS steers 15 July were over twice the weight of boli on 11 Aug. and were significantly (PCO.05) heavier than heavy steer boli on the SLS. No explanation is available from these results, except for sward maturity or species differences due to periods or systems. For 1987, although the 3-way interaction was not significant, steer weight X grazing system and steer weight X period interac- tions did significantly (P = 0.02 and 0.01, respectively) affect boli weights.
In 1987 average boli weights were 11.8 g and 5.7 g for heavy and light steers, respectively, on the SLS system and 17.5 g and 7.0 g for steers on the CGS system (Table 1).
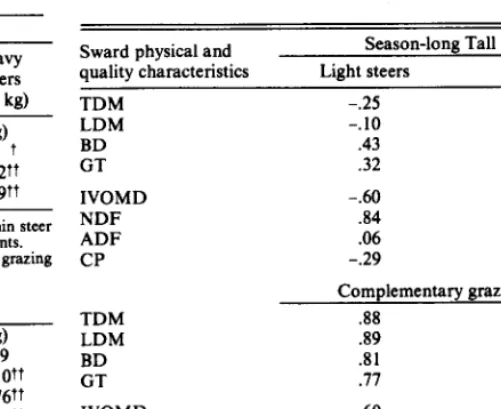
Table 1. Average bolus dry weights from small and large steers while Table 2. Correlation coefficients (r) of light and heavy steer boli weights grazing Season-Long (SLS) and Complementary Grazing (CGS) Sys- with total herbage dry matter (TDM), leaf dry matter (LDM), herbage terns during the 1986 and 1987 grjlzing seasons. bulk density (BD), grazing time (GT), in vitro organic matter digestibility (IVOMD), neutral and acid detergent fiber (NDF, ADF respectively) and crude protein (CP) averages over 2 years.
Bolus dry weight
Date
SLS CGS
Light Heavy Light Heavy Steers Steers Steers Steers
(300 kg) (553 kg) (360 W (553 kg)
1986 (g) (8) (8)
30 May 2.40 9.05 (8), +
I5 July 5.03 19.39 8.1777 30.277
II August 9.64 13.85 8.79tt 12.9tt
LSD 0.05 = 3.5 for comparisons of means between grazing treatments within steer weights l periods or between periods within steer weights X grazing treatments. LSD 0.05 = 6.2 for comparisons of means between steer weights within grazing treatments X periods.
Date
1987 (g) (g) C&T) (s)
20 May 4.23 9.64 5.05 10.99
17 June 4.89 14.31 5.5877 24. Iott
9 July 7.61 10.96 9.33tt 14.76tt
11 August 5.99 9.60 8.OOtt 13.96tt
IO September 6.10 14.50 7.04 23.74 LSD 0.05 q 5.3 for comparisons of means between grazing treatments within steer weights X periods or between periods within steer weights X grazing treatments. LSD 0.05 = 8.4 for comparisons of means between steer weights within grazing treatments X periods.
t Missing data
ttSteers were on the big bluestem portion of the Complementary System.
Sward physical and quality characteristics
Season-long Tall Fescue Light steers Heavy steers TDM
LDM BD GT IVOMD NDF ADF CP
TDM LDM BD CT IVOMD NDF ADF CP
-.25 -.09
-.lO .61
.43 -.28
.32 -.33
-60 .4l
.84 .04
.06 -.63
-.29 -.38
Complementary grazing system
.88 .13
.89 .15
.81 .I3
.77 -.I3
-.60 .34
.67 .I6
.52 .98
.38 -.67
In 1987, heavy steers produced heavier boli than light steers on 17 June and 10 September (Table 1). Means within steer weights over the dates were 4.6, 5.3, 8.5, 7.0, and 6.5 g for light steer boli and 9.8,19.2, 12.6,11.8, and 19.2 g for heavy steer boli. While boli weights of light steers did not vary significantly over periods, heavy steers produced heavier boli on 17 June and 10 Sep. than on the other 3 dates. Both of those periods represent a change of pasture and accompanying increases in total available dry matter and leaf dry matter.
found between bolus weight and NDF. No explanation is available for that phenomena or the inverse relationship between boli weight and IVOMD.
Table 1 shows that when steers are grazing pastures of similar species or different species, boli weights of light steers are more similar in weight than those of heavy steers.
In general, no clear trend is evident between sward and nutritive characteristics and bolus weight. Although there is little previous data relating bolus weight to forage quality and sward characteris- tics, correlations of grazing time, biting rate, and ingestion rate with similar parameters result in few significant correlations (Olsen et al. 1989). It appears to these authors that cattle may vary bite size, bite rate, and grazing time in attempting to maintain constant intake but those parameters are apparently not reflected in bolus weight.
Bolus weight for both steer weights was poorly correlated with total herbage dry matter (TDM), leaf dry matter (LDM), sward bulk density (BD), and grazing time (GT) when analyzed in separ- ate systems (Table 2). This poor overall relationship is similar to other findings (Stuth and Angel1 1982) which indicated bolus weight is not greatly affected by daily herbage allowance. When sward data from both systems were combined only BD was posi- tively correlated with bolus weight (r = .66; P<O.O2) for light steers (data not shown).
Boli were heavier in our study for both animal weights tested than the values reported by Stuth and Angel1 (1982). Their results showed that bolus weight is reasonably uniform throughout a nonrestrictive range of daily herbage allowance, that season has a negligible effect on bolus dry matter weight, and that cow weight did not influence bolus weight. Data from the 2 studies are similar concerning the influence of herbage parameters on bolus weight. Stuth and Angel1 (1982) mentioned that the cows used in their study represented only moderate to large frame animals (426 and 466 kg: only a 40 kg difference in weight) while the steers used in our study differed by 173 kg in 1986 and 255 kg in 1987. Forage quality characteristics were more highly correlated with
light steer bolus weights than were sward characteristics (Table 2). However, sward characteristics were highly correlated with light steer boli weights in the CGS. No explanation is available for these results. Boli weight from heavy steers was negatively correlated with ADF in the SLS and positively correlated in CGS systems. John and Reid (1986) speculated that intake may be most limited by physical characteristics of the feed which affect the ease with which it is compressed to form a bolus. This statement was based on their data which showed lighter boli when hay was fed (jr = 3.5 g) than when fresh herbage was fed (X = 12.4 g). We speculate that, where a negative correlation existed between ADF and boli weight, the herbage may have been difficult to compress with mastication, resulting in lighter boli. When data from both systems were com- bined and analyzed by animal weight, a positive relationship was
Although steer weights appear to dictate boli weights, analysis of boli weight data on an animal metabolic weight basis showed (P<O.O02) differences for 1986 (7.2 and 17.6 g overall averages for light and heavy steers respectively) and a similar (p>O. 13) trend in 1987 (6.5 g and 14.2 g overall averages for light and heavy steers, respectively). Heavy steer boli were also heavier than light steer boli when analyzed as a ratio of boli weight to steer weight (data not shown). We speculate that steer head size (and associated size of the buccal cavity) and the amount of herbage it can accommo- date before a ‘critical density’or weight stimulates swallowing, may play a part in determining bolus weights. Light steers would obviously reach that point with less dry matter than would heavy steers. Theoretically that would make it possible for a large frame animal in poor flesh to produce a bolus similar to a heavy animal of the same frame.
Equations for adjusting bolus weights for varying steer weights
Table 3. Linear regression equations of the relationship between bolus Table 5. Linear regression equations of the relationship between bolus weight and steer body weights while gruing tall fescue and big bluestem weight and steer body weights when steers were fed orchardgrass,
pastures. orchardgrass and alfalfa (arch X alf.)* and alfalfa hays.
Season-long system Complementary system
30 May
I5 July
11 August
20 May
I7 June 9 July
11 August 30 September
1986
y = 12.53 + .Ol89 BWtt (missing data) (.06, 86)’
y = -15.39 + 0.275 BW y = -24.79 + .0438 BWt (.Ol, .84) (.006, .87) y = 2.137 + St096 BW y = .I488 + 0.011 BWt
(.08, .56) (.009, .85)
1987
y = -3.62 + 0. I I BW y=-3.09+0.114BW (.0002, .53) (.OOOl, .42) y = -9.69 + 0.02 BW y = -22.3 + 0.038 BWt
(.oool, .35) (.OOOl, .48) y=.45+.009BW y = 1.2 + .Oll BWt
(.OOOS, .18) (.OOOl, 40) y q 1.27 + .007 BW y = 2.64 + .009 BWt
(.OOOl, .30) (.0007, .19)
y = 4.8 + .015 BW y = -13.7 + .03 BW (.OOl, .43) (001, .59)
‘Probability of the slope of the line equaling zero and the multiple correlation coefficient (I*) which equals the percent variation in bolos weight accounted for by a linear function of animal body weight.
RSteers were grazing warm-season grass pasture. ttBW = Steer live body weight (kg)
y = dty material per bolos (2)
for both grazing systems are presented in Table 3. Percentage variation in bolus weight accounted for by a linear function in body weights was greater during 1986 (x = 76%) as compared to 1987 (x = 38%). No explanation is known for this phenomenon.
Indoor Study
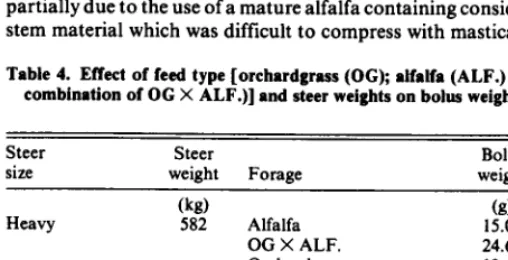
Mean boli weights across all hay types for heavy, medium, and light steers were 19.8,15.1, and 9.7 g, respectively. Heavier animals produced heavier boli than light animals. (P<O.OS) Although there were always bolus weight differences between heavy and light steers, bolus weights were not always different between heavy and medium or medium and light steers. There was more similarity in boli weights between heavy and medium than there was between medium and light steers probably due to the fact that there was only 86 kg difference in steer weights between heavy and medium steers compared to 206 kg difference between medium and light steers.
Disregarding steer weights, boli were lightest when alfalfa was fed (x 12.3 g) compared to the alfalfa X orchardgrass mixture (jt q 16.0) or orchardgrass alone (x q 16.3). This may have been at least partially due to the use of a mature alfalfa containing considerable stem material which was difficult to compress with mastication.
Table 4. Effect of feed type [orchardgrass (OG); alfalfa (ALF.) and the combination of OG X ALF.)] and steer weights on bolus weight (g).
Steer
size
Heavy
Medium
Light
Steer Bolus
weight Forage weight (g) :“s”: Alfalfa 15.07
OG X ALF. 24.64 Orchardgrass 19.66 496 Alfalfa 12.51 OG X ALF. 14.94 Orchardgrass 17.96 290 Alfalfa 9.38 OG X ALF. 8.45 Orchardgrass 11.22
Hay Equation r2 Orchardgrass y q 5.423 + 0.016 BWtt .61**
Orch. X Alfl y = 1.352 + 0.0402 BW .76* Alfalfa y = 3.478 + 0.0296 BW .58 t Orchardgrass X alfalfa ha in 50~50 mixture
ttBW = steer live bod
***Significant at 0.0 Y and 0.01 levels, respectively. weig t B
The association between steer weights and boli weights was greater when orchardgrass X alfalfa hay was fed than with orchardgrass alone or alfalfa alone (Table 5). The interaction of steer weight and feed was significant at (P<O.O6). The cause of the interaction appeared to be the very heavy boli produced by heavy steers on the orchardgrass X alfalfa mixture. Otherwise, the trend was for boli to increase in weight when orchardgrass was added to the diet.
Extrapolating this data to the grazing situation, if one had no alternative but to use steers of various weights when counting boli to determine intake, results may be more accurate on pure alfalfa stands. If one were attempting to estimate intake via boli counting when steers were grazing grass, legume, or grass X legume combi- nation pastures the data, similar to the outdoor study, we suggest using light steers. This suggestion appears logical because heavy and medium weight steers produced different boli weights on different feeds while light steer boli weights were similar across feeds. This study indicates that at least an 86 kg difference must exist between steer weights for bolus weight to be affected.
Conclusions
If intake were to be estimated by an animal-carried bolus- counting device such as the TCC, our data indicated that experi- menters would be required to keep experimental animals within 86 kg of one another. Frame uniformity must also be considered to avoid the potential of thin but large framed animals which may swallow a much larger bolus (and therefore have greater intake) than a heavier but smaller framed animal. Light steers (300 kg range) would be preferable due to the boli weight uniformity between periods and between systems when using light steers. Although sward and forage nutritive quality characteristics did not appear to be correlated with bolus weight, there remains a question concerning bolus weight uniformity over time and between forage species. Either additibnal studies must be conducted to answer these questions or one or more esophageally fistulated animals similar in size to those carrying the device should be used to periodically measure boli weights and adjust intake estimates accordingly. In any case, more data must be collected before the TCC device can be considered a reliable means of measuring forage intake of free-roaming grazers.
Literature Cited
AOAC. 1976. Official methods of analysis. (12th ed.). Assoc. Oftic. Agr. Chem. Washington, D.C.
Cochran, W.G., and GM. Cox. 1967. Experimental designs (2nd Ed.). John Wiley and Sons, Inc., N.Y.
Forwood, J.R., and M.M. Hulse. 1987. Thermal conductivity instrumenta- tion for direct forage intake measurement of grazers. p. 83-84. In: Mary Rose (ed.), Herbivore nutrition research. Proc., 2nd Int. Symp. Nutr. Herbivores. Brisbane, Australia.
Goering, H.K., and P.J. Van Soest. 1970. Forage fiber analysis (Apparatus, Reagents, Procedures and some Applications). ARS-USDA Handb. 379.
LSD (0.05) = 3.60
Hodgson, J. 1982. Influence of sward characteristics on diet selection and herbage intake by the grazing animal. In: J.B. Hacker, (ed.) Nutritional limits to animal production from pastures. Proc. Internat. Symp., August 24-28, 1981. St. Lucia, Queensland, Australia.
Horn, F.P., and G.E. Miller. 1979. Bovine-boots-a new research tool. Oklahoma Agr. Exp. Sta. Misc. Pub. MP-104. p. 44-46.
John, A., and C.S.W. Reid. 1986. Factors affecting rate of feed intake by sheep. Proc. Nutr. Sot. New Zealand. 11: 108.
Marten, G.C., and R.F. Barnes. 1980. Prediction of energy digestibility of forages with in vitro rumen fermentation and fungal enzyme systems. p. 61-71. In: W.J. Pidgen, C.C. Balch,and M. Graham(eds.), Standardiza- tion of analytical methodology for feeds. Int. Dev. Res. Center, Ottawa, Canada.
NRC. 1984. Nutrient requirements of beef cattle (6th ed.) National Academy Press, Washington, D.C.
Olson, K.C., G.B. Rouse, and J.C. Malecheck. 1989. Cattle nutrition and grazing behavior during short-duration grazing periods on crested wheatgrass range. J. Range Manage. 42: 153-158.
Silva, C.A. 1987. Canopy structure, forage yield, and quality changes in season-long vs. complementary grazing systems. M.S. Thesis Univ. Mis- souri, Columbia.
Steel, G.D., and J.H. Torrie. 1960. Principles and procedures of statistics. McGraw-Hill Book Co., New York.
Stuth, J.W., K.J. Kanouse, J.F.Hunter,andH.A. Pearson. 1981. Multiple electrode impedance plethysmography system for monitoring grazing dynamics. Biomed. Sci. Instr. 17:121-124.