A NEW VALIDATED SIMULTANEOUS REVERSED-PHASE HIGH-PERFORMANCE LIQUID
CHROMATOGRAPHY ASSAY METHOD FOR ESTIMATION OF TWO FLAVONES (BAICALEIN AND
CHRYSIN) IN API DRUGS
MADDI SESHARAO, VALLABANENI MADHAVARAO*
Department of Organic Chemistry, Bapatla Engineering College (Autonomous) Bapatla, Andhra Pradesh, India. Email: [email protected]
Received: 07 July 2017, Revised and Accepted: 31 October 2017
ABSTRACT
Objective: The scope of the present work is a reversed-phase high-performance liquid chromatography (RP-HPLC) assay method developed for the simultaneous determination of baicalein and Chrysin in API drugs.
Methods: The RP-HPLC method employed a Hypersil BDS C18 reversed-phase column (150×4.6 mm×5.0 µm) with an isocratic mixture of water and acetonitrile in the ratio of 55:45; v/v as the mobile phase. The column temperature was kept at 25°C. The flow rate was 1.0 mL/min, and detection was by means of a photodiode array detector at wavelength of 268 nm and validated for various parameters such as specificity, system suitability, method precision, linearity, accuracy, solution stability, ruggedness, and robustness.
Results: The system suitability parameters were evaluated from standard chromatograms by calculating the % relative standard deviation (RSD) from six replicate injections for baicalein and Chrysin peak areas. The % RSD for the peak area of the principal peak from six replicate injections of each standard solution was <2.0%. The linearity and correlation coefficient of baicalein and Chrysin was found to be 0.999. Method precision was performed, and % RSD from six different preparations for baicalein and Chrysin were found to be <2.0. The % recovery for each level was found to be the range of 98.0–102%. In ruggedness and robustness, the % RSD of the peak area of all peaks for six replicate injections should be not more than 2.0.
Conclusion: Hence, the chromatographic assay method developed for baicalein and chrysin is said to be rapid, simple, specific, sensitive, precise, accurate, and reliable that can be effectively applied for routine analysis in research institutions, quality control department in industries, approved testing laboratories, bio-pharmaceutics, and bio-equivalence studies and in clinical pharmacokinetic studies.
Keywords: Baicalein, Chrysin, Reversed-phase high-performance liquid chromatography, Method development, Validation.
INTRODUCTION
Flavonoids are a family of polyphenolic compounds synthesized by plants with a similar structure and are divided into subclasses, including anthocyanidins, flavanols, flavanones, flavonols, flavones, and isoflavones. Several beneficial properties have been attributed to these dietary compounds, including antioxidant, anti-inflammatory, and anticarcinogenic effects.
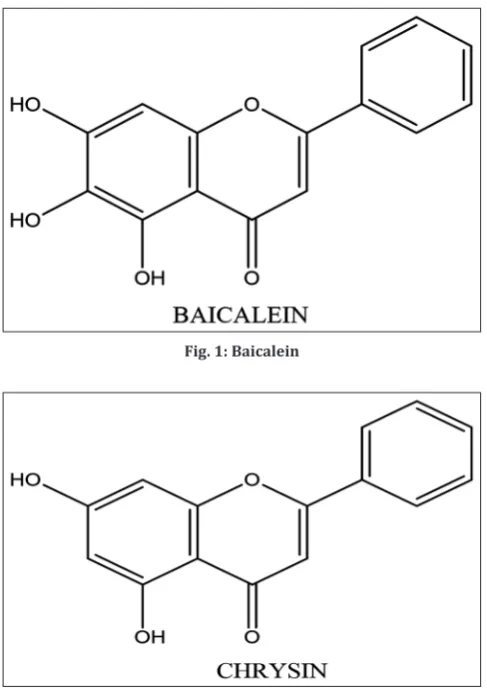
Baicalein chemically known as 5, 6, 7,-trihydroxyflavone, with molecular formula C15H10O5, whose molecular weight is 270.24 g/mol. Baicalein is a flavone, a type of polyphenolic flavonoid, that is extracted from the roots of Scutellaria baicalensis and Scutellaria lateriflora that have a wide variety of health benefits. It is primarily used in Asian countries as an herbal supplement. Baicalein inhibits the action potential of the neurons that raise anxiety. In mice, baicalein produces anxiety-lowering effects without causing drowsiness or muscle relaxation [1-2]. Baicalein was shown in Figs. 1 and 2.
In developing countries, where the challenge of substandard drugs and drug counterfeiting is enormous, there is the need for methods which are accurate, cost-effective, easy to use, rapid, and require the use of non-sophisticated equipment to facilitate easy identification and quantitation of the active components in multicomponent drugs and formulations. The main objective of this work is to develop and validate a new, simple, accurate, linear, precise, specific, robust, rugged, and cost-effective reversed-phase high-performance liquid chromatography (RP-HPLC) assay method for simultaneous estimation of baicalein and
chrysin. Literature survey revealed that several methods were used to analysis of baicalein and chrysin, in formulations, human urine, and human blood serum. These methods include simultaneous estimation of assay in a single method. The aim of this study is performing very simple method in terms of mobile phase and program to analyze baicalein and chrysin in API drugs.
METHODS
Instrument
Chromatographic separation was performed with HPLC having waters, equipped with 2695 with photodiode array detector (PDA). Chromatograms and data were recorded by means of Empower software.
Chemicals and reagents
Acetonitrile and methanol were procured from the Merck.
Stationary phase
Analytical column: Hypersil BDS C18 column (150 mm ×4.6 mm ×5.0 µm) was used.
Mobile phase
Mix the 55 volumes of water and 45 volumes of acetonitrile.
Diluent
Mix the 60 volumes of acetonitrile and 40 volumes of methanol. © 2018 The Authors. Published by Innovare Academic Sciences Pvt Ltd. This is an open access article under the CC BY license (http://creativecommons. org/licenses/by/4. 0/) DOI: http://dx.doi.org/10.22159/ajpcr.2018.v11i1.21174
Preparation of standard solution
About 50 mg of each baicalein and chrysin standards were accurately weighed and transferred in a 50 mL volumetric flask and dissolved in 30 mL of diluent and made up with diluent. Take 5 mL of this solution into 100 mL of diluent was added. Finally, to obtained 0.05 mg/mL of baicalein and chrysin standard solution.
Preparation of sample solution
About 50 mg of each baicalein and chrysin samples were accurately weighed transferred in a 50 mL volumetric flask and dissolved in 30 mL of diluent and made up with diluent. Take 5 mL of this solution into 100 mL of diluent was added to obtain 0.05 mg/mL of baicalein and chrysin sample solution.
Chromatographic conditions
The established chromatographic conditions included a mobile phase of water and acetonitrile (55:45 v/v), a hypersil BDSC18 (150×4.6 mm ×5 µm,) stationary phase, and a flow rate of 1 mL/min. The wavelength of detection was 268 nm, and mode of elution was isocratic. The temperature was kept constant at 25°C. Injection volume was 20 µl. These conditions gave the best resolution of peaks and separation of components.
Method validation
A full method validation was performed according to guidelines set by the USFDA and ICH [3-5]. The validation of this procedure was performed to evaluate the method in terms of specificity, system suitability, method precision, linearity, accuracy, solution stability, ruggedness, and robustness [6-7].
Specificity
Equal volume (20 µl) of standard preparation and test preparation
System suitability
Equal volume (20 µl) of standard preparation was injected into the chromatograph. Chromatograms were recorded and measured the responses for major peaks.
Method precision
Equal volume (20 µl) of six different standard preparation solutions was injected into the chromatograph. Chromatograms were recorded and measured the responses for major peaks.
Linearity
Equal volume (20 µl) of standard preparation was injected at different concentration of 25–150% into the chromatograph. Chromatograms were recorded and measured the responses for major peaks.
Accuracy
It was obtained by recovery studying using the standard addition method, and equal volume (20 µl) of accuracy at 50%, 100%, and 150% solutions was injected into the chromatograph. Chromatograms were recorded and measured the responses for major peaks.
Solution stability
It was obtained by solution stability study using the standard prepared solution. 20 µl of initial, after 4 h, 6 h, 8 h, 12 h, and 24 h sample solutions were injected into the chromatograph. Chromatograms were recorded and measured the responses for major peaks.
Ruggedness
Equal volume of standard preparation was injected into the chromatograph by two different analysts in two different days. Chromatograms were recorded and measured the responses for major peaks.
Robustness
It is a method parameter study. Equal volume of standard preparation was injected into the chromatograph by the change of two method parameters. Chromatograms were recorded and measured the responses for major peaks.
RESULTS AND DISCUSSION
Method development and optimization mobile phase selection
Preliminary studies with several solvent systems were performed to select the most effective solvent system for the separation of the flavones. The selection of these solvents as possible mobile phases depended on factors such as cost of solvents, polarities of solvents and that of the analytes of interest, and the solubility of the analytes. Solvents such as water methanol, acetonitrile, as well as combinations of these solvents were tried. The mobile phase of water and acetonitrile was tried in different proportions. However, an isocratic mixture of water and acetonitrile in the ratio of 55:45; v/v was chosen as the mobile phase because it produced the best resolution of peaks, peak symmetry, and separation of all components within the least retention times. The retention times are 2.42 min for Baicalein and 4.73 min for Chrysin.
Stationary phase selection
The polarities of the analytes of interest were taken into consideration when choosing the stationary phase. As the drug molecules are polar or moderately polar, reversed-phase stationary phases were tried. A Hypersil BDS C18 reversed phase column (150×4.6 mm× 5.0 µm) was chosen to reduce the time of interaction between the stationary phase and the analytes. This helped to reduce analysis time as there is reduced affinity of the analytes for the stationary phase and increased interaction of the analytes with the mobile phase.
Wavelength selection
In simultaneous estimation of two flavones, isobestic wavelength is used. Standard solution of baicalein was prepared by accurately
Fig. 1: Baicalein
diluent and prepare 50 µg/mL of solution by diluting 2.5–50 mL with diluent. Moreover, a standard solution of chrysin was prepared by accurately weighed 50.0 mg and transferred into 50 mL volumetric flask and dissolved in 30 mL of diluent, and then, dilute up to the mark with diluent and prepare 50 µg/mL of solution by diluting 2.5–50 mL with diluent. The wavelength of maximum absorption (λmax) of the drug of 50 µg/mL solution in diluent was scanned using PDA within the wavelength region of 200–400 nm against diluent as blank. The λmax was found to be 271 nm for Baicalein, 263 nm for Chrysin, and finally, 268 nm was selected for the combination of two flavones, and the peak purity is also passed. Peak purity graph is shown in Fig. 3.
Method validation
Specificity
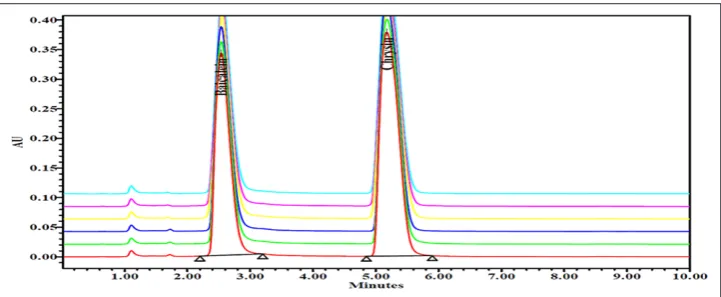
Peak purities higher than 99% were obtained for two flavones in the chromatograms of sample solutions depicting that the method was very specific to the two flavones under consideration. There were no interfering peaks on the retention times of the flavones in the presence of excipients. This was very evident in the chromatograms of the sample (Fig. 4).
System precision
0.05 mg/mL of standard solution was prepared to calculate the precision for the developed method. The prepared solution was injected into
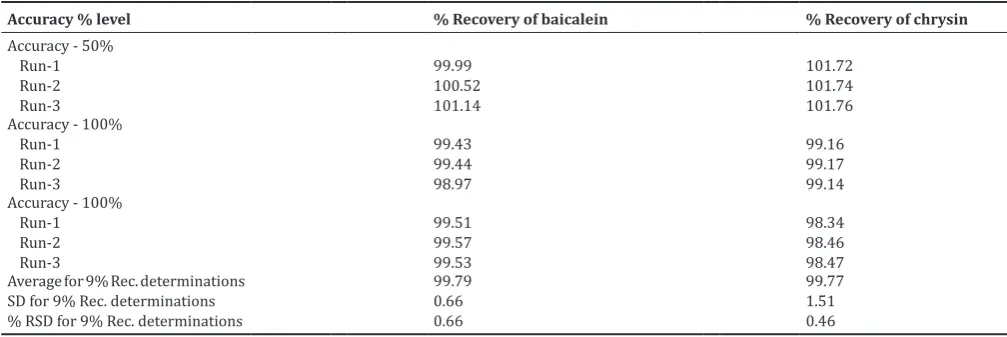
injector (n=6) at the same concentrations and same chromatographic conditions. The chromatograms were recorded. The values are given in Table 1. Relative standard deviation (% RSD) for the values calculated is 0.32% for baicalein and 0.31% for chrysin. Hence, the developed method shows precision. The chromatograms are shown in Fig. 5.
Method precision
0.05 mg/mL of six different standard solutions were prepared to calculate the precision for the developed method. The six prepared solutions were injected into injector (n=1) at thr same concentrations and same chromatographic conditions. The chromatograms were recorded. The values are given in Table 2. % RSD for the values calculated is 0.60% for baicalein and 0.33% for chrysin. Hence, the developed method shows method precision. The chromatograms are shown in Fig. 6.
Linearity
Regression analysis of the standard calibration graphs was used to determine the linearity of the developed method. The results obtained showed that the method is linear for the two flavones in the range of 12.5–75 µg/mL for baicalein and chrysin, respectively, with their coefficient of correlation (r2) all approximately equal to 1.00 (r2=0.999). The linearity graphs and results are presented in Fig. 7 and Table 3.
Fig. 3: Peak purity chromatograms of (a) baicalein and (b) chrysin
a b
Fig. 4: Specificity chromatograms of (a) blank, (b) baicalein, (c) chrysin, and (d) spiked
a
c
b
Accuracy
The accuracy of the method was determined by studying recovery at three different concentrations (50%, 100%, and 150%) for two flavones, by triplicate analysis (n=3). Samples of known concentration (reference standard solutions) were analyzed, and the measured values, from the respective peak areas, were compared with the true values. The recovery was found to be within acceptable range (100±2%), and the % RSD was also passed for all 9 determinations (NMT 2.0%). The results are summarized in Table 4.
Solution stability
Standard and sample solutions of two flavones were stored in a capped volumetric flask on a laboratory bench under normal lighting conditions for initial, 4 h, 6 h, 8 h, 12 h, and 24 h were injected (n=2) into the chromatograph. These results shown to be stable with no significant change in progesterone concentration during this period. The % assay of each period should not differ by more than ± 0.5% to the initial assay value. The chromatograms and data are summarized in Fig. 8 and Table 5.
Ruggedness
Ruggedness of the method was evaluated by performing the sample analysis in six replicates using different analyst on different days. System suitability of the standard solution was checked at each day and each analyst and data were found to be within the acceptable range. The % RSD values was <2.0%. This indicates that the method adopted is rugged. The data of ruggedness were summarized in Table 6.
Robustness
Robustness of the method was investigated by varying the instrumental conditions such as the mobile phase change (± 2.0 volumes) and column flow change (± 0.1 mL/min), system suitability of the standard solution was checked at each variable condition, and data were found to be within the acceptable range (% RSD NMT2.0). The data of ruggedness were summarized in Table 7.
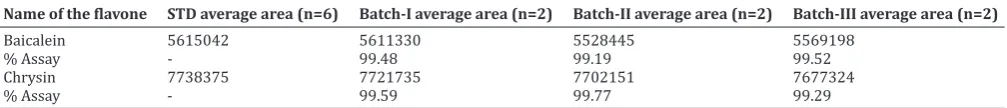
Batch analysis
Prepared about 0.05 mg/mL of baicalein and chrysin standard solution and 0.05 mg/mL of three different batches of baicalein and chrysin API sample solution. The % assay of each batch on as it is basis should be within the limit (98.0–102%). The data are summarized in Table 8.
CONCLUSION
An accurate, simple, linear, specific, and precise RP-HPLC assay method to estimate the simultaneous assay quantification of baicalein and chrysin has been developed and validated. In this method, solid buffers are not used. Hence, the column goes for the longer periods. The simplicity of the method allows for application in laboratories that lack sophisticated analytical instruments such as LC–MS and GC–MS. These methods are complicated, costly, and rather time consuming than a simple HPLC-PDA method. The assay was linear from 12.5 µg/mL to 75 µg/mL. The recovery was found to be within acceptable range (100±2%), and the %RSD was NMT 2.0% for all 9 determinations, as per ICH guideline. Thus, the proposed HPLC assay method can be successfully applied for the routine quality control analysis of baicalein and chrysin, and, also useful for formulation analysis of baicalein and chrysin.
Table 1: System precision data for baicalein and chrysin
S. No. Baicalein Chrysin
RSD: Relative standard deviation, SD: Standard deviation
Table 2: Method precision data for baicalein and chrysin
S. No. Baicalein Chrysin
Preparation-1 5587492 7733816
RSD: Relative standard deviation, SD: Standard deviation
Table 3: Linearity data for baicalein and chrysin
Concentration (µg/ml) Area of baicalein Area of chrysin
12.5 (25) 1695953 2478657
Correlation coefficient (r2) 0.999 0.999
Table 4: Accuracy data for baicalein and chrysin
Accuracy % level % Recovery of baicalein % Recovery of chrysin
Accuracy - 50% Run-1 Run-2 Run-3
99.99 100.52 101.14
101.72 101.74 101.76 Accuracy - 100%
Run-1 Run-2 Run-3
99.43 99.44 98.97
99.16 99.17 99.14 Accuracy - 100%
Run-1 Run-2 Run-3
99.51 99.57 99.53
98.34 98.46 98.47 Average for 9% Rec. determinations
SD for 9% Rec. determinations % RSD for 9% Rec. determinations
99.79 0.66 0.66
99.77 1.51 0.46
Fig. 7: Linearity graph for baicalein and chrysin
Fig. 6: Method precision% relative standard deviation chromatogram of baicalein and chrysin
Fig. 8: Solution stability graphs for baicalein and chrysin, (a) initial, (b) 4 h, (c) 6 h, (d) 8 h, (e) 12 h, and (f) 24 h
a
d
b
e
c
Table 5: Solution stability data for baicalein and chrysin
Flavones Standard area Initial 4 Sh 6 h 8 h 12 h 24 h
Baicalein 5575257 5604818 5625919 5669094 5574019 5551400 5635463
% Assay - 99.71 99.89 99.83 99.46 99.45 99.43
Chrysin 7762559 7759663 7744563 7777477 7757702 7771151 7812912
% Assay - 99.76 99.65 99.87 99.80 99.75 99.66
Table 6: Ruggedness data for baicSalein and chrysin
Name of
flavone Day‑1%RSD Day‑2 Analyst‑1 Analyst‑2
Analyst‑1 % RSDAnalyst‑2 % RSDAnalyst‑1 and 2 % RSDAnalyst‑1 % RSDAnalyst‑2 %RSDAnalyst‑1 and 2 %RSDDay‑1 and 2 % RSDDay‑1 and 2
Baicalein 0.72 0.84 0.80 0.89 0.74 0.75 0.68 0.83
Chrysin 0.30 0.42 0.30 0.38 0.30 0.35 0.26 0.38
Table 7: Robustness data for baicalein and chrysin
Parameter Baicalein Chrysin
Average
area (n=6) % RSD Average area (n=6) % RSD
Flow rate (mL/min)
0.9 5935407 0.41 8512705 0.04
1.0 5575257 0.32 7762559 0.31
1.1 5051099 0.63 7057308 0.04
Mobile phase change 53:47
55:45 57:43
5528230 5575257 5492531
0.44 0.32 0.18
7826856 7762559 7847002
0.06 0.31 0.04
Table 8: Batch analysis data for baicalein and chrysin
Name of the flavone STD average area (n=6) Batch‑I average area (n=2) Batch‑II average area (n=2) Batch‑III average area (n=2)
Baicalein 5615042 5611330 5528445 5569198
% Assay - 99.48 99.19 99.52
Chrysin 7738375 7721735 7702151 7677324
% Assay - 99.59 99.77 99.29
ACKNOWLEDGMENT
The author expresses sincere thanks to the Principal and Head of the Chemistry Department, BEC College, for excellent guidance and encouragement.
REFERENCES
1. Wang F, Xu Z, Ren L, Tsang SY, Xue H. GABA A receptor subtype selectivity underlying selective anxiolytic effect of baicalin. Neuropharmacology 2008;55:1231-7.
2. Anandhi R, Annadurai T, Anitha TS, Muralidharan AR, Najmunnisha K, Nachiappan V, et al. Antihypercholesterolemic and antioxidative effects of an extract of the oyster mushroom, Pleurotus ostreatus, and its major constituent, chrysin, in triton WR-1339-induced hypercholesterolemic rats. J Physiol Biochem 2013;69:313-23.
3. ICH, Q2A, Harmonized Tripartite Guideline, Validation of analytical Procedure Methodology. Geneva: IFPMA, Proceedings of the International Conference on Harmonization; 1994.
4. ICH Harmonized Tripartite Guideline. Validation of Analytical Procedures: Text and Methodology; 2005.
5. ICH Q2B, Harmonized Triplicate Guideline. Validation of Analytical Procedure Methodology. Geneva: IFPMA, Proceeding of the International Conference on Harmonization; 1996.
6. Bhamre PR, Rajput SJ. Development of HPLC and chemometric assisted spectrophotometric method for the simultaneous determination of five active ingradients in cough and cold tablets and their application to dissolution study. Int J Pharm Pharm Sci 2016;8:33-40.