R E S E A R C H
Open Access
Designing UAV-aided emergency
networks for large-scale disaster scenarios
Margot Deruyck
*, Jorg Wyckmans, Wout Joseph and Luc Martens
Abstract
Today’s wireless communication networks are very reliable. However, in case of a disaster, these networks can be overwhelmed by a tremendous amount of requests which they can not cope with. We propose a deployment tool for UAV (unmanned aerial vehicle)-aided emergency networks for such disaster scenarios. By using UAVs, femtocell base stations will be brought to and hovered at their assigned location. We applied this deployment tool on a realistic disaster scenario in the city center of Ghent, Belgium. The results are very promising although a large amount of drones (>1000 type 1 or>370 type 2 drones) is required to provide full coverage for 1 h. Halving the user coverage results in 1.8 to 2 times less drones. More effectively is to increase the drone’s fly height. A 10-m higher fly height can result in a reduction up to 13%. However, above 100 m, the influence is not significant any more. Decreasing the user’s service level has no significant influence on the number of required drones for the considered scenario. Furthermore, a prediction model for the number of required drones based on the intervention duration and the user coverage is proposed.
Keywords: 5G, Deployment tool, Disaster, Drone, Emergency network, UAV, Unmanned aerial base stations
1 Introduction
Nowadays, we have a tremendous trust in our wire-less telecommunication networks. Through our mobile phones, we can contact almost the whole world. Our trust is even so high, that in case of an emergency, one of the first things we do is to pick up our mobile phones. How-ever, when a major disaster affects hundreds of people, the wireless access network can quickly become saturated. A few years ago, in August 2011, the annual Pukkelpop music festival in Belgium, one of Europe’s largest out-door festival, got hit by a severe storm. Some of the stages collapsed, trees were uprooted, and tents were flattened only in a few minutes, unfortunately causing some deaths and many injuries. The news quickly reached the national media causing an enormous surge of con-nectivity as people tried to connect each other about their safety and whereabouts. The wireless network in the direct area of the festival went completely down, resulting in even more panic. Since the penetration of the smart-phone was not that high, yet at the moment of time,
*Correspondence:[email protected]
Department of Information Technology, IMEC - Ghent University - WAVES, Technologiepark-Zwijnaarde 15, B-9052 Ghent, Belgium
only data communication through the social media was possible, but calling and sending standard texts were no longer possible. Almost 5 years later, in March 2016, Brussels got hit by a terror attack. In Brussels, the net-work went completely down. Even the emergency services’ network was no longer available, and they had to coordi-nate their actions through WhatsApp. Also, in big parts of the country, phone calls were no longer possible. The examples mentioned above are of course disasters that happened on a rather large scale, but even on a smaller scale, like for example during a traffic jam on the high way, the network can become locally saturated by peo-ple letting others know they will be running late. Due to the emergence of various UAV (unmanned aerial vehicle) types, differing in cost, robustness, behavior, carrying per-formance, etc., the question was raised whether or not these UAVs could address this problem and provide a temporary solution. Small base stations can be mounted on this UAVs, so-called unmanned aerial base stations (UABSs), in order to rapidly deploy an emergency ad hoc network [1].
The goal of this paper is to investigate the feasibility and performance of a UAV-aided emergency network in case of a large-scale disaster. To this end, we propose
a deployment tool for a UAV-aided emergency network to provide user coverage in case of a large-scale disaster scenario. LTE (Long-Term Evolution) femtocell base sta-tions will be mounted on UAVs or drones and brought to its assigned location. The novelty of our approach is the design of such a network while accounting for the drones’ specifications (such as the battery life time, the fly time), the user requirements, and a 3D model of the consid-ered environment. To the best of the authors’ knowledge, such a deployment tool has not been proposed before. Besides the novel deployment tool, other contributions of this study are (i) evaluating the performance of a UAV-aided network in a realistic large-scale disaster scenario and (ii) providing prediction tools for future UAV-aided emergency networks for different scales of disaster.
The outline of this paper is as follows. Section 2 dis-cusses the related work on UAV-aided networks. Section3 describes the methodology, the considered scenario, and the algorithm behind the deployment tool. In Section4, various results obtained by simulations with the deploy-ment tool are discussed for a realistic large-scale disaster scenario in the city center of Ghent, Belgium. If applicable, a prediction model or guidelines for UAV-aided emer-gency networks are proposed based on the found results. Finally, Section5summarizes our conclusions.
2 Related work
With the emergence of UAVs and their broad range of applications, many studies already address the pos-sibility to provide wireless connectivity through UABSs [2–4], although not necessarily for a disaster scenario. The approaches for the optimal positioning of these UABSs can largely be divided into two groups [5]. On the one hand, the measurement-based approaches use the experienced RSSI (received signal strength indication) or signal-to-noise ratio (SNR) [5]. On the other hand, the model-based approaches determine the most optimal location based on a known model of the target environ-ment [5]. Our tool can be identified as a model-based approach. Although many of the model-based approaches have very promising results, they often use the UABSs as a communication relay node, rather than providing directly service to the end user [5–7]. A disaster scenario, like ours, is addressed by [1,8–10]. However, [8] offers a mes-sage communication system service through UABSs for electrical vehicles instead of providing service to the end user. Their network does not have to address the same throughput as our emergency network. The approach of [9] is similar as ours, but it does not account for 3D infor-mation (such as buildings) in the environment. Further-more, it is based on the behavior of winged UAVs which have to follow a certain trajectory instead of a helicopter drone which hover over a certain location. The BAHN (broadband and UAV-assisted heterogeneous network) of
[1] consists of various UAV types such as gliders, quad-copters, and balloons and focuses on the improvement of throughput coverage, but it does not allow to deter-mine the most optimal locations of these UAVs. The same reason applies to the study of [10]. Ktari et al. [11] address the resilience of a PSN (public safety network). However, a PSN provides only communication for pub-lic services related to the popub-lice, firefighter, and medical assistance. Lambert et al. [12] investigate the network’s performance offered to the user when only a limited part of the network infrastructure is available, but it does not consider the possibility of using drones to provide ser-vice to the uncovered users. The approaches proposed in [13–15] are similar to ours. However, [13,14] both focus only one UABS that follows a certain path to provide service to non-covered or unsatisfied users (not neces-sarily an emergency situation). Mozaffari et al. [15] con-sider a multi-UABS network but solve the problem in a theoretical way, while our approach considers a realistic environment and scenario.
When deploying a UABS network next to a terrestrial network, the interference impact between the ground and UABS network should be considered as been done in [4, 16, 17]. Furthermore, the management of the UABS network itself is also an important issue as discussed in [18–20]. However, this is beyond the scope of this study.
3 Methodology
3.1 Deployment tool for UAV-aided network
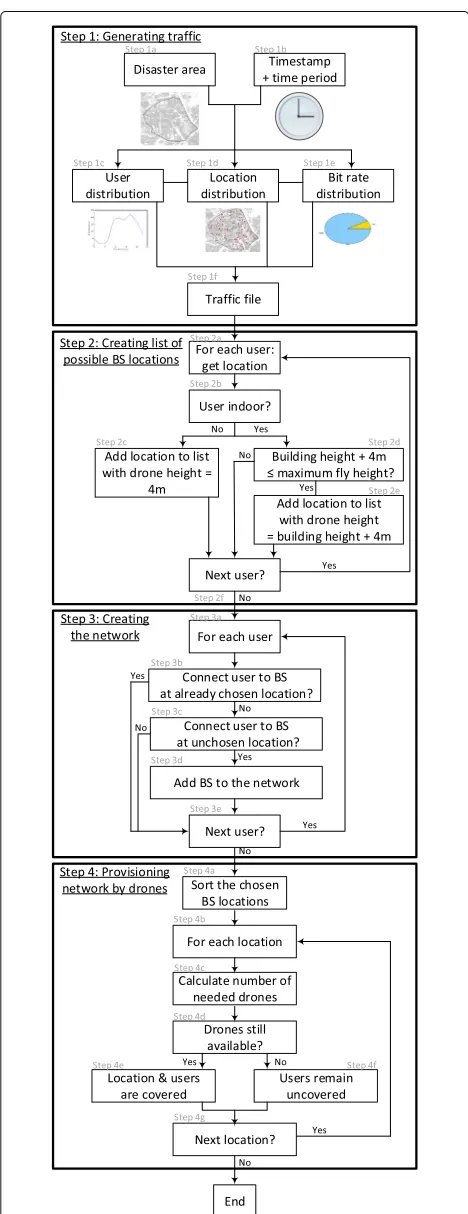
As mentioned above, we have developed an algorithm for deploying UAV-aided networks. This algorithm is imple-mented in Java. Figure1shows the different steps of the algorithm which can be divided into four parts. In the first part, we generate the realistic user traffic for which the network will be designed. Second, a list of possible base station locations is determined. Based on this list, we develop the actual network in the third step by selecting the most optimal locations for the base stations. Finally, we calculate which of these locations can be covered for the predefined period based on the number of available drones and required users to be served. We will now discuss each part in detail.
3.1.1 Generating user traffic
Fig. 1Flow diagram of the algorithm for developing drone-based wireless access networks
we will explain below. Note that the shapefile format only contains data about the buildings not about the vegetation in the considered area. Second, the time the disaster hap-pened, along with the time period we have to maintain the emergency network, has to be provided (Step 1b). Based on those two inputs, the area and the time stamp, the user distribution allows us to determine the number of active users, and thus the number of users to serve, in the dis-aster area (Step 1c). These users are then divided over the whole area by using the location distribution (Step 1d). In addition to the location, a bit rate requirement will be assigned to each user (Step 1e). The different distributions (Steps 1c, 1d, and 1e) here considered can be found in Section3.5.
3.1.2 Creating a list of possible base station locations Once we know the user traffic for which the network will be developed (Step 1f ), we have to define the possible locations for the base stations. This list is based on the user locations, since we assume that a drone can be placed above each user (Step 2a). The advantage of such a strat-egy is that there are no potential base station locations situated in those parts of the disaster area where no activ-ity is taking place. Note that a user is unable to connect to the base station positioned above him- or herself. How-ever, he or she will be able to reconnect through a base station stationed above a neighbor. An important issue we have to account for when creating this list is whether or not a user is indoors (Step 2b). We assume that the drone flies 4 m above the outdoor user (Step 2c) and 4 m above the building in which the indoor user is present (Step 2d). In the latter case, only those locations resulting in a lower fly height than the maximum allowable one will be con-sidered as feasible (Step 2e). When all user locations are analyzed (Step 2f ), we can proceed with the design of the actual network. Note that the user locations are only used to provide an initial set of locations to the algorithm. In case the user locations are unknown, one can generate such a list by using a uniform distribution over the target area.
3.1.3 Designing the network
maximum allowable path loss) and that can still offer the bit rate demanded by this user. For the path loss calcu-lations, we distinguish between LoS (line-of-sight) and nLoS (non-line-of-sight) communication. Since we have all 3D information available about the buildings in the environment (see part 1 of the algorithm), we can easily determine if there is an obstruction between the user and the base station.
3.1.4 Provisioning the network by drones
Once all users are reconnected through one of the base stations mounted on a drone (Step 3e), we take into account the number of available drones during the last stage of our algorithm. The previous step (Step 3) pro-vides us a list of the selected base station locations for the network. This list is now ordered according to the num-ber of users that is served by the base station (Step 4a). In this way, we want to ensure that the locations serving the highest number of users are provisioned first. Next, we calculate for each location (Step 3b) how many drones are needed to provision this location during the predefined period. The number of required drones depends on the drone’s flight time to and from the facility and its assigned location and the power usage of both the drone and the femtocell base station mounted on this drone (Step 3c). If the required number of drones is still available at the facility (Step 3d), the location and the users connected to the base station at this location are marked as cov-ered (Step 3e), and the status of the facility is updated. Otherwise, the users will unfortunately remain uncovered (Step 3f ). Note that when a user moves during a call via a UABS, a hand over procedure has to be triggered like it is currently the case in the terrestrial network.
3.1.5 Complexity of the algorithm
As mentioned above, Step 1 of the algorithm (Fig.1) con-sists of generating the user traffic, meaning that a location and bit rate have to be assigned to each user. This results in a complexity of O(n) with n the number of the user active in the area for the considered time stamp. Step 2 creates the initial list of possible UABS locations. As dis-cussed in Section3.1.2, a UABS can be located above each user. We also need to calculate the fly height of the UABS (Steps 2d and 2e). If a user is indoor, we have to iterate over the buildings in the environment until the correct building is found. This results in a worst case complexity ofO(nk)withkthe number of buildings in the environ-ments and assuming that all users are indoor which is in reality of course not the case. In Step 3, the network is designed by assigning each user to a UABS. Worst case scenario, we have to iterate over all possible UABSs to find the most appropriate UABS for a single user. Furthermore, we have to determine whether a user is LoS or nLoS of a certain UABS. This results in a worst case complexity of
O(nmk)withmthe number of possible UABS locations. Improving the complexity can easily be done by adding some extra code to the package dealing with the shapefile format, since we have only used an on-the-shelf package.
3.2 Drone types
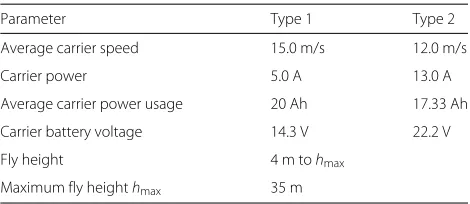
In general, we can divide UAVs or drones into two types: helicopter drones and winged drones [21–23]. The heli-copter drone uses propellers to fly and has a similar design and behavior as helicopters. The winged drone on the other hand uses wings instead of propellers, resulting in a similar design, and thus similar behavior, as an airplane. Although it is possible to mount a femtocell base station on both types of drones, we prefer to choose the heli-copter type. Due to its design, the winged drone has to move constantly, while the helicopter drone can hoover in one location for a certain period, similar as the behavior of a plane versus a helicopter. The fact that the latter can stay on one particular location makes it much more suit-able for our scenario. As mentioned above, users can only be connected to the base station mounted on the drone when the drone is not moving. As the results are very dependent on the drone’s specifications and various types of helicopter drones with various specifications exist, two types are considered for this study. Table 1 shows the specifications of the considered drones. The first type is an off-the-shelf drone, affordable for the general public [24]. It has a maximum fly time of 15 min (without load). From now on, we will refer to this drone as “type 1.” The other drone is more expensive but is therefore also more advanced [25]. It can carry not only more weight but has also a significant longer flight time than the type 1 drone. We will refer to this drone as “type 2.”
3.3 Femtocell base station
We propose to mount an LTE femtocell base station on a drone because of its small-sized equipment and its low power consumption (12 W) [26]. An alternative for the LTE femtocell base station could be a WiFi access point. However, due to the uncontrolled nature of the unli-censed band in which WiFi operates, a dramatically poor throughput might be obtained when multiple users are
Table 1Technical specifications of the considered types of drones
Parameter Type 1 Type 2
Average carrier speed 15.0 m/s 12.0 m/s
Carrier power 5.0 A 13.0 A
Average carrier power usage 20 Ah 17.33 Ah
Carrier battery voltage 14.3 V 22.2 V
Fly height 4 m tohmax
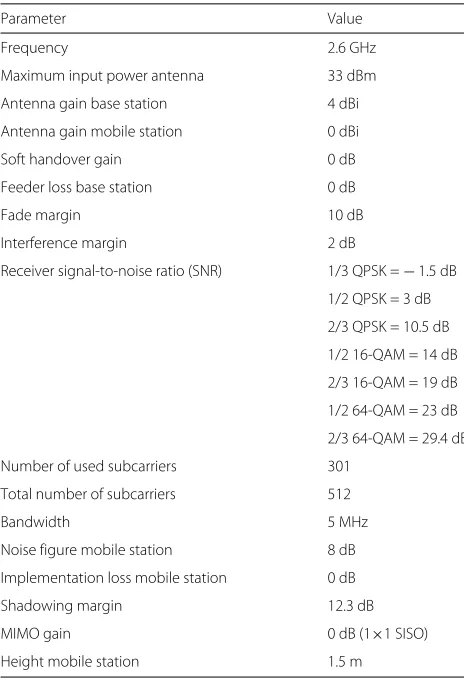
competing for the same resources. Besides this, WiFi does not handle slow moving users in the way LTE does [27]. Table2summarizes all the link budget parameters for the considered LTE femtocell base station [26]. The Walfish-Ikegami path loss model is used to predict the path loss experienced by the users from the base station [28].
3.4 Mathematical models 3.4.1 Coverage of the UABS
As discussed above, to assign a user to a certain UABS, the base station should be able to offer the bit rate required by the user and PL< PLmax(with PL the path loss expe-rienced by the user and PLmax the maximum allowable path loss to which a transmitted signal can be subjected while still being detectable at the receiver) (Fig.1, Steps 3b and 3c). To determine the PL, the Walfish-Ikegami path loss model is considered (mathematics can be found in [28]). The maximum allowable path loss PLmax(in dB) is determined as follows [29]:
PLmax=PT+GT+GR−LT−LR−PR (1)
Table 2Link budget parameters for the LTE femtocell base station
Parameter Value
Frequency 2.6 GHz
Maximum input power antenna 33 dBm
Antenna gain base station 4 dBi
Antenna gain mobile station 0 dBi
Soft handover gain 0 dB
Feeder loss base station 0 dB
Fade margin 10 dB
Interference margin 2 dB
Receiver signal-to-noise ratio (SNR) 1/3 QPSK =−1.5 dB
1/2 QPSK = 3 dB
Number of used subcarriers 301
Total number of subcarriers 512
Bandwidth 5 MHz
Noise figure mobile station 8 dB
Implementation loss mobile station 0 dB
Shadowing margin 12.3 dB
MIMO gain 0 dB (1×1 SISO)
Height mobile station 1.5 m
with PT the wireless transmit power (in dBm),GT and
GR are the transmit and receive antenna gains (in dBi),
LT and LR losses occurring at the transmit and receive side (in dB), andPR is the receiver sensitivity (in dBm). Table2 contains all the losses and gains we account for in the link budget. The shadowing margin is determined such that 90% of the locations on the edge of the cell are covered [30].
The performance of the UABS network will be expressed in terms of user coverage UC (in percentage), which is defined as follows:
UC= Nserved
Nactive
(2)
withNserved the users served by the network (UAV
net-work and/or existing infrastructure if still available) and Nactivethe number of users active in the considered area.
3.4.2 Operational time of the UABS
To calculate how long a certain UABS can be operational, we first have to determine the flight timeTflight(in s) from the facility to its assigned location:
Tflight= 2·d
v (3)
withd the distance between the facility and the UABS’s assigned location (in m) andvthe speed of the UAV (in m/s). Furthermore, we need to know how much energy will be consumed by the femtocell base station mounted on the UAV. This power consumption PCBS (in Watt) is defined as follows [26]:
PCBS = PCmp+PCFPGA+PCtrans+PCamp (4)
Pamp =
PT
η (5)
with PCmp, PCFPGA, PCtrans, and PCamp the power con-sumption of, respectively, the microprocessor, the FPGA, the transmitter, and the power amplifier (in W).PTis the transmit power (in W), andηis the efficiency of the power amplifier.
During the flight from and to the facility, the base station is switched off. In this case, only the drone itself is using power. The total available lifetime lf is then calculated by subtracting the power usage of the base station and the carrier from what is leftover of the the available power:
lf=Tflight+
Cbat−3600Tfi ·PCUAV PCBS+PCUAV ·
3600 (6)
withCbatthe capacity of the UAV’s battery (in V).
3.5 Scenario
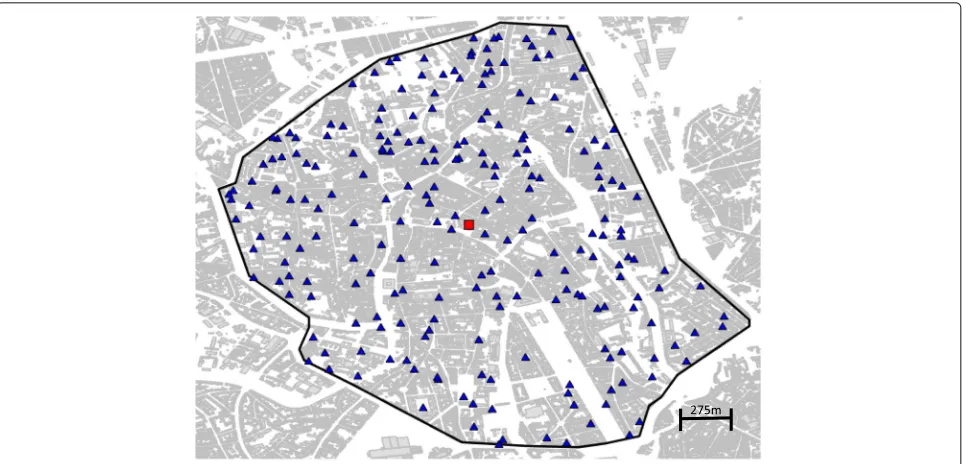
Fig. 2The considered suburban area in Ghent, Belgium (6.85 km2). The blue triangles represent the users as an example for the 5 p.m. time stamp. The red square shows the facility’s location
i.e., 224, is active in this area. This user distribution is based on realistic data from a Belgian mobile operator active in the city center of Ghent [31]. The users are uni-formly distributed over the area [31], meaning that every location (indoor and outdoor) in the area has the same chance to be chosen as a user location. The blue triangles in Fig.2give an example of a possible location distribu-tion. Unless mentioned otherwise, two types of users are active in the area: voice call users (requiring 64 kbps) and data call users (requesting 1 Mbps) [31]. The ratio voice call versus data call users is also obtained from the data received from the operator.
All users present in the area need to be reconnected through the emergency network as we assume that all the existing wireless network infrastructures are down (unless mentioned otherwise). Because the terrestrial network is shut down, we only account for the inter-cell interference between the UABS. The inter-cell interference coming from the terrestrial network is thus not accounted for. The drones are brought to the disaster scene by a truck which we call the facility. The drones will fly from (and to) the facility to (and from) their assigned location. The facility’s location is optimized as it is situated in the heart of the disaster area to minimize the fly time of the drone and maximize its operational time. To determine this location, the mean value of the x-coordinate and y-coordinate of the base stations of the various operators active in the con-sidered area is used. Users will only be able to connect to the drone once it is hovering at its dedicated posi-tion. Table3summarizes the most important assumptions
of the considered disaster scenario (unless mentioned otherwise). Note that our primary goal is to reconnect all the users who are already active. In a real disaster scenario, also idle users will become active, but in this study, we will not consider them so far.
Due to the randomness of the users in the area, the results presented in this study are the 50th (p50) and 95th (p95) percentile determined over 40 independent simula-tions [31].
Note that the management of the drones, i.e., the inter-action with the aircraft, the autonomous flight towards their assigned locations, the physical security of the drones, etc., is beyond the scope of this study. Note also that there will be a delay in service in the first moments in the aftermath of the disaster until the first load of drones is in place. However, this is out of the scope of this study since this delay is highly dependent on the scenario (i.e., the disaster type, location, and environment).
Table 3Summary of the considered disaster scenario (unless mentioned otherwise)
Parameter Assumption
Time stamp 5 p.m.
Number of users to reconnect 224
Bit rate demand 1 Mbps (data) and 64 kbps (voice)
Location facility Heart of the disaster area (optimized)
Intervention duration 1 h
4 Results
4.1 Number of required drones versus intervention duration
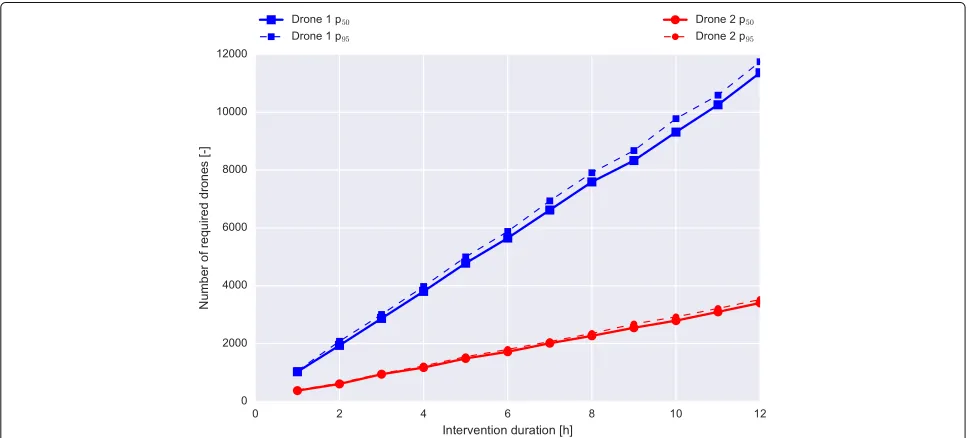
A key parameter for determining the amount of required drones to maintain the emergency network is the intervention duration. The intervention dura-tion is defined here as the time period in which the existing infrastructure is unavailable and an alterna-tive solution should provide coverage to the users. Figure3shows the amount of type 1 and type 2 drones needed to provision the network as a function of the intervention duration when a 100% user coverage is required.
To cover all users, 186 femtocell base stations (and thus 186 base station locations) are required. Note that the most optimal locations are determined based on the spec-ifications of the femtocell base stations as assumed in Section3.3. To provision these 186 locations with drones (and thus femtocell base stations) for the whole interven-tion durainterven-tion of 1 h, 1024 type 1 drones are needed. This means five to six drones are required per location. The average battery life time of a type 1 drone is approximately 874 s based on the power consumption of the femtocell base station and the drone itself. Furthermore, on aver-age, the drone reaches its assigned location after 73.5 s. One type 1 drone can thus provide coverage for approxi-mately 727 s (=874 s−2·73.5 s), which confirms that five type 1 drones are required to cover one location for 1 h. Analogously, 372 type 2 drones are needed to cover the 168 base station locations for 1 h. A type 2 drone has a battery life time of approximately 2636 s (Section3.2).
Although it has a longer battery life time, it flies slightly slower resulting in a travel time of approximately 93.5 s on average. The type 2 drone can thus provide coverage for 2449 s, which means that we need two drones per location for a 1-h intervention. Considering the same intervention duration, we obtained that about three times more type 1 than type 2 drones are needed. The main reason for this higher number is of course the three times larger battery life time. The effect of the slightly slower fly speed of the type 2 drone on the number of required drones is not sig-nificant as can be concluded from the results discussed above.
As one might expect and shown in Fig. 3, the rela-tion between the number of drones and the intervenrela-tion duration is linear. The longer the intervention duration, the more drones are needed per location due to the lim-ited battery life of time of the drone. Quadrupling the intervention duration results in 3.7 times and 3.1 times more type 1 and type 2 drones, respectively. As men-tioned above, a type 1 drone can provide service for 727 s at one location (= 874 s of battery time −147 s travel time). Increasing the intervention duration by 3 h requires thus 15 additional drones per location (=10800 s/727 s). Similarly, for the type 2 drone, seven extra drones (=10800 s / 2449 s) are needed per location for the 3 h more intervention time.
To obtain the results presented in Fig.3, we performed 480 simulations (=12 different intervention durations× 40 simulations) for each type of drone. Based on these sets of samples, we developed a model to predict the num-ber of required drones for a certain intervention period
by OLS (ordinary linear square) regression. The relation between the intervention duration and the number of required drones is statistically significant (pvalue≤0.05), as a p value (Pearson correlation) of 0.0 was found for the association between the intervention duration and the number of drones of both types. The expected number of type 1 dronesDˆ1and type 2 dronesDˆ2as a function of the intervention durationh(in hours) is expressed as follows:
ˆ
D1 = 928.1·h+93.5 (7)
ˆ
D2 = 273.4·h+88.5 (8)
For both equations, anR2of 0.996 is obtained, meaning that we can predict the number of required drones cor-rectly in 99.6% of the cases in the considered environment. Based on the simulation results and the obtained predic-tion equapredic-tions, we conclude that a high number of drones is needed if full user coverage is required in the consid-ered city center. When using type 1 drones, more than 1000 drones are required for an intervention of only 1 h. When using approximately the same amount of type 2 drone, we can provide around 4 h of coverage for the same area. This high number of required drones is of course a major drawback of such an emergency network as it implies a significant investment cost. In the next sections, we investigate which actions can be taken to reduce this number of drones and thus the cost of such an emergency network.
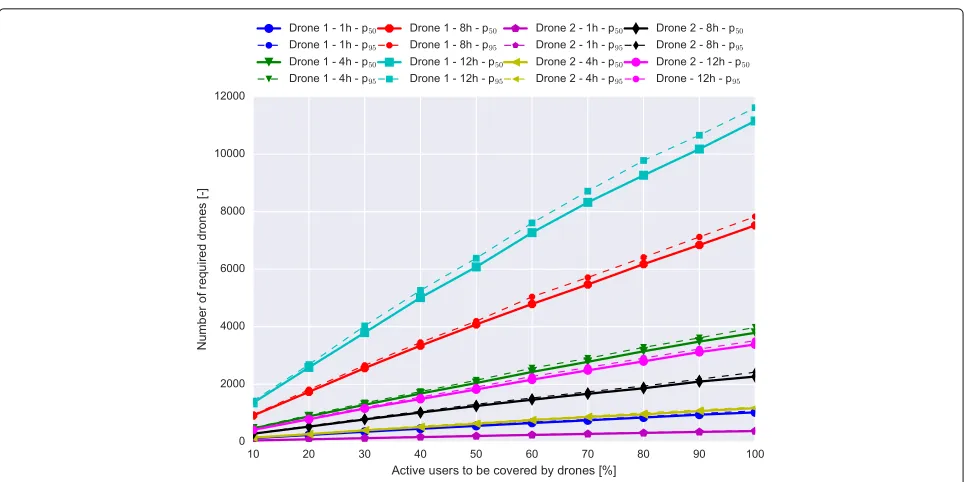
4.2 Number of required drones versus user coverage or when the fixed infrastructure is only partly down As mentioned in Section 3.5, a worst case scenario is considered so far. This means that all the existing infras-tructure is unusable. Furthermore, we also considered the time during the day for which the highest number of users is active in the area. However, in reality, either a part of the existing infrastructure might still be available or an oper-ator can open his WiFi network in order to deflect some of the user traffic from the emergency network. Figure4 presents the number of required type 1 and type 2 drones for four different intervention durations (1, 4, 8, and 12 h) when only a limited amount of users needs to be recon-nected. For example, when we consider a user coverage of 30%, this means that 70% of the users is still covered by the fixed infrastructure.
Figure4 shows that the number of required drones is linearly related to the required percentage of user cover-age. The more users have to be reconnected, the more base stations (and thus also base station locations) we have to use, resulting in a higher amount of drones to provision all these locations for the whole intervention period. Dou-bling the number of users results in 1.8 to 2 times more drones (depending on the considered intervention dura-tion and type of drone). Let us assume a 1-h intervendura-tion.
When a 20% user coverage is required, the network con-sists of 43 different base station locations. As 5 to 6 type 1 and 2 type 2 drones are needed to cover a certain loca-tion during 1 h (see Secloca-tion4.1), this results in a total of 237 type 1 and 86 type 2 drones. When 40% of the users need to be served, 82 base station locations are obtained, resulting in a total of 453 type 1 and 166 type 2 drones. The fact that about two times more base station locations are required to cover twice the number of users is due to the limited coverage of a single femtocell base station.
Besides the intervention duration, it is also important to have a good estimation of the user coverage for which one aims to develop its emergency network. To this end, we developed a prediction model for the number of required drones based on the considered drone type, the predicted number of users to cover, and the intervention duration. This model is determined by applying again OLS regres-sion on the 3200 samples obtained by the simulations performed for the results of Fig. 4 (=four intervention periods × ten user coverage percentages × two drone types). The association between the number of required drones and the number of users to cover is considered to be statistically significant as apvalue of 0.0 is obtained for both the type 1 and type 2 drones. The following equations are obtained for the predicted number of type 1 Dˆ1and type 2 drones Dˆ2, respectively, in relation to the inter-vention durationh(in hours) and the number of users to coveru:
If one considers a small event in the city center of Ghent with 10,000 attendees, Eqs. (9) and (10) predict that 253,420 type 1 and 78,237 type 2 drones are required for a 1-h intervention. Even when using the more advanced type 2 drone, this is still a huge amount of drones. Unfor-tunately, the amount of users to cover and the intervention duration is not something one can completely control. Therefore, in the next sections, we will investigate if we can take some actions on the network level to limit the number of drones.
Fig. 4The number of type 1 and type 2 drones needed to provide a certain percentage of user coverage for an intervention duration of 1, 4, 8, and 12 h.p50andp95represent the 50th and 95th percentile, respectively, determined over 40 simulations
4.3 Number of required drones versus the drone’s fly height
Until now, the drone’s fly height was limited to 35 m (Section3.1) maximum and 4 m minimum. When flying above an outdoor user, a fly height of 4 m was assumed. For an indoor user, a fly height equal to the building height + 4 m was considered. In this section, the drone will fly at a predefined height independent on the fact of the user is indoors or outdoors. However, note however that when the user is indoor and the building is higher than the pre-defined fly height, this location can not be added as a possible location to develop the network.
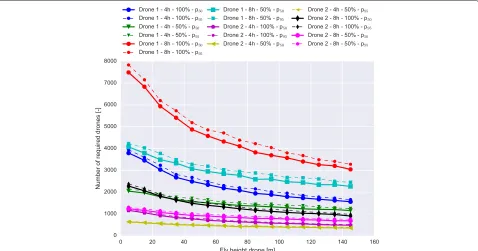
Figure5shows the number of required type 1 and type 2 drones when varying their fly height from 5 to 145 m. Two different intervention durations (4 and 8 h) and two dif-ferent user coverages (50 and 100%) are considered. Based on this figure, we conclude that a higher fly height results in a lower number of required drones. For example, for a 100% user coverage, and an 8-h intervention, the high-est reduction for both drone types, approximately 13%, is obtained when increasing the fly height from 15 to 25 m (6832 versus 5936 for type 1 and 2058 versus 1814 for type 2). This is predominantly due to the higher coverage range of the femtocell base station (81% higher coverage range for 25 m compared to 15 m height) as it is located at a higher height. However, this effect is not unlimited either. Figure5shows that from approximately 100 m height on, the number of required drones starts to saturate and does not decrease anymore. For example, for a 100% user cov-erage and a 4-h intervention, a total number of about
1600 and 500 is obtained for the type 1 and type 2 drone, respectively. The drone’s fly time to reach a height equal or higher than 100 m becomes too large, resulting in only a limited service time. Because of this, more drones are needed to cover each location for the whole intervention duration, thus wasting the advantage of having less drones due to the higher coverage range.
Increasing the drone’s fly height has the highest influ-ence when considering type 1 drones to provide full user coverage for 8 h, while the lowest leverage is obtained when using type 2 drones to provide 50% user coverage for 4 h (13.1 versus 7.8% type 1 and type 2 drones for increas-ing the fly height from 15 to 25 m, respectively). In the latter case, less users have to be covered for the same area. In fact, the distance between two users will be too high to be covered by one single femtocell base station, even after increasing the coverage range by using a higher fly height. Since the relationship between the number of required drones versus the drone’s fly height is a saturated func-tion rather than a linear one, we do not provide predicfunc-tion models for this relationship. We recommend to use the highest possible fly height, preferably around 100 m.
4.4 Number of required drones versus provided service level
Fig. 5The number of type 1 and type 2 drones required as a function of the drone’s fly height for 50 and 100% user coverage and a 4- and 8-h intervention duration.p50andp95represent the 50th and 95th percentile, respectively, based on 40 simulations
scenarios, each with a different bit rate: 12 kbps (text mes-sage), 64 kbps (voice call), and 1 Mbps (data call). The bit rate distribution discussed in Section3 will thus be replaced by one of these bit rates. Each user active in the area will be served with the same bit rate.
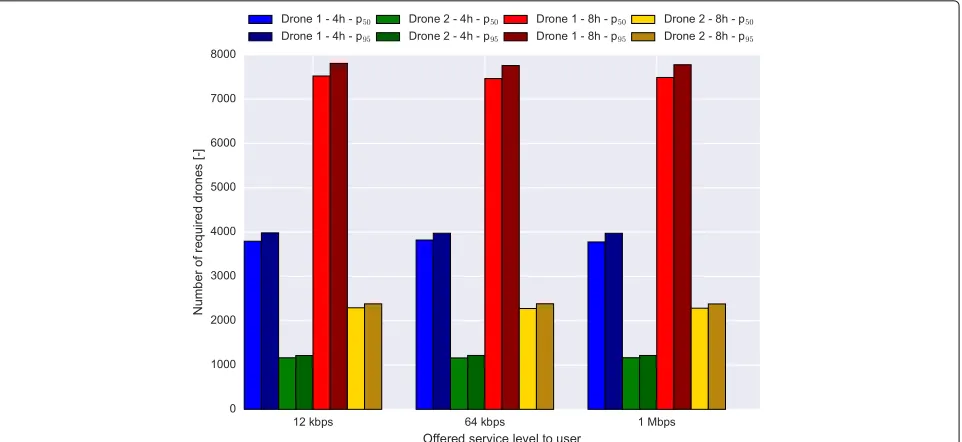
Figure6 gives an overview of the number of required drones for the three offered service levels. Full coverage is assumed and two different intervention durations, 4 and 8 h, are considered. The influence of limiting the user’s service level is not significant. For an 8-h intervention, 7522, 7465, and 7489 type 1 drones (2291, 2275, and 2282 type 2 drones) are required when using a service level of 12 kbps, 64 kbps, and 1 Mbps, respectively. The experi-enced path loss by the user, and thus the coverage range of the base station, is in this scenario the most limiting factor. Assuming a service level of 1 Mbps, about 1.3% of the required femtocell base stations serves more than one user. The maximum number of users that is being served by a single femtocell base station is 7. These results con-firm the conclusion that the coverage range is the most limiting factor for the considered scenario.
As mentioned above, we have access to an unlim-ited amount of drones. This means that the algorithm will just introduce a new femtocell base station in the network whenever the coverage or the capacity of the already added femtocell base stations is saturated. To ver-ify our conclusion, we studied the user coverage when only 1000 drones are available. For an intervention duration of
8 h, a user coverage of approximately 13 and 33.5% was obtained for the type 1 and type 2 drone, respectively, independent of the provided service level. In none of the performed simulations, the capacity of a single femtocell base station is the limiting factor. Therefore, in the future, we should focus on beam-forming techniques in order to increase the coverage range of the drone mounted femto-cell base station and to reduce the interference between these base stations.
5 Conclusion
Fig. 6The number of type 1 and type 2 drones needed to provide full user coverage as a function of the offered service level (bit rate) to the user for an intervention duration of 4 and 8 h.p50andp95represent the 50th and 95th percentile, respectively, based on 40 simulations
case a certain part of the fixed infrastructure is still avail-able or when the operators open their WiFi networks if available. The number of required drones scales also lin-early with the number of users to cover. Another solution to reduce the number of drones is to increase their fly height. By increasing the fly height by 10 m, up to 13% less drones are required to provide full user coverage. How-ever, this effect is not unlimited. From a fly height of 100 m on, the number of required drones does not decrease any-more. We also investigated if reducing the service level provided to the user reduces the amount of drones. In this case, the user would be limited to texting or voice calling only. However, for the considered scenario, changing the service level has no significant influence on the number of drones.
Future work includes a thorough study of the back-hauling possibilities for such an emergency network, beam-forming techniques to improve the coverage range, cost calculations, other types of UAVs, and serving users when the base station (and thus UAV) is mov-ing. In future research, where existing terrestrial infras-tructure is still available, the influence of the inter-cell interference from the ground should be investigated. Accounting for this interference can be done by adding an extra parameter to the link budget proposed in this study.
Funding
Margot Deruyck is a Postdoctoral fellow of the FWOV (Research Foundation -Flanders, Belgium).
Availability of data and materials
The data will not be shared due to confidentiality matters.
Authors’ contributions
JW was responsible for implementing the deployment tool in Java under the supervision of the other authors. MD has processed the data and written the manuscript. WJ and LM have provided general advice and feedback on the manuscript. All authors read and approved the final manuscript.
Competing interests
The authors declare that they have no competing interests.
Publisher’s Note
Springer Nature remains neutral with regard to jurisdictional claims in published maps and institutional affiliations.
Received: 22 November 2017 Accepted: 22 March 2018
References
1. A Merwaday, I Guvenc, inIEEE Wireless Communications and Networking Conference Workshops (WCNCW). UAV assisted heterogeneous networks for public safety communications, (2015), pp. 329–334
2. M Asadpour, B Van den Bergh, D Giustiniano, Hummel KA, Pollin S, Plattner B, Micro aerial vehicle networks: an experimental analysis of challenges and opportunities. IEEE Commun. Mag.52(17), 141–149 (2014) 3. MM Azari, F Rosas, K-C Chen, S Pollin, inIEEE Global Communications
Conference (Globecom). Optimal UAV positioning for terrestrial-aerial communication in presence of fading, (2016)
4. B Van der Bergh, A Chiumento, S Pollin, LTE in the sky: trading off propagation benefits with interference costs for aerial nodes. IEEE Commun. Mag.54(5), 44–50 (2016)
5. P Ladosz, H Oh, W-H Chen, inIEEE International Conference on Unmanned Aircraft Systems (ICUAS). Optimal positioning of communication relay unmanned aerial vehicles in urban environments, (2016), pp. 1140–1147 6. D Orfanus, EP de Freitas, F Eliassen, Self-organization as a supporting
paradigm for military UAV relay networks. IEEE Commun. Lett.20(4), 804–807 (2016)
7. V Sharma, M Bennis, R Kumar, UAV-assisted heterogeneous netowrks for capacity enhancements. IEEE Commun. Lett.20(6), 1207–1210 (2016) 8. K Mase, H Okada, inIEEE 26th Annual International Symposium on Personal,
9. M Mozaffari, W Saad, M Bennis, M Debbah, Efficient deployment of multiple unmanned aerial vehicles for optimal wireless coverage. IEEE Commun. Lett.20(8), 1647–1650 (2016)
10. K Gomez, A Hourani, L Goratti, R Riggio, S Kandeepan, I Bucaille, inEuropean Conference on Networks and Communications (EuCNC). Capacity evaluation of aerial LTE base-stations for public safety communications, (2015), pp. 133–138
11. S Ktari, S Secci, D Lavaux, inIEEE 12th International Conference on Wireless and Mobile Computing, Networking, and Communications (WiMob). Bayesian network modeling for public safety network reliability analysis, (2016).https://doi.org/10.1109/WiMOB.2016.7763174
12. S Lambert, M Deruyck, W Van Heddeghem, B Lannoo, W Joseph, D Colle, M Pickavet, P Demeester, Post-peak ICT: graceful degradation for communication networks in an energy constrained future. IEEE Commun. Mag.53(11), 166–174 (2015)
13. M Deruyck, A Marri, S Mignardi, L Martens, W Joseph, R Verdone, in28th Annual IEEE International Symposium on Personal, Indoor, and Mobile Radio Communications (PIMRC). Performance evaluation of the dynamic trajectory design of an unmanned aerial base station in a single frequency network, (2017)
14. Mozaffari M, Saad W, Bennis M, Debbah M, Unmanned aerial vehicle with underlaid device-to-device communications: performance and tradeoffs. IEEE Trans. Wirel. Commun.15(6), 3949–3963 (2016)
15. M Mozaffari, W Saad, M Bennis, M Debbah, Wireless communication using unmanned aerial vehicles (UAVs): optimal transport theory for hover time optimization. IEEE Trans. Wirel. Commun.16(12), 8052–8066 (2017) 16. MM Azari, Y Murillo, O Amin, F Rosas, M-S Alouini, S Polin, in28th Annual
IEEE International Symposium on Personal, Indoor, and Mobile Radio Communications (PIMRC). Coverage maximization for a poisson field of drone cells, (2017)
17. M Mozaffari, W Saad, M Bennis, M Debbah, inIEEE Global Communications Conference (GLOBECOM). Drone small cells in the clouds: design, deployment and performance analysis, (2015), pp. 1–6
18. Y Zeng, R Zhang, TJ Lim, Wireless communications with unmanned aerial vehicles: opportunities and challenges. IEEE Commun. Mag.
54(5), 36–42 (2016)
19. S Chandrasekharan, K Gomez, A Al-Hourani, S Kandeepan, T Rasheed, L Goratti, L Reynaud, D Grace, I Bucaille, T Wirth, S Allsopp, Designing and implementing future aerial communication networks. IEEE Commun. Mag.54(5), 26–34 (2016)
20. EW Frew, TX Brown, Airborne communication networks for small unmanned aircraft systems. Proc. IEEE.96(12), 2008–2027 (2008) 21. T Reed, J Geis, S Dietrich, in5th USENIX Conference on Offensive
Technologies (WOOT). SkyNET: a 3G-enabled mobile attack drone and stealth botmaster approach attack framework, (2011), p. 4 22. J Valente, D Sanz, A Barrientos, J Del Cerro, A Ribeiro, C Rossi,
An air-ground wireless sensor network for crop monitoring. Sensors. 11(12), 6088–6108 (2011)
23. HT Kung, C-K Lin, T-H Lin, SJ Tarsa, D Vlah, inGLOBECOM Workshops. Measuring diversity on a low-altitude UAV in a ground-to-air wireless 802.11 mesh network, (2010), pp. 1799–1804
24. W Joseph, S Aerts, M Vandenbossche, A Thielens, L Martens, Drone based measurement system for radiofrequency exposure assessment. Bioelectromagnetics.37(3), 195–199 (2016)
25. Microdrones MD4-1000: Robust and powerful UAV (2016).https://www. microdrones.com/en/mdaircraft/md4-1000/. Accessed 20 Jun 2016 26. M Deruyck, D De Vulder, W Joseph, L Martens, Modelling the power consumption in femtocell networks. IEEE Wirel. Commun. Netw. Conf, 30–35 (2012)
27. M Bennis, M Simsek, A Czylwik, W Saad, S Valentin, M Debbah, When cellular meets WiFi in small cell networks. IEEE Commun. Mag.51(6), 44–50 (2013)
28. COST Telecommunications,COST Action 231: digital mobile radio towards future generation systems. (European Commission, Belgium, 1999) 29. E Tanghe, W Joseph, L Verloock, L Martens, H Capoen, K Van Herwegen,
W Vantomme, The industrial indoor channel: large-scale and temporal fading at 900, 2400, and 5200 MHz. IEEE Trans. Wirel. Commun.7(7), 2740–2751 (2008)
30. E Tanghe, W Joseph, L Verloock, L Martens, H Capoen, K Van Herwegen, T Buysschaert, Statistical validation of WLAN range calculated with propagation models for industrial environments by chipset-level received signal strength measurements. IET Sci. Meas. Technol.3(3), 244–255 (2009) 31. M Deruyck, W Joseph, E Tanghe, L Martens, Reducing the power