DEVELOPMENT AND OPTIMIZATION OF TAZAROTENE LOADED SOLID LIPID
NANOPARTICLES FOR TOPICAL DELIVERY
RAJKUMAR ALAND
1*, GANESAN M
2, RAJESWARA RAO P
31Department of Pharmacy, Jawaharlal Nehru Technological University, Kakinada, Andhra Pradesh, India. 2Dr. Reddy’s Laboratories
Limited, Hyderabad, Telangana, India. 3Department of Pharmacy, Andhra University, Visakhapatnam, Andhra Pradesh, India.
Email: [email protected]
Received: 29 December 2018, Revised and Accepted: 27 July 2019 ABSTRACT
Objective: Psoriasis is an unswervingly recurring, inflammatory, autoimmune disorder of the skin, disturbing about 2–5% of the world population.
The main objective for this investigation is to develop and optimize the solid lipid nanoparticles (SLN) formulation of tazarotene for effective drug delivery.
Methods: Tazarotene SLNs were fabricated by hot homogenization followed by the ultrasonication using Taguchi’s orthogonal array with eight
parametersthat could affect the particle size and entrapment efficiency (EE). In view of the outcomes from the examinations of the responses acquired from Taguchi design, three diverse independent variables including sonication time (s), lipid to drug ratio (w/w), and surfactant concentration (%) were carefully chosen for further investigation utilizing central composite design. The lipid dynasan-116, surfactant poloxamer-188, and cosurfactant egg lecithin resulted in better percent drug loading and evaluated for particle size, drug EE, zeta potential, in vitro drug release, and stability.
Results: The prepared nanoformulations were evaluated for different parameters and found to be in an acceptable range. In vitro drug release of
optimized SLN formulation (F1) was found to be 98.12±1.52%, whereas pure drug release was 42.12 after 60 min, and the major mechanism of drug release follows zero-order kinetics release data for optimized formulation (F1) with non-Fickian (anomalous) with a strong correlation coefficient (R2=0.98598) of Korsmeyer-Peppas model. Transmission electron microscopy analysis has demonstrated the presence of individual nanoparticles in spherical shape, and the results were also compatible with particle size measurements. The drug content of tazarotene gel formulation was found to 98.96±0.021%, and the viscosity of gel formulation at 5 rpm was found to be 5.98×10³±0.34×10³ cp. The release rate (flux) of tazarotene across the membrane and expunged skin diverges pointedly, which specifies the barrier nature of skin. The flux value for SLN based gel formulation
(193.454±4.324 μg/cm2/h) was found to be higher than that for marketed gel (116.345±2.238 μg/cm2/h). The higher flux and Kp values of SLN based gel suggest that it might be able to enter the skin easily as compared with marketed gel with an advantage of low interfacial tension of the emulsifier film that ensures an excellent contact to the skin.
Conclusion: From the obtained results, the topically oriented SLN-based gel formulation of tazarotene could be useful in providing effective and
site-specific psoriasis treatment.
Keywords: Tazarotene, Psoriasis, Taguchi design, Solid lipid nanoparticles, Topical gel, Flux.
INTRODUCTION
Solid lipid nanoparticles (SLN) fascinated the researchers during the years in view of different advantages over other colloidal drug delivery systems such as biocompatibility, high drug loading (DL) capacity, possibility of controlled drug release, enhanced bioavailability, improved protection of drug against metabolism, increased drug stability, feasibility of bulk manufacturing and sterilization, less variability in release mechanisms and their kinetics, potential for improved permeability due to lipid and surfactant contents, and ligand-mediated or passive targeting due to their small size through oral, ocular, nasal, dermal, parenteral, and pulmonary routes of administration [1-3]. SLNs are the quickly developing field of nanotechnology with a few potential applications in drug delivery and research. Because of their one of a kind, size-dependent properties, lipid nanoparticles bid the opportunity to develop novel therapeutics [4]. SLNs are used as topical vehicle because of their intrinsic occlusive properties that form a film on skin surface, reducing transepidermal water loss. The increasing of the water content improves the appearance of healthy human skin and boosts the penetration of active through the skin; moreover, the reduced particle size improves surface area and facilitates contact of encapsulated drugs with the stratum corneum [5].
Psoriasis is a chronic T-cell mediated autoimmune inflammatory skin disease with reverting events of inflammation and hyperkeratosis on the skin [6-10]. At present, many researchers attend to development of innovative skin drug delivery systems to improve skin penetration of conventional drugs leading to a reduction of the administered dose and therefore their side effects [11].
Tazarotene, is 6-[2-(4,4-dimethylthiochroman- 6-yl)ethynyl] ethyl nicotinate, a member of a new generation of receptor-selective synthetic retinoids, indicated in the mild to moderate plaque psoriasis disease, acne vulgaris, and photoaging. Dermal safety studies have specified that tazarotene did not demonstrate photoallergic or phototoxic potential [12]. However, the course of treatment which is usually prolonged (weeks or months) may lead to adverse reactions such as pruritus, burning/stinging, and erythema in a significant subset of users. These may often result in the interruption or discontinuation of the treatment regimen. Further, extremely low solubility limits tazarotene incorporation into an acceptable vehicle and its tolerability results in either discontinuation of treatment or poor compliance in patients [13,14].
This current work demonstrates the formulation of tazarotene SLN employing hot homogenization followed by ultrasonication method and © 2019 The Authors. Published by Innovare Academic Sciences Pvt Ltd. This is an open access article under the CC BY license (http://creativecommons. org/licenses/by/4. 0/) DOI: http://dx.doi.org/10.22159/ajpcr.2019.v12i10.31755
central composite design (CCD) comprising 3-factor, 3-level method was utilized for the optimization of the prepared formulations.
MATERIALS AND METHODS Materials
Tazarotene was a kind gift from Dr. Reddy’s Laboratory Ltd., Hyderabad, India. Tristearin (dynasan-118), tripalmitin (dynasan116), and trimyristin (dynasan-114) were procured from Sigma-Aldrich Chemicals, Hyderabad, India. Poloxamer-188 and Egg Lecithin were gifted by Aurobindo Labs, India. All other chemicals and solvents were of analytical grade and were used without further purification.
Dialysis Bag (Molecular weight cut off 10 kDa) was procured from HiMedia Pvt., Ltd., Trehalose dihydrate was acquired from Sigma Chemicals Co. All other chemicals used were of analytical grade or spectroscopic grade.
Characterization by differential scanning calorimetric (DSC) Accurately weighed amount (5 mg) of drug sample to be analyzed was taken in the pierced DSC aluminum pan and scanned in the temperature range of 50–230°C. The heating rate was 20°C/min and thermogram of drug was obtained.
Preparation of tazarotene loaded SLN
Tazarotene loaded SLNs were fabricated by hot homogenization method followed by the ultrasonication [15,16]. In a 5 ml of 1:1 binary mixture of methanol and chloroform, tazarotene, egg lecithin, and lipid were dissolved. Organic solvents were completely removed using a rota evaporator. By heating to 5°C above the melting point of the lipid, the drug embedded lipid layer was molten. The aqueous phase was made by dissolving poloxamer 188 in double-distilled water and heated to same temperature (based on lipid melting point) of oil phase. Hot aqueous phase was added to the oil phase and homogenization was carried out (at 12000 rpm) using homogenizer for 4 min. The coarse hot oil in water emulsion so obtained was ultrasonicated for 20 min by employing a 12 T probe sonicator. Consequential, hot nanoemulsion allowed to cool to room temperature that finally produced the tazarotene loaded SLN.
The statistical experimental design can determine the effect of the factors on characterization properties and the optimal conditions of factors [17,18].
Screening study
In the first step, a Taguchi design with seven variables at two different levels was utilized to determine the factors affecting particle size and entrapment efficiency (EE) [19].
Taguchi method
Two major tools used in the Taguchi method are the orthogonal arrays and ANOVA and the signal-to-noise ratio (S/N). ANOVA is a matrix of numbers arranged in rows and columns. Each row represents the level of factors in each run, and each column represents a specific level for a factor that can be changed for each run. S/N implies the quality, and the main objective of the Taguchi experiment is to find the best level for each operational parameter so as to minimize (or maximize) S/N [20-22].
Experimental parameters
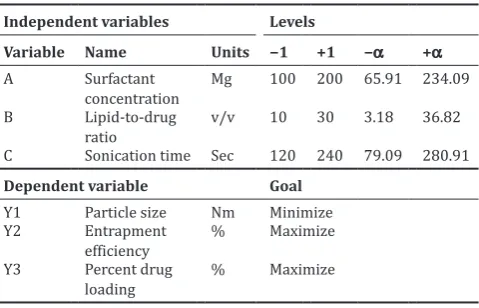
The Stat-Ease Design Expert® software V8.0.1 was used for regression and graphical analysis of the obtained data. For our experiments, we considered eight parameters (surfactant type, type of lipid, surfactant concentration, cosurfactant concentration, lipid-to-drug ratio, chloroform-methanol ratio, organic-aqueous phase ratio, and sonication time). Taguchi’s orthogonal array is chosen with eight parametersthat could affect the EE and particle size. The levels of each operating parameter for the preparation of SLN formulation equivalent to 100 mg of tazarotene are listed in Table 1. Here, L18 (21×37) represents 18 experiments with one 2-level factor and seven 3-level factors (Table 2).
The optimum values of the significant factors were determined using response surface methodology. The impact of the experimental variables such as EE concentration of lipid, concentration of surfactant and sonication time on the particle size, and percent DL of nanoparticles was evaluated by the RSM, based on CCD [23].
CCD
In view of the outcomes from the examinations of the responses acquired from Taguchi design, three diverse independent variables including sonication time(s), lipid-to-drug ratio (w/w), and surfactant concentration (%) were carefully chosen for further investigation utilizing CCD. The range of level of each independent variable was set according to the preliminary experiments (Table 3).
On the basis of the CCD model provided by Stat-Ease Design Expert® software V8.0.1, 19 model experiments were randomly arranged. The experiments were conducted as for the design and the obtained responses for the dependent variables Particle size-Y1, EE-Y2, and percent DL-Y3 (Table 4).
Characterization of tazarotene loaded SLN
Mean particle size, polydispersity index, and zeta potential
The mean particle size, polydispersity index, and zeta potential of tazarotene nanoparticles were determined by laser light diffractometry using zetasizer nanoseries, SM2000K (Malvern Instruments Inc., UK). From the prepared SLN dispersion, 100 ml was diluted to 5 ml with double distilled water to get optimum kilo counts per second (Kcps) of 50–200 for measurements. All measurements were carried out at 25°C and performed in triplicate.
Lyophilization of SLNs
Lyophilization technique was employed for the enhancement of stability of SLNs. The drug-loaded SLNs containing 10% w/v tazarotene
were prepared and set aside for overnight at −40°C in deep freezer. The
frozen samples were subjected to vacuum freeze-drying process for about 48 h to get powdered lyophilized product.
EE and percent DL determination
EE was determined by measuring the concentration of unentrapped free drug in an aqueous medium containing either PVA or PLX. Plain SLN without drug was used as blank sample and centrifuged in the same manner.
Table 1: List of variables and their levels used in L18 Taguchi orthogonal array design
Factor Name Units Type Low actual High actual Level
A Surfactant type Categoric PVA PLX-188 2
B Lipid type Categoric D-114 D-118 3
C Surfactant concentration mg Categoric 100 200 3
D Cosurfactant concentration mg Categoric 100 200 3
E Lipid/Drug Categoric 10 30 3
F Chloroform: methanol v/v Categoric 0.5:1.5 1.5:0.5 3
G Organic phase: aqueous phase v/v Categoric 0.5:1.5 1.5:0.5 3
H Sonication time sec Categoric 120 240 3
Surface morphology by transmission electron microscopy (TEM) The morphology of the tazarotene loaded nanoformulation was determined by TEM (JEM-2000 EXII; JEOL, Tokyo, Japan) [24].
Solid state characterization DSC studies
DSC analysis of tazarotene, dynasan-116, poloxamer-188, egg lecithin and physical mixtures (PM in 1:1 ratio), and lyophilized tazarotene nanoparticles was performed using a Perkin Elmer DSC/7 DSC (Perkin-Elmer, CT-USA).
Powder X-ray diffraction (PXRD) studies
The Powder XRD patterns of tazarotene, dynasan-116, poloxamer-188, egg lecithin, and physical mixtures (PM in 1:1 ratio), and lyophilized tazarotene nanoparticles were determined by means of X-ray diffractometer (Bruker D8 Advance). The assessment was conducted under the following circumstances: Irradiation with monochromatized
Cu Kα radiation (λ=1.542 A°), current (30 mA), and voltage (40 kV) from 2° to 40° at 2θ angle.
In vitro drug release studies
In vitro release studies were conducted by utilizing dialysis bag method with phosphate-buffered saline (pH 7.4) as dissolution medium at 37°C with the speed of 50 rpm. At predetermined time points, 3ml of dissolution medium was taken and filtered as described above and analyzed by UV-visible spectrophotometer at 246 nm. The removed volume was replaced with the same volume of phosphate-buffered saline (pH 7.4).
Drug release kinetics
To explicate the manner and mechanism of drug release, the data from the in vitro release experiments were fitted into various kinetic models, such as Korsmeyer-Peppas model, Higuchi’s model, first-order, and zero-order. Curve fitting method was employed to determine the release data from the nanoformulation.
Stability studies
Stability of tazarotene nanoparticles suspension in screw-capped glass vials was evaluated over a period of 60 days. Six samples were divided into two groups and stored at 25°C and 4°C. Drug leakage from nanoparticles and mean particle size of the samples was determined at the end of 1, 7, 15, 30, 45, 60, and 90 days.
Preparation of tazarotene loaded SLN gel
The tazarotene loaded SLN gel formulation was prepared by dispersing required quantity of Carbopol 934 P (1% w/w) in a small quantity of distilled water and allowing to hydrate for 4–5 h. To the aqueous dispersion, glycerol (30% w/w) and propylene glycol (10% w/w) were added later. Inclusion of air was avoided by addition of 0.5 ml of triethanolamine, and lyophilized tazarotene nanoparticles powder
Table
Table 3: List of dependent and independent variables and their levels used in central composite design
Independent variables Levels
Variable Name Units −1 +1 −α +α
A Surfactant
concentration Mg 100 200 65.91 234.09
B Lipid-to-drug
ratio v/v 10 30 3.18 36.82
C Sonication time Sec 120 240 79.09 280.91
equivalent to 150 mg of the drug was incorporated into the gel under gentle stirring. Finally, rest of the water (58.85% w/w) was added to make up the volume of dispersion up to 100% w/w [25].
Characterization of SLN based gel of tazarotene
Characterization of SLN base gel of tazarotene was done by determination of drug content by UV spectrophotometric method, determination of spreadability of the gel [26], determination of pH using digital pH meter (HI 98107, Hanna Instruments, India), and rheological studies on the microemulsion-based gel using Brookfield Viscometer LVDV - IIIU (Brookfield Engineering LABS, Stoughton, USA) [27].
RESULTS AND DISCUSSION DSC thermogram
Thermogram of tazarotene exhibited sharp characteristic endothermic peaks at 104°C, confirming the identity of the drug (Fig. 1).
Analysis of experimental data
Experimental data were analyzed using S/N ratio and ANOVA. Based on the results of the ANOVA and S/N ratio, finest parameter settings for improved accuracy were found and substantiated experimentally. Regression models were established to attain the compensation factor for any set of process parameters [28]. The experimental results from analysis of variance are found to be significant and the values of R2, predicted R2, adjusted R2, and adequate precision for each response are shown in Table 5.
Effect of process parameters on the particle size
The results of the statistical analysis revealed that changing the lipid-to-drug ratio from 10:1 to 30:1 has shown an increase in particle size (Fig. 2a), which could be due to higher concentrations of lipid resulted in increased viscosity of the solution, which thereby decreases the shear capacity of the stirrer and inversely affects the particle size.
Fig. 1: Differential scanning calorimetric thermogram of tazarotene pure drug Table 4: Central composite design with observed responses
Run Surfactant
concentration (mg) Lipid to drug ratio (w/w) Sonication time (s) Particle size (nm) Entrapment efficiency (%) Percent drug loading (%)
1 150 20 180 115.12 84.2 11.62
2 150 20 180 114.56 83.6 11.34
3 150 20 79.09243 128.36 85.4 11.87
4 100 30 120 153.72 86.12 11.34
5 65.91036 20 180 134.76 91.52 10.76
6 150 20 280.9076 155.63 83.06 10.96
7 150 20 180 116.36 82.86 11.82
8 200 10 120 104.35 90.62 13.42
9 234.0896 20 180 131.35 92.32 12.34
10 200 30 120 154.48 89.34 11.86
11 150 20 180 114.56 83.45 11.67
12 200 10 240 120.32 83.58 10.92
13 150 36.81793 180 169.72 90.23 10.46
14 200 30 240 162.67 89.56 11.22
15 150 3.182072 180 86.22 84.29 9.5
16 100 10 120 104.78 88.12 12.34
17 150 20 180 114.92 84.17 11.76
18 150 20 180 115.12 83.58 11.74
19 100 10 240 117.44 84.67 10.92
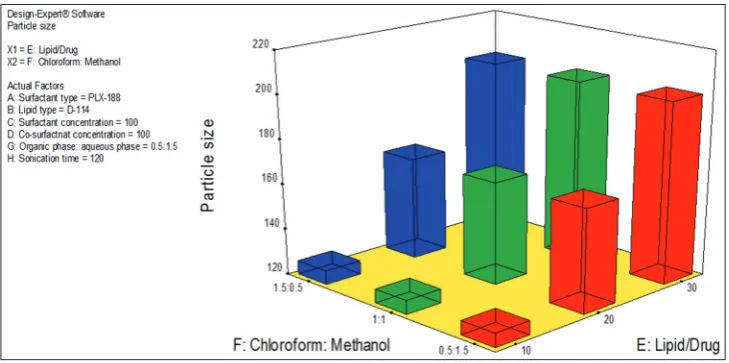
Fig. 2b revealed the effect of sonication time on particle size. As the sonication time is increased, it resulted in decreased particle size. A little interactive effect was observed between E (lipid to drug ratio) and H (Chloroform: methanol) as evidenced from 3D surface plot (Fig. 3).
Effect of process parameters on EE
The outcomes of the statistical analysis exposed that the type of surfactant has a clear noteworthy impact on EE (Fig. 4). The surfactant poloxamer-188 has shown better EE compared to polyvinyl alcohol.
Effect of process parameters on percent DL
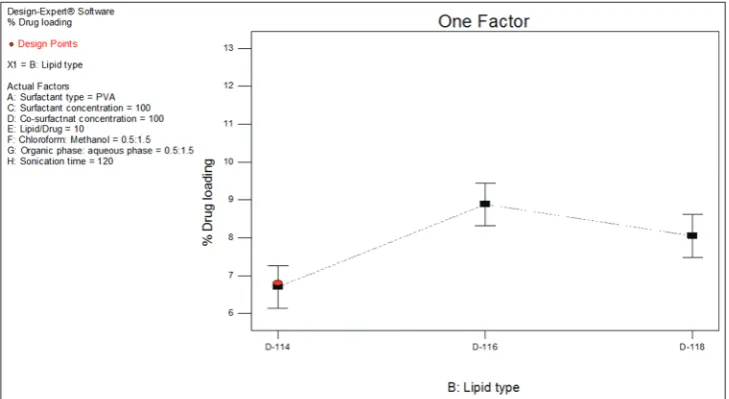
The surfactant poloxamer-188 resulted in better percent DL compared to polyvinyl alcohol (Fig. 5). The lipid dynasan-116 has resulted in better
DL compared to other lipids (Fig. 6). A significant interactive effect was observed between A (surfactant type) and B (lipid type) as evidenced from 3D surface plot (Fig. 7). Similarly, a significant interactive effect was detected between B (lipid type) and C (surfactant concentration) as evidenced from 3D surface plot (Fig. 8).
CCD analysis Analysis of particle size
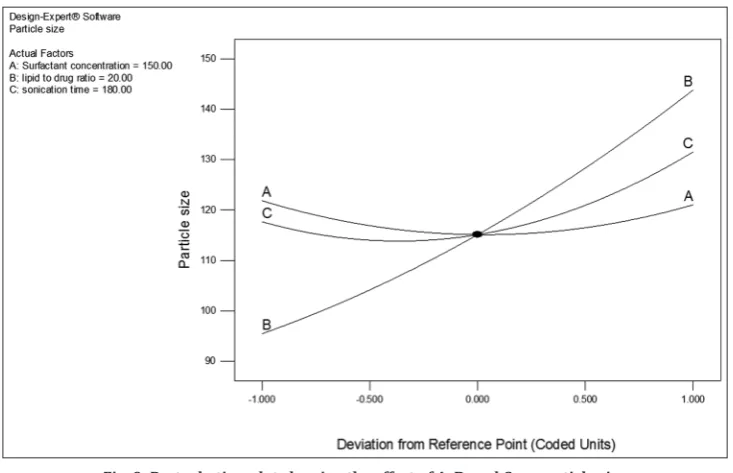
Twenty experiments are required for the response surface methodology founded on the CCD when there are three factors at four levels each. The theoretical (predicted) values and the observed values of the response particle size (Y1) were in reasonably good agreement. The main effects, quadratic effects, and interaction effects of surfactant concentration (A), lipid to drug ratio (B), and sonication time (C) on particle size (Y1) are represented in Fig. 9. As the lipid-to-drug ratio increases from 10 to 30, the particle size of nanoparticles was found to increase from 86.22 nm to 169.72 nm. Similarly by increasing the sonication time, the particle size was moderately increased. The interaction between the surfactant concentration (A) and lipid to drug ratio (B) on particle size (Y1) at a fixed level of C (180 s) is recorded (Fig. 10).
Analysis for EE
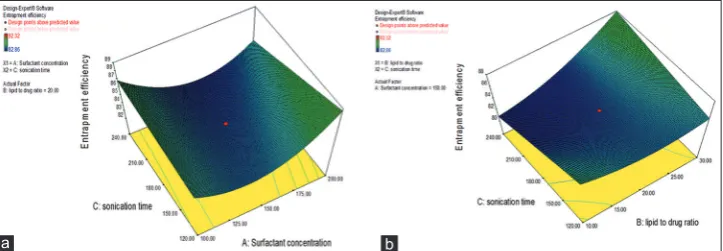
The main effects, quadratic effects, and interaction effects of surfactant concentration (A), lipid-to-drug ratio (B), and sonication time (C) on EE
Fig. 3: 3D surface plot showing the interactive effect of F (Chloroform:methanol) and E (lipid-to-drug ratio) on particle size
Table 5: values of R2, predicted R2, adjusted R2, and adequate
precision of all responses
Values Particle
size Entrapment efficiency Percent drug loading
R-squared 0.9661 0.8397 0.7950
Adjusted R-squared 0.9556 0.8297 0.7511
Predicted R-squared 0.9350 0.7971 0.6612
Adequate precision 27.993 12.947 11.430
Table 6: Optimized values obtained by the constraints applies on Y1, Y2, and Y3
Independent variable Nominal
values Predicted valuesParticle Observed values
size (Y1) Entrapment efficiency (Y2) Drug loading (Y3) Batch Particle size (Y1) Entrapment efficiency (Y2) Drug loading (Y3)
Concentration of surfactant (A) 200 102.894 90.567 12.355 I 95.57 91.24 11.92
II 91.34 90.63 12.32
Lipid to drug ratio (B) 10 III 94.14 90.78 12.16
Sonication time (C) 120
Fig. 2: Effect of different variables on particle size (a) lipid-to-drug ratio and (b) sonication time
Fig. 4: Effect of surfactant type (A) on entrapment efficiency (Y2)
Fig. 5: Effect of surfactant type (A) on percent drug loading (Y3)
(Y2) (Fig. 11). The figure clearly shows that at surfactant concentration (A) has a negative effect on EE (Y2) at low levels. Fig. 12a shows the interaction between the surfactant concentration (A) and sonication
time (C) on EE (Y2) at a fixed level of B (20:1). Fig. 12b shows the interaction between the lipid to drug ratio (B) and sonication time (C) on EE (Y2) at a fixed level of A (150 mg).
Fig. 7: 3D surface plot showing the Interactive effect of A (surfactant type) and B (lipid type) on percent drug loading
Fig. 8: 3D surface plot showing the interactive effect of B (lipid type) and C (surfactant concentration) on percent drug loading
Fig. 10: Response surface plot showing the influence of surfactant concentration and lipid-to-drug ratio on particle size
Fig. 11: Perturbation plot showing the effect of A, B, and C on entrapment efficiency
Fig. 12: (a) Response surface plot showing the influence surfactant concentration and sonication time on entrapment efficiency. (b) Response surface plot showing the influence of lipid-to-drug ratio and sonication time on entrapment efficiency
Analysis for percentage DL
The surfactant concentration (A) has a synergistic effect, and sonication time has an antagonistic effect on percent DL. The theoretical (predicted) values and the observed values were in reasonably good agreement. The perturbation plot showing the effect of A and C on percent DL plotted (Fig. 13).
Optimization and confirmation experiments
A numerical optimization technique by utilizing the desirability strategy was hired to prepare Tazarotene nanoparticles with the anticipated responses. The optimized levels and predicted values of Y1, Y2, and Y3 are shown in Table 6. All the prepared formulations were analyzed to determine their zeta potential and particle size distribution. The mean size of all the formulations was ranging from 91.34±6.8 nm to 95.57±6.3 nm (Table 7).
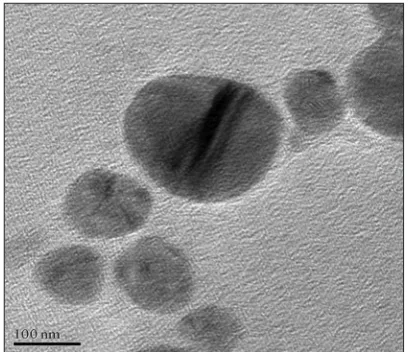
Surface morphology by TEM
TEM analysis has demonstrated the existence of individual nanoparticles in a spherical shape. Surface morphology resolves the basic function of particles, degradation, release of drug from the polymer matrix, transport of particles in the body, and internalization of drug. TEM results were also compatible with DLS particle size measurements (Fig. 14).
DSC studies
The DSC thermogram of pure tazarotene exhibited sharp endothermic peaks at 104°C (Fig. 1). The DSC of dynasan-116 displayed a sharp endothermic peak at 66.53°C (Fig. 15). The distinctive endothermic peaks of the distinct components were evident in the physical mixture (Fig. 16). The peak for tazarotene was entirely absent in lyophilized SLN of tazarotene (Fig. 17). The absence of an endothermic peak in the nanoparticulate formulations resolved that the drug was existing in the amorphous phase and may have been homogeneously dispersed in the lipid.
PXRD pattern
From the PXRD results, it was obvious that pure tazarotene displayed
crystalline nature with representative peaks at 2θ of 13.90°, 15.99°,
22.68°, and 25.21°. In the physical mixture, the crystalline peaks for tazarotene were clearly evident, whereas the nanoformulation showed disappearance of the principal peaks of tazarotene, demonstrating its existence in an amorphous or molecular dispersion state (Fig. 18).
Drug release study
The in vitro drug release pattern of the drug from the optimized batches recorded (Fig. 19). All formulations showed an increase in dissolution
over pure drug, which showed only ≈42% release after 60 min.
Release kinetics
The results of the release kinetics of the optimized formulation of tazarotene SLN (F1) (Figs. 20-23) show that the major mechanism of drug release follows zero-order kinetics (Table 8). Further, the n value obtained from the Korsmeyer-Peppas plots, i.e., 0.563 indicating non-Fickian (anomalous) transport thus it projected that delivered its active ingredient by coupled diffusion and erosion.
Stability study
The stability study data (Table 9) specifies that no significant difference (p < 0.05) was detected in particle size and EE of optimized formulation stored at room temperature and refrigerated conditions.
Fig. 13: Perturbation plot showing the effect of A and C on percent drug loading
Table 7: The mean particle size, PDI , zeta potential, entrapment efficiency, and % drug loading of optimized formulations
Batch MPS±SD (nm) PDI ZP±SD (mV) % EE±SD % DL±SD
1 95.57±6.3 0.283 −31.8±3.15 91.24 11.92
2 91.34±5.2 0.247 −29.3±4.89 90.63 12.32
3 94.14±6.8 0.240 −28.2±5.14 90.78 12.16
n=3 (p<0.05)
Formulation of SLN based gel of tazarotene
The gel formulation of tazarotene was made by mixing the swollen gel matrix with the oily phase at 2% w/w concentration of Carbopol 971P NF. The tazarotene content of the gel formulation was found to 98.96±0.021% w/w of the theoretical value (0.05% w/w). The results specify that the processes employed to prepare solid dispersions in this study were capable of producing a formulation with uniform drug content.
Table 8: Release kinetics of optimized formulation of tazarotene SLNs (F1)
Formulation code Zero-order First-order Higuchi Korsmeyer-Peppas
R2 n R2 N R2 n R2 n
F1 0.91306 1.6191 0.90812 0.025 0.96126 13.9388 0.98598 0.563
SLN: Solid lipid nanoparticles
Fig. 15: Differential scanning calorimetric thermogram of dynasan-116
Fig. 16: Differential scanning calorimetric thermogram of tazarotene:dynasan-116 (1:1 physical mixture)
Table 9: Particle size and entrapment efficiency of tazarotene nanoparticles after 90 days of storage at refrigerated and room temperature
Temp-erature (°C) Particle size (nm) Entrapment efficiency (%) Release data (% CDR)
0 month 3 months 0 months 3 months 0 months 3 months
30 min 60 min 30 min 60 min
4±1°C 95.57±6.3 96.12±3.26 91.24±1.28 90.83±2.12 71.50±1.27 98.12±1.52 70.56±1.34 97.76±2.15
25±2°C 95.57±6.3 96.27±1.86 91.24±1.28 91.12±1.56 71.50±1.27 98.12±1.52 70.12±1.16 97.82±1.13
n=3 (p<0.05)
Fig. 17: Differential scanning calorimetric thermogram of tazarotene nanoformulation
CONCLUSION
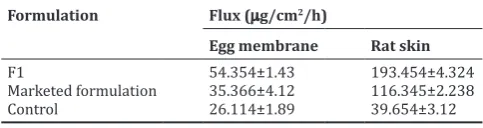
Tazarotene SLNs were prepared by hot homogenization followed by the ultrasonication using Taguchi’s design. The lipid dynasan-116, surfactant poloxamer-188, and cosurfactant egg lecithin resulted in better percent DL and evaluated for particle size, zeta potential, drug EE, in vitro drug release, and stability. The prepared nanoformulations were evaluated for different parameters and found to be in an acceptable Table 10: Flux of tazarotene from SLN based gel formulation
Formulation Flux (μg/cm2/h)
Egg membrane Rat skin
F1 54.354±1.43 193.454±4.324
Marketed formulation 35.366±4.12 116.345±2.238
Control 26.114±1.89 39.654±3.12
Fig. 19: In vitro release of tazarotene from solid lipid nanoparticles
Fig. 21: Plot of first-order release kinetics of the optimized batch
range. In vitro drug release of optimized SLN formulation (F1) was found to be higher when compared with pure drug and the major mechanism of drug release follows zero-order kinetics release data for optimized formulation (F1) with non-Fickian (anomalous) of Korsmeyer-Peppas model. TEM analysis has demonstrated the presence of individual nanoparticles in spherical shape, and the results were also compatible with particle size measurements. The drug content of tazarotene gel formulation was found to 98.96±0.021%, and the viscosity of gel formulation at 5 rpm was found to be 5.98×10³±0.34×10³ cp. The release rate (flux) of tazarotene across the membrane and excised skin differs significantly and the flux value for SLN based gel formulation
(193.454±4.324 μg/cm2/h) was found to be higher than that for
marketed gel (116.345±2.238 μg/cm2/h). The formulation was stable for 3 months. From the obtained results, the topically oriented SLN based gel formulation of tazarotene could be useful in providing effective and site-specific dermal treatment of psoriasis.
AUTHORS’ CONTRIBUTIONS All authors contributed equally.
CONFLICTS OF INTEREST No conflicts of interest by authors.
REFERENCES
1. Mehnert W, Mader K. Solid lipid nanoparticles: Production, characterization and applications. Adv Drug Deliv Rev 2012;64:83-101. 2. Rohit B, Pal KI. A method to prepare solid lipid nanoparticles with
improved entrapment efficiency of hydrophilic drugs. Curr Nanosci 2013;9:21120.
3. das Neves J, Amiji MM, Bahia MF, Sarmento B. Nanotechnology-based systems for the treatment and prevention of HIV/AIDS. Adv Drug Deliv Rev 2010;62:458-77.
4. Priya S, Marina K, Kumari NS. Formulation and characterization of ropinirole hydrochloride loaded solid lipid nanoparticles. Int J Pharm Pharm Sci 2015;7:85-9.
5. Perugini P, Tomasi C, Vettor M, Dazio V, Conti B, Genta I, et al. Influence of sln matrix modification on “in vitro” and “in vivo”
nanoparticle performances. Int J Pharm Pharm Sci 2010;2:37-43. 6. Parisi R, Symmons DP, Griffiths CE, Ashcroft DM, Identification and
Management of Psoriasis and Associated ComorbidiTy (IMPACT) project team. Global epidemiology of psoriasis: A systematic review of incidence and prevalence. J Invest Dermatol 2013;133:377-85. 7. Cameron JB, Voohees AS. History of Psoriasis. London: Springer; 2014. 8. Perera GK, Di Meglio P, Nestle FO. Psoriasis. Annu Rev Pathol
2012;7:385-422.
9. Raychaudhuri SK, Maverakis E, Raychaudhuri SP. Diagnosis and classification of psoriasis. Autoimmun Rev 2014;13:490-5.
10. Griffiths CE, Barker JN. Pathogenesis and clinical features of psoriasis. Lancet 2007;370:263-71.
11. Aqel B, Bishop M, Krishna M, Cangemi J. Collagenous colitis evolving into ulcerative colitis: A case report and review of the literature. Dig Dis Sci 2003;48:2323-7.
12. Russell JJ. Topical therapy for acne. Am Fam Phys 2000;61:1-13. 13. Zaenglein AL. Topical retinoids in the treatment of acne vulgaris.
Semin Cutan Med Surg 2008;27:177-82.
14. Patel MR, Patel RB, Parikh JR, Patel BG. HPTLC method for estimation of tazarotene in topical gel formulations and in vitro study. Anal Methods 2010;2:275-81.
15. Manjunath K, Venkateswarlu V. Pharmacokinetics, tissue distribution and bioavailability of clozapine solid lipid nanoparticles after intravenous and intraduodenal administration. J Control Release 2005;107:215-28.
16. Müller RH, Mäder K, Gohla S. Solid lipid nanoparticles (SLN) for controlled drug delivery a review of the state of the art. Eur J Pharm Biopharm 2000;50:161-77.
17. Roy A. Primer on the Taguchi Method. New York: Van Nostrand Reinhold; 1990.
18. Sharma P, Verma A, Sidhu RK, Pandey OP. Process parameter selection for strontium ferrite sintered magnets using Taguchi L9 orthogonal design. J Mater Process Technol 2005;168:147-51.
19. El-Moslamy SH, Elkady MF, Rezk AH, Abdel-Fattah YR. Applying taguchi design and large-scale strategy for mycosynthesis of nano-silver from endophytic trichoderma harzianum SYA.F4 and its application against phytopathogens. Sci Rep 2017;7:45297.
20. Chen YH. Application of Taghuchi method in the optimization of laser micro-engineering of photomasks. Int J Mater Prod Technol 1996;11:333-44.
21. Noordin MY, Venkatesh VC, Sharif S, Elting S, Abdullah A. Application of response surface methodology in describing the performance of
coated carbide tools when turning AISI 1045 steel. J Mater Process Technol 2004;145:46-58.
22. Khosla A, Kumar S, Aggarwal KK. Identification of strategy parameters for particle swarm optimizer through Taguchi method. J Zhejiang Univ Sci 2006;7:1989-94.
23. Ba-Abbad MM, Kadhum AA, Mohamad AB, Takriff MS, Sopian K. Optimization of process parameters using D-optimal design for synthesis of ZnO nanoparticles via sol gel technique. J Ind Eng Chem 2013;19:99-105.
24. Hu C, Rhodes DG. Proniosomes: A novel drug carrier preparation. Int J Pharm 1999;185:23-35.
25. Maia CS, Mehnert W, Schäfer-Korting M. Solid lipid nanoparticles as drug carriers for topical glucocorticoids. Int J Pharm 2000;196:165-7. 26. Bachhav YG, Patravale VB. Microemulsion based vaginal gel of
fluconazole: Formulation, in vitro and in vivo evaluation. Int J Pharm 2009;365:175-9.
27. El Laithy HM, El-Shaboury KM. The development of cutina lipogels and gel microemulsion for topical administration of fluconazole. AAPS PharmSciTech 2002;3:E35.