Molecular signaling at the fusion stage of
the mouse mandibular arch:
involvement of insulin-like growth factor family
KAZUYA FUJITA, YUJI TAYA, YOSHIHITO SHIMAZU, TAKAAKI AOBA and YUUICHI SOENO*
Department of Pathology, School of Life Dentistry at Tokyo, The Nippon Dental University, Tokyo, Japan
ABSTRACT Fusion of the branchial arch derivatives is a crucial event in the development of the craniofacial architecture. Here, we surveyed the gene expression profile, focusing on the fusion process of the mouse mandibular arch at embryonic day 10.5. In order to identify the genes that are relevant to the midline fusion process, we subdivided the mandibular arch medially and laterally, and determined gene expression using microarray and real-time quantitative PCR. By comparing the transcriptomes of the medial and lateral regions, 362 genes were identified as medial region-specific genes, while 346 genes were designated lateral region-region-specific. Taken with Gene Ontology analysis, KEGG pathways and Ingenuity Pathway Analysis (IPA), a survey of the medial region-specific gene dataset revealed significant expression of the insulin-like growth factor (Igf) family as well as other growth factor families (Hh, Wnt, Tgf-Bmp, Mapk-Fgf and Notch). To determine the discrete expression pattern of Igf family genes in the medial region, we microdissected the medial part of the mandibular arch into epithelial and mesenchymal components, and found that Igf1 was highly expressed in the mesenchyme, Igf2 and Igf1r were expressed in both the midline epithelium and surrounding mesenchyme, and Igfbp5 was highly expressed in the epithelium. Immunohis-tochemical findings validated the regional Igf gene expression profiles. Our observations suggest that in the “merging” fusion of the mandibular arch, the Igf cascade may contribute to generation of proliferation pressure from the mesenchyme and preservation of epithelial phenotypes and architecture during mesenchymal confluence.
KEY WORDS:
mandibular fusion, transcriptome, protein localization, midline epithelium, mesenchyme
Introduction
During mammalian craniofacial development, pairs of facial prominences emerge from branchial arches, grow toward and fuse with each other to form complex facial structures (Mina, 2001). The first branchial arch subdivides into the maxillary and mandibular prominences, which give rise to the upper and the lower jaw, respectively (Chai and Maxson, 2006). The volume of those prominences increases with the migration and proliferation of cranial neural crest (CNC) cells. Fusion of the prominences is essentially accomplished by remodeling of the covering epithelium that is involved in confluence of the mesenchyme (Chai and Maxson, 2006). While the fusion process varies among the individual pairs of prominence (Osumi-Yamashita et al., 1997; Schilling, 1997), secondary palatogenesis has been extensively studied (Greene and
www.intjdevbiol.com
*Address correspondence to: Yuuichi Soeno. Department of Pathology, School of Life Dentistry at Tokyo, The Nippon Dental University, 1-9-20 Fujimi, Chiyoda-ku,
Tokyo 102-8159, Japan. Tel: +81-3-3261-8921. Fax: +81-3-3261-8969. E-mail: soeno-path@tky.ndu.ac.jp
Supplementary Material (2 figures and 3 tables) for this paper is available at: http://dx.doi.org/10.1387/ijdb.120110ys
Accepted: 19 November 2012. Final, author-corrected PDF published online: 12 April 2013. Edited by: Makoto Asashima.
ISSN: Online 1696-3547, Print 0214-6282
© 2013 UBC Press Printed in Spain
Abbreviations used in this paper: Igf, insulin-like growth factor; Igfbp, insulin-like growth
factor binding protein; Igfr, insulin-like growth factor receptor.
the epithelial cells become incorporated within the oral epithelia that ultimately cover the mandible (Chai et al., 1997). This sequence of fusion events was originally described as a ‘merging’ (Patten, 1961). Since fusion of these branchial arch derivatives is a crucial event in the development of the craniofacial architecture, failure in this fusion causes congenital craniofacial anomalies such as cleft lip/palate and medial cleft of the mandible (Almeida et al., 2002; Meng et al., 2009).
In the developing maxillary/mandibular prominences, the em-bryonic cell lineages of both CNC cell-derived and mesodermal-derived mesenchymal cells and the covering epithelial cells secrete pattern-determining molecules that affect one another, thereby setting up reciprocal signaling networks (Cobourne and Sharpe, 2003). Recent investigations have employed microarray analysis to unravel the complex gene expression patterns of the developing prominences in human (Cai et al., 2005), mouse (Bhattacherjee et al., 2007; Feng et al., 2009), and chicken (Buchtova et al., 2010). The comparative gene expression profiling in these studies not only characterized the individual prominences (Handrigan et al., 2007), but also established the region-specific gene expression that regulates the patterning of developing prominences, e.g., proximal/ distal gene expression in endothelin-A receptor signaling in mice and zebrafish (Clouthier et al., 2010; Vieux-Rochas et al., 2010). Since precisely compartmentalized molecular networks in the mandibular prominence give rise to multiple region-specific organs such as the tooth germ, tongue primordium, bone, and cartilage, the gene regulation of these particular events has received much attention (Mina, 2001; Stottman et al., 2001; Mina et al., 2002; Jeong et al., 2004; Tucker and Sharpe, 2004). Despite ample
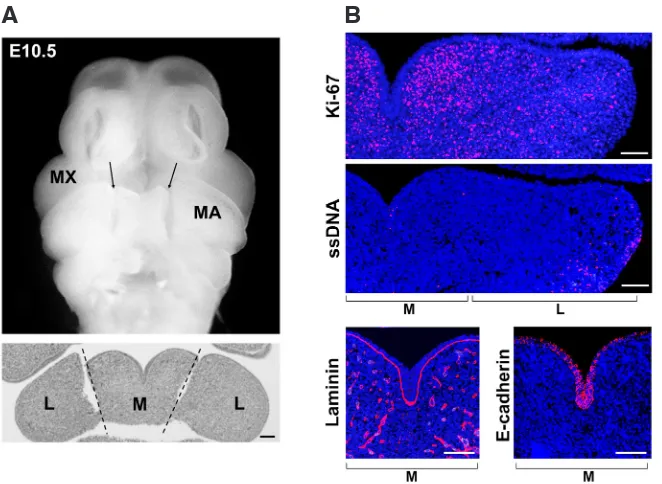
in-Fig. 1. Appearance of developing mouse mandibular arch at E10.5. (A) Preparation of tis-sue samples for gene expression analysis. Frontal views of E10.5 mouse embryo: cut lines between the M and L regions of the mandibular arch (MA) are shown in a stereomicroscopic image (arrows) and an H-E stained thin-section (dotted lines). MX = maxillary arch. Scale bar, 100 mm. (B) Immunohistochemical analysis of frontal sections from E10.5 embryo. A left-side half of mandibular arch including both M and L regions is shown for Ki-67 and single-stranded DNA (ssDNA) immunodetection. The M region is shown for laminin and E-cadherin. Scale bar, 100 mm.
formation on the regional differences in gene expression patterns in mandibular development, the molecular signaling networks operating at the midline epithelium of the ‘merging’ mandibular arch remain largely unknown.
In this study, we sought to characterize regional gene expres-sion patterns in the mouse mandibular arch at embryonic day 10.5 (E10.5), where the fusion of the mandibular prominences takes place. In this embryonic stage, many signaling molecules are exploited for multiple organogenesis, and key factors on the mandibular fusion are likely buried in complex signaling networks. To address this issue, we conducted a microarray-based analysis of the medial (M) and lateral (L) regions of the mandibular arch. We then physically subdivided the medial region into epithelial and mesenchymal components using laser-capture microdissection and performed real-time quantitative PCR (qPCR) gene expres-sion analysis. Comparison of the regional gene expresexpres-sion profiles obtained, together with immunohistochemical validation, revealed that insulin-like growth factor (Igf) family molecules, namely Igf1, Igf2, Igf1r and Igfbp5(insulin-like growth factor binding protein 5), are involved in mandibular fusion.
Results
Transcriptome of the mouse mandibular arch at E10.5
Comparison of the gene expression profiles from the M and L regions revealed that 1,868 genes showed significant differences in expression between these regions (p<0.05) (Fig. 1A and Supple-mentary Fig. S1A). Based on flag parameters (detection calls that provide the status of each hybridization signal), we designated
B
A
1,283 genes as ‘Present’ genes and 585 genes as ‘Absent’ genes. By employing a threshold line of >1.5-fold difference in expression between the two regions, we identified 708 region-specific genes: 362 that were more highly expressed in the M region (M>L) and, therefore, designated ‘M region-specific’ genes; and 346 that were more highly expressed in the L region (M<L), designated ‘L region-specific’ genes. The remaining 575 genes were categorized as constitutively expressed, or ‘Constitutive’, genes.The microarray data were also validated by collation with expression profiles from the Mouse Genome Informatics (MGI) gene expression da-tabase (Supplementary Table S1). It is noteworthy that region-specific genes such as Bmp4 and Wnt5a were predominantly expressed in the M region, while Dlx family genes were expressed in the L region. The expression of two representative epithelial-specific genes, Bmp4 and Fgf8 for the M and L region, respectively, were validated by qPCR; and their downstream genes (e.g., Msx2 in the M region and Barx1 in the L region) were also evident (Supplementary Fig. S1B).
Developmental events and signaling networks in the medial region
processes” were obtained for the M and L region, respectively. We further selected terms significant at p<0.001 and categorized them in Table 1 (See Supplementary Table S2 for the complete list); 20 terms common to both regions included basic develop-mental events related to the vasculature, neurons, and the skeletal
system; 65 M region-specific terms were mainly associated with the morphogenesis of various organs and cell proliferation, adhe-sion, and motility; and 31 L region-specific terms were related to embryonic pattern specification and mesenchymal and skeletal morphogenesis.
P-value
Term M L GO-Id Other related GO-terms
Development / Morphogenesis
Vasculature development (19/16) 8.15E-7 3.49E-5 GO:0001944 GO:0001568 Limb development (13/10) 1.84E-6 2.42E-4 GO:0060173 GO:0048736 Embryonic morphogenesis (20/19) 3.48E-5 6.29E-5 GO:0048598 GO:0048568 Neuron differentiation (21/18) 4.68E-5 6.73E-4 GO:0030182
Skeletal system development (17/21) 7.34E-5 1.42E-7 GO:0001501
Tissue morphogenesis (22) 2.69E-9 - GO:0048729 GO:0001763/GO:0051094/GO:0048589/ GO:0040008
Tube morphogenesis (18) 1.57E-8 - GO:0035239 GO:0035295/GO:0048754/GO:0060562
Heart development (20) 2.79E-8 - GO:0007507 GO:0003007
Morphogenesis of an epithelium (17) 1.16E-7 - GO:0002009 GO:0060429 Blood vessel morphogenesis (18) 1.37E-7 - GO:0048514 GO:0001525
Limb morphogenesis (13) 1.28E-6 - GO:0035108 GO:0035107/GO:0030326/GO:0035113 Respiratory system development (13) 2.85E-6 - GO:0060541 GO:0030324/GO:0030323
Gland morphogenesis (11) 3.00E-6 - GO:0022612 GO:0048732/GO:0060740/GO:0060512/ GO:0060443/GO:0030850
Regulation of neuron differentiation (11) 1.73E-5 - GO:0045664 GO:0051960/GO:0050767/GO:0031175/ GO:0007411/GO:0030030/GO:0048663/ GO:0007409/GO:0030900/GO:0045665/ GO:0048812/GO:0048667
Extracellular matrix organization (10) 9.71E-5 - GO:0030198 GO:0043062
Ossification (10) 1.41E-4 - GO:0001503 GO:0001649/GO:0060348
Odontogenesis (7) 1.60E-4 - GO:0042476 GO:0042475
Digestive system development (6) 3.58E-4 - GO:0055123
Pattern specification process (22) - 2.76E-8 GO:0007389 GO:0003002/GO:0009952 Skeletal system morphogenesis (13) - 2.94E-6 GO:0048705 GO:0048704
Sensory organ development (17) - 1.21E-5 GO:0007423 GO:0048562/GO:0043009/GO:0009792/ GO:0001756
Cartilage development (9) - 6.42E-5 GO:0051216
Mesenchyme development (7) - 2.26E-4 GO:0060485
Urogenital system development (11) - 2.49E-4 GO:0001655
Eye development (11) - 4.45E-4 GO:0001654 GO:0043010
Cell behavior
Cell motion (23) 1.10E-6 - GO:0006928 GO:0016477
Cell adhesion (28) 4.53E-6 - GO:0007155 GO:0022610/GO:0030155/GO:0010810 Negative regulation of cell differentiation (15) 6.52E-6 - GO:0045596 GO:0045165/GO:0000904
Regulation of cell development (13) 3.63E-5 - GO:0060284 GO:0032989/GO:0000902 Regulation of cell proliferation (25) 5.33E-5 - GO:0042127
Mesenchymal cell development (7) - 1.60E-4 GO:0014031 GO:0048762 Neural crest cell development (6) - 2.51E-4 GO:0014032 GO:0014033
Cell signaling
Enzyme linked receptor protein signaling pathway (19) 2.89E-6 - GO:0007167 GO:0007178 Transcription
Positive regulation of transcription (29/21) 4.90E-8 2.67E-4 GO:0045941 GO:0010628/GO:0045944/GO:0045893/ GO:0006357/GO:0006355
Negative regulation of transcription, DNA-dependent (19) - 8.16E-6 GO:0045892 GO:0045449/GO:0016481/GO:0006350/ GO:0010629/GO:0000122
Biosynthesis / Metabolism
Positive regulation of nucleobase, nucleoside, nucleotide and nucleic acid metabolic
process (29/21) 2.16E-7 6.63E-4 GO:0045935 GO:0051173/GO:0031328/GO:0009891/ GO:0051254/GO:0051252 Positive regulation of macromolecule biosynthetic process (29) 4.71E-7 - GO:0010557 GO:0010604
Negative regulation of RNA metabolic process (19) - 8.98E-6 GO:0051253 GO:0045934/GO:0051172/GO:0010558/ GO:0031327/GO:0009890
TABLE 1
GENE ONTOLOGY (GO) ANALYSIS OF THE MEDIAL (M) AND LATERAL (L) REGIONS OF THE MANDIBULAR ARCH AT E10.5
The M region-specific GO terms relevant to cell proliferation and adhesion were confirmed by immunohistochemistry (Fig. 1B). At E10.5, Ki-67-positive nuclei, indicative of proliferating cells, were enriched in the mesenchyme in the M region, and, to a lesser ex-tent, in the L region of the mandibular arch. The Ki-67 signal was almost entirely absent from the covering epithelial layer. Conversely, immunodetection of single-stranded DNA (ssDNA) for apoptotic nuclei revealed that a very few ssDNA-positive nuclei were present in the midline epithelium close to the oral epithelium, while an area enriched with ssDNA-positive nuclei was rather obvious in the L region. Immunostaining with laminin and E-cadherin antibodies also verified the integrity of basement membrane and the adhesion and polarity of epithelial cells in the M region.
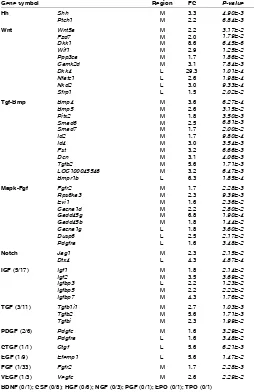
By expanding our investigation to KEGG (Kyoto-Encyclopedia of Genes and Genomes) pathways, we found the involvement of the transforming growth factor-beta (Tgfb), hedgehog (Hh), calcium, and p53 signaling pathways in the M region (Supplementary Table S3). Table 2 shows a list of genes which encode growth factors and genes relevant to those signaling pathways that have a major role in development (Hh, Wnt, Tgf-Bmp, Mapk-Fgf, and Notch). Most of the genes belonged to those pathways were M-region-specific genes. In addition, within the growth factor categories, genes in the Igf and Tgf families were highly expressed in the M region,
whereas most of other family genes such as Egf and Fgf were not evident as they were ‘Constitutive’ or ‘Absent’ (Table 2). On the basis of the region-specific gene expression data, Ingenuity Pathway Analysis (IPA) provided prediction with the highest Z-score that Igf1 and downstream gene networks are activated in the M region (Table 3). It is also pertinent that Igfbp5 was assigned as a downstream target of Igf1, Shh, and Epas1, which correspond to 3 top-ranking genes in IPA prediction.
Gene expression and localization of Igf family molecules in the medial region
With regard to the enriched expression of Igf genes in the M region, Igf signaling might be a potent regulatory pathway in the processes involved in mandibular fusion. To find supportive evi-dence for this notion, we physically subdivided the M region into the M1 (midline) and M2 (lateral end) regions by laser-capture microdissection and performed qPCR analysis (Fig. 2A). As a result, it was found that Igf1, Igf2, and Igfbp5 showed significant expression in the M1 region (p<0.01 for Igf2; p<0.05 for Igf1 and Igfbp5). In contrast, Tgfb2 and Wnt5a, which were also assigned as M region-specific genes (Table 2), were detected in nearly the same quantities in both the M1 and M2 regions (Fig. 2A).
To more precisely assess the expression of Igf family genes,
Fig. 2. Detailed expression of insulin-like growth factor (Igf) molecules in the mandibular arch. (A) M region is divided into the M1 and M2 regions by laser-capture microdissection (LMD). Transcripts for
Igf family as well as Tgfb2 and Wnt5a are quantified by qPCR. Error bars are 1 SD for three biological replicates. *p<0.05; **p<0.01. (B) qPCR quantification of Igf transcripts in the M1 epithelium (M1-epi) and mesenchyme (M1-mes) that were dissected by LMD. Shh was used as an epithelium-specific control. Error bars are 1 SD for three biological replicates. ND, not detected; *p<0.05; **p<0.01.
we further subdivided the M1 region into the epithelial (M1-epi) and mes-enchymal (M1-mes) regions (Fig. 2B). The few layers of mesenchymal cells immediately underneath the epithelium were not included so as to avoid possible contamination of transcripts within the mesenchyme samples into the M1-epi. Based on qPCR analysis, it was found that Igf1 was highly expressed in the M1-mes region (p<0.01), Igf2 was highly expressed in both the M1-epi and M1-mes regions but at a higher level in the former region (p<0.05), and receptor genes Igf1r and Igf2r were expressed in both regions. Notably, Igfbp5 was highly expressed in the M1-epi region (p<0.01).
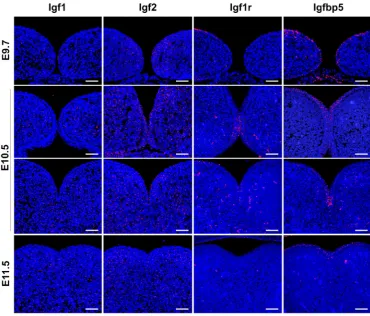
Immunohistochemical analysis vali-dated the discrete localization of Igf family molecules in mandibular arch (Fig. 3). Igf1 signals were detected almost exclusively in the mesenchyme from pre-fusion (E9.7) through post-fusion (E11.5) stages. In contrast, Igf2 signals were distributed in both the epithelium and mesenchyme in the fusing mandibular arch at E9.7 and E10.5. Notably, after completion of mandibular fusion at E11.5, Igf2 signals were not detectable in the oral epithelium covering the mandibular arch, although the signals still remained abundant in the mesenchymal region underneath the epithelium. Igf1r signals were a few in both the epithelium and mesenchyme, consistent with the lower expression lev-els in the M1-epi and M1-mes by qPCR.
B
Most intriguingly, the signal-intensity in the epithelium increased markedly at the contact region between bilateral mandibular epi-thelia and remained discernible in the merging midline epithelium at E10.5, although a very few signals were barely detected in both the oral epithelium and underlying mesenchyme at E11.5. In the case of Igfbp5, the signals were more prominent in the epithelial region and sparsely distributed in the mesenchyme at all fusion stages. Remarkably, Igfbp5 signals were concentrated in a droplet-like epithelial end formed after adherence of the bilateral epithelia at E10.5. As shown in Fig. 1B, this Igfbp5-rich epithelial region was characterized by segregation from the mesenchyme
with the intact laminin-positive basement membrane, E-cadherin-positive phenotype, and a lack of proliferation activity. In relation to the discrete mechanisms postulated for mandibular fusion and secondary palatogenesis, it is pertinent to address that Igfbp5 was not detected in the disintegrating MEE cells of secondary palate (Supplementary Fig. S2).
Discussion
The present microarray results of the M and L regions support the concept of compartmentalized gene expression in the mandibular arch. Previous studies have documented the involvement of vari-ous signaling cascades (e.g., the Hh, Wnt, Tgf-Bmp, Mapk-Fgf, and Notch pathways) in multiple organogenesis during mandibular development (Mina, 2001; Stottman et al., 2001; Mina et al., 2002; Jeong et al., 2004; Chai and Maxson, 2006). It is important to note that although the number of differentially expressed genes was comparable between the M and L regions (362 and 346 genes, respectively), most of the growth factors and related genes were highly expressed in the M region at the fusion stage (Table 2). Among various signaling cascades classified into the M region-specific categories, the results of IPA prediction supported the activation of Igf1 signaling cascade in the M region. The strong expression of Igf1 as well as Igf2 in the M region (Table 2) is consistent with the theory that the Igf signaling system has profound effects on embryonic growth and differentiation (Baker et al., 1993).
The present microarray, qPCR, and immunohistochemical find-ings provided compelling evidence that Igf signaling is involved in the process of “merging” mandibular fusion. Prominent Igf1 gene expression in the M1-mes region (Fig. 2B) and abundant Igf1 pro-tein signals in the M-region mesenchyme (Fig. 3) are consistent with high proliferation activity in the M-region mesenchyme at E10.5. It is also interesting that mandibular epithelial cells lacking Igf1 signaling showed no proliferation activity. In contrast to the segregated Igf1 localization, Igf2 and Igf1r were distributed in both the midline epithelium and surrounding mesenchyme. Particularly, concurrent localization of strong Igf2 and Igf1r signals at the epi-thelial contact region (Fig. 3, E10.5) further support involvement
Gene symbol Region FC P-value
REGION-SPECIFIC GENE EXPRESSION IN THE MEDIAL (M) AND LATERAL (L) REGIONS
Genes belonging to major signaling pathways during development [Hedgehog (HH), Wnt, Tgf-Bmp, Mapk-Fgf, and Notch pathways] and growth factors are listed based on the KEGG PATHWAY analysis (p<0.05). The ratio of differentially expressed genes to total number of genes in each family is indicated in parentheses. FC, fold change.
Abbreviations: IGF, insulin-like growth factor; TGF, transforming growth factor; PDGF, platelet-derived growth factor; CTGF, connective tissue growth factor; EGF, epidermal growth factor; FGF, fibroblast growth factor; VEGF, vascular endothelial growth factor; BDNF, brain-derived neurotrophic factor; CSF, colony stimulating factor; HGF, hepatocyte growth factor; NGF, nerve growth factor; PGF, placental growth factor; EPO, erythropoietin; TPO, thrombopoietin.
Upstream
gene Molecule Type Predicted activation (z-score) Target molecules in dataset (p-value of overlap)
Igf1 growth factor Activated (2.98) Bmp4, Epas1, Foxa1, Gap43, Ghr, Id2, Igf1, Igf2, Igfbp5, Mmp14 (4.84E-4) Shh peptidase Activated (2.72) Angpt1, Bmp4, Foxf1, Hand2, Igf1, Igf2,
Igfbp5, Pitx2, Pmp22, Ptch1 (2.94E-6) Epas1 transcription
regulator Activated (2.56) Akap12, Egln3, Fhl1, Gadd45b, Gja1, Igfbp5, L1cam, Loxl2, Mmp14, Plod2 (6.23E-4)
Cd38 enzyme Activated (2.20) Atp1b1, Egln3, Gadd45g, Lmo7, Ncam1, Obfc2a, Ppargc1a, Ppp3ca, Rbpms, Socs2 (3.01E-4)
Bmp4 growth factor Activated (2.10) Bmp4, Fgfr2, Foxf1, Id2, L1cam, Msx1, Msx2, Ncam1, Pitx2, Postn (2.21E-11) Sox2 transcription
regulator Inhibited (-2.35) Cldn7, Fst, Gja1, Id2, Igf1, Isl1, Msx2, Pitx2, Plac1, Vegfc (1.74E-6)
TABLE 3
IPA PREDICTION OF UPSTREAM REGULATORS OF MEDIAL REGION-SPECIFIC GENE EXPRESSION
of Igf2-Igf1r cascade in mandibular fusion. We here do not intend to conclude that the Igf signaling may well be a central player in mandibular fusion, because it was documented that mice lacking Igf family genes (Igf1-/-, Igf2-/-, or Igf1r-/-) resulted in delayed skeletal
development without failure in fusion of facial prominences (Liu et al., 1993; Rizos et al., 2001). The lack of substantial phenotypic defects at craniofacial fusion sites in Igf-family deficient mice sug-gests possible functional compensation by the complex signaling networks operating in the compartmentalized embryonic environ-ment. In a recent study on Twisted gastrulation (Twsg1) mutant mice, where Twsg1 is a modulator of Bmp signaling, transcriptome analysis revealed diminished Igf2 expression in the mutant mice (Billington et al., 2011). Interestingly, the documented phenotypes include premature fusion of mandibular arch, rather failure in fu-sion, due to induction of apoptosis in the distal region of the first branchial arch.
It is well known that the diverse biological functions of Igf signaling system are regulated by a variety of Igf-binding proteins (Hwa et al., 1999; Pollak, 2008). The present microarray-analysis findings showed that at E10.5, Igfbp1 and Igfbp6 were not expressed in the mouse mandibular arch, Igfbp2 and Igfbp4 were constitutively expressed in both M and L regions, and Igfbp3 was differentially expressed in the L region (Table 2). Although Igfbp5 as well as Igfbp7 (also known as Mac25 or Igfbp-related protein 1) (Hwa et
al., 1999) showed M region-specific expression in our microarray data (Table 2), qPCR analysis revealed that Igfbp5 was expressed at the highest level in the medial epithelium of the mandibular arch (Fig. 2B). The expres-sion of Igfbp5 has been demonstrated in the mouse branchial arch epithelia at E10.5 and in the craniofacial mes-enchyme at later stages by in situ hybridization (Bobola and Engist, 2008), but the specific role(s) of Igfbp5 in mandibular fusion remains elusive. Igfbp5 has been supposed to exert diverse effects in a context-dependent manner, such as a negative regulator of craniofacial skeletal development (Bobola and Engist, 2008), a promoter or blocker of myoblast differentiation (Ren et al., 2008; Mukherjee et al., 2008), and an inducer or inhibitor of cell proliferation, apoptosis and EMT (Flint et al., 2000; Allan et al., 2008). Our immunohistochemical findings revealed that Igfbp5 protein was concentrated in the droplet-shaped epithelial end (Fig. 3), where epithelial cells of the bilateral mandibular promi-nences started to realign without cell division or massive apoptosis (Fig. 1B). This Igfbp5-rich epithelial region was characterized by E-cadherin-positive phenotype and segregation from the mesenchyme with the intact basement membrane, both of which Fig. 3. Localization of Igf family proteins during the “merging” fusion of mandibular arch. Frontal
sections of mouse embryos at pre-fusion (E9.7), fusing (E10.5), and post-fusion (E11.5) stages were immu-nolabeled for Igf1, Igf2, Igf1r, and Igfbp5. Anterior (in contact) and posterior (merging) regions from a series of frontal sections are presented for E10.5 mandibular arch. The immunolabeled signals and DAPI-stained cell nuclei are shown in red and blue, respectively. Scale bars, 100 mm.
are indicative of the epithelial integrity without EMT. Our microar-ray data also showed that the EMT-inducible transcription factor Snai1 and the Rho family (Rhoa, Rac1, and Cdc42) were either constitutive or L region-specific (data not shown). Taken with the report that knockout mice lacking Igfbp5 expression grow without defects in the orofacial architecture (Ning et al., 2006), we speculate that Igfbp5 localized in the mandibular epithelium may contribute to modulation in fine-tune of the epithelial integrity before the midline epithelium becomes ultimately incorporated within the oral epithelia covering the mandible (Chai, 1997). In connection with the epithelium-dominant Igfbp5 expression, the present IPA results indicated that Igfbp5 is a downstream target of Shh expressed exclusively in the M1-epi (Fig. 2B).
and other signaling cascades, such as Shh and Igf connection in the epithelial compartment as predicted by IPA. We at present continue to investigate discrete functional effects of Igf and Tgf-beta families on mandibular fusion and secondary palatogenesis.
Materials and Methods
Animals
Timed-pregnant ICR mice were purchased from a local supplier (Charles River, Japan). All mice were kept under a 12-h light-dark cycle and were given standard laboratory chow and water ad libitum. For each dam, the morning of the day on which a vaginal plug was found was designated as E0.5. To collect tissue specimens, dams were euthanized by cervical dis-location. Their uteri were dissected out and placed in Hanks’ balanced salt solution (HBSS; Invitrogen, USA) at 4ºC. Embryos were rinsed with fresh HBSS to remove amniotic fluid and blood and were dissected to remove the mandibular arch. All animal procedures in this study were reviewed and approved by the Research Center for the Odontology Section of Biological Sciences at Nippon Dental University.
RNA extraction and DNA microarray analysis
M region of the mandibular arch was dissected out at the distal end of the apposed lateral lingual swellings of individual E10.5 embryos under a stereomicroscope (Fig. 1A). The M region and bulk of the remnant L region were collected from approximately 40 embryos to obtain a sample with suf-ficient total RNA for microarray analysis (>3 mg). Three sets of samples per region (as biological replicates) were prepared. Microarray and statistical analyses were performed at the core facility of Biomatrix Inc. (Nagareyama, Japan). In brief, cRNA was hybridized to a GeneChip® Microarray (Mouse
Expression 430 2.0 Array, Affymetrix, USA) containing 45,101 probes that cover more than 20,000 mouse genes. The expression value and detection calls were computed from the raw data according to the procedures outlined for the Affymetrix Microarray Suite version 5.0 software package. A gene list from the microarray analyses was created using GeneSpring software, version 7.3.1 (Silicon Genetics Inc., USA). The normalized data from the independent biological replicates (n=3) were subjected to Welch’s t-test (p<0.05)(MAQC Consortium, 2006). The microarray data set is available at NCBI’s Gene Expression Omnibus (GEO; http://www.ncbi.nlm.nih.gov/ geo/) database (Accession number GSE35091).
Bioinformatics
Functional categories for genes were assigned to GO terms listed under the “biological processes” hierarchy; these functional categories are based on the Gene Ontology Consortium listings (http://www.geneontology.org/). GO terms were also analyzed using DAVID bioinformatics resources v6.7 (http://david.abcc.ncifcrf.gov/) and the results were then subjected to a hypergeometric test (p < 0.001). Ingenuity Pathway Analysis (IPA; http:// www.ingenuity.com/, Ingenuity Systems, USA) was carried out to predict activation of up/down-stream signaling cascades that take place in the region-specific manner. We also referred to the KEGG PATHWAY data-base provided by Kyoto University (http://www.genome.jp/kegg/). As signal cascades induced by FGFs are included in MAPK signaling in the KEGG database, we combined FGF and MAPK signaling for GO purposes and designated this group as the Mapk-Fgf pathway for the purposes of this study. Gene expression data on MGI resource (http://www.informatics.jax. org/) were referred for collation with our microarray dataset. The keywords “mandibular” and “TS17(10.0-11.25 dpc)” were set as query parameters for anatomical structure and developmental stage, respectively. Among the result of 172 hits, 24 references contained available images for collating with our dataset.
Microdissection and real-time qPCR
Laser-capture microdissection (AS-LMD version 4.0, Leica, Germany) was performed with frozen tissue specimens to isolate epithelium or mes-enchyme at the medial region of mandibular arch at E10.5. Briefly, frontal
sections (8 mm) of the embryonic mandibular arch were placed on pre-cooled glass slides affixed with a polyethylene membrane (Fujifilm, Japan). The slides were dried for 15 min at room temperature and stored in a dark box at -80ºC until use. Prior to microdissection, the cryo-sections were fixed by methanol and were stained in 1% Toluidine-blue. Tissue fragments were collected in a denaturing solution (4 M guanidinium isothiocyanate, 0.1 M 2-mercaptoethanol, 0.025 M sodium citrate, and 0.5% sarcosyl). Total RNA was extracted from dissected pieces of tissue from 3 embryos (approximately 6,000 cells) using the acid guanidinium-phenol-chloroform (AGPC) method. cDNA was synthesized using an oligo-dT primer and the SuperScript® First-strand synthesis system for RT-PCR (Invitrogen). qPCR
was carried out using SYBR Green I® PCR Master Mix (ABI Inc., USA)
and a Prism 7000 Real-time PCR System (ABI). Three technical replicates per sample were run. The cycle threshold value (Ct) of each target gene was normalized relative to an internal control, Gapdh. All primer sets were designed using Primer3 via the NCBI webpage (http://www.ncbi.nlm.nih.gov/ tools/primer-blast/): Barx1 (Fw, CTTGCCCACACTTTTATCCC; Rv, ATCT-GCTAGAGACGACTCTG), Bmp4 (Fw, CGTTACCTCAAGGGAGTGGA; Rv, ATGCTTGGGACTACGTTTGG), Fgf8 (Fw, AACAAGCGCATCAACGCCAT; Rv, AACTCGGACTCTGCTTCCAA), Igf1 (Fw, GGCTCCAGCATTCG-GAGGGC; Rv, CGCTGGGCACGGATAGAGCG), Igf2 (Fw, ACTGTCCAT-GTCATCCAGCA; Rv, AGAGGGACTGAGTTGAGGCA), Igf1r (Fw, ATG-GAGCCTGAGAACATGGA; Rv, CCTTGTGTCCTGAGTGTCTT), Igf2r (Fw, ACTCCCTTCGGGACCCCAGC; Rv, GCAGACAGGCAGCAGTGCCA),
Igfbp3 (Fw, ACAGACACCCAGAACTTCTC; Rv,
GACTCAGCACATTGAG-GAAC), Igfbp5 (Fw, CTGCCATTATTTCTCCGCAT; Rv, TAGGCAGTTCCTG-GCTCAGT), Igfbp7 (Fw, ATCACTCTGGAGTTCAGCGG; Rv, TCTGAATG-GCCAGATTTTCC), Msx2 (Fw, CATAGACCTGTGCTCCCCAT; Rv, CATC-CATCCTGGAGTCTGGT), Shh (Fw, TCAGAGGTGCAAAGACAAGT; Rv, GACCCTCATAGTGTAGAGAC), Tgfb2 (Fw, ACCTCTACATATGCCAGTGG; Rv, TGTGACTCCAGTCTGTAGGA), and Wnt5a (Fw, GGCCTGATACTCT-TACAAGG; Rv, TAAGAGCCACAGGACTGA). A primer pair for Gapdh was purchased from ABI Inc.
Immunohistochemistry
Immunohistochemistry was performed on formalin-fixed, paraffin-embedded sections (4 mm thickness) of mandibular arch tissue from E9.7 (pre-fusion stage), E10.5 (contact and fusion stage) and E11.5 (post-fusion stage) embryos. The following antibodies were used: anti-mouse Ki-67 (DAKO, Japan), anti-mouse ssDNA (DAKO), anti-mouse Laminin (BTI, USA), anti-human E-cadherin (DAKO), anti-human Igf1 (Lifespan Biosci-ences, USA), anti-mouse Igf2 (Novus Biologicals, USA), anti-human Igf1r (Abcam, Japan), and anti-human Igfbp5 (Santa Cruz Biotechnology, USA). For antigen retrieval, we conducted either enzymatic digestion (0.1% pepsin for 10 min at 37ºC or 0.002% proteinase K for 10 min at room tempera-ture), or microwave exposure in a buffer [10 mM Citric acid (pH6.0)] for 10 min at 90ºC (H2800, Energy Beam Sciences, USA). Immunocomplexes labeled with an AlexaFluor®647-labeled secondary antibody (Invitrogen)
and DAPI-stained nuclei (SlowFade Antifade kit with DAPI, Invitrogen) were detected using confocal microscopy (Zeiss, Germany). Subtraction of background autofluorescence was conducted using a software (TRI-SRF2, RATOC, Japan).
Acknowledgements
This work was supported in part by Grants-in-Aid for Scientific Re-search (#16591842 and #20592157 for Y.T., #17390489 for T.A.) from the Ministry of Education, Science and Culture of Japan. The authors declare no potential conflicts of interest with respect to the authorship and/or publication of this article.
References
review of the literature. J Oral Maxillofac Surg 60: 681-684.
BAILEY LJ, MINKOFF R, KOCH WE (1988). Relative growth rates of maxillary mes-enchyme in the chick embryo. J Craniofac Genet Dev Biol 8: 167-177. BAKER J, LIU JP, ROBERTSON EJ, EFSTRATIADIS A (1993). Role of insulin-like
growth factors in embryonic and postnatal growth. Cell 75: 73-82.
BHATTACHERJEE V, MUKHOPADHYAY P, SINGH S, JOHNSON C, PHILIPOSE JT, WARNER CP, GREENE RM, PISANO MM (2007). Neural crest and mesoderm lineage-dependent gene expression in orofacial development. Differentiation 75: 463-477.
BILLINGTON CJJr, NG B, FORSMAN C, SCHMIDT B, BAGCHI A, SYMER DE, SCHOTTA G, GOPALAKRISHNAN R, SARVER AL, PETRYK A (2011). The molecular and cellular basis of variable craniofacial phenotypes and their genetic rescue in Twisted gastrulation mutant mice. Dev Biol 355: 21-31.
BOBOLA N, ENGIST B (2008). IGFBP5 is a potential regulator of craniofacial skel-etogenesis. Genesis 46: 52-59.
BUCHTOVA M, KUO WP, NIMMAGADDA S, BENSON SL, GEETHA-LOGANATHAN P, LOGAN C, AU-YEUNG T, CHAIANG E, FU K, RICHMAN JM (2010). Whole genome microarray analysis of chicken embryo facial prominences. Dev Dyn 239: 574-591.
CAI J, ASH D, KOTCH LE, JABS EW, ATTIE-BITACH T, AUGE J, MATTEI G, ETCHEVERS H, VEKEMANS M, KORSHUNOVA Y, TIDWELL R, MESSINA DN, WINSTON JB, LOVETT M (2005). Gene expression in pharyngeal arch 1 during human embryonic development. Hum Mol Genet 14: 903-912.
CHAI Y, MAXSON RE (2006). Recent advances in craniofacial morphogenesis. Dev Dyn 235: 2353-2375.
CHAI Y, SASANO Y, BRINGAS P, MAYO M, KAARTINEN V, HEISTERKAMP N, GROFFEN J, SLAVKIN H, SHULER C (1997). Characterization of the fate of midline epithelial cells during the fusion of mandibular prominences in vivo. Dev Dyn 208: 526-535.
CLOUTHIER DE, GARCIA E, SCHILLING TF (2010). Regulation of facial morpho-genesis by endothelin signaling: Insights from mice and fish. Am J Med Genet Part A 152A: 2962-2973.
COBOURNE MT, SHARPE PT (2003). Tooth and jaw: molecular mechanisms of patterning in the first branchial arch. Arch Oral Biol 48: 1-14.
DIEWERT VM, WANG KY (1992). Recent advances in primary palate and midface morphogenesis research. Crit Rev Oral Biol Med 4: 111-130.
FENG W, LEACH SM, TIPNEY H, PHANG T, GERACI M, SPRITZ RA, HUNTER LE, WILLIAMS T (2009). Spatial and temporal analysis of gene expression during growth and fusion of the mouse facial prominences. PloS ONE 4: e8066. FITCHETT JE, HAY ED (1989). Medial edge epithelium transforms to mesenchyme
after embryonic palatal shelves fuse. Dev Biol 131: 455-474.
FLINT DJ, TONNER E, ALLAN GJ (2000). Insulin-like growth factor binding proteins: IGF-dependent and -independent effects in the mammary gland. J Mammary Gland Biol Neoplasia 5: 65-73.
GREENE RM, PISANO MM (2010). Palate morphogenesis: Current understanding and future directions. Birth Defects Res C 90: 133-154.
HANDRIGAN GR, BUCHTOVA M, RICHMAN JM (2007). Gene discovery in cranio-facial development and disease - cashing in your chips. Clin Genet 71: 109-119. HWA V, OH Y, ROSENFELD RG (1999). The insulin-like growth factor-binding protein
(IGFBP) superfamily. Endocr Rev 20: 761-787.
signaling in the neural crest cells regulates the patterning and growth of facial primodia. Genes Dev 18: 937-951.
LIU JP, BAKER J, PERKINS AS, ROBERTSON EJ, EFSTRATIADIS A (1993). Mice carrying null mutations of the genes encoding insulin-like growth factor I (Igf-1) and type 1 IGF receptor (Igf1r). Cell 75: 59-72.
MARTINEZ-ALVAREZ C, BLANCO MJ, PEREZ R, RABADAN MA, APARICIO M, RESEL E, MARTINEZ T, NIETO MA (2004). Snail family members and cell survival in physiological and pathological cleft palates. Dev Biol 265: 207-218. MENG L, BIAN Z, TORENSMA R, VAN DEN HOFF JW (2009). Biological mechanisms
in palatogenesis and cleft palate. J Dent Res 88: 22-33.
MINA M (2001). Regulation of mandibular growth and morphogenesis. Crit Rev Oral Biol Med 12: 276-300.
MINA M, WANG YH, IVANISEVIC AM, UPHOLT WB, RODGERS B (2002). Region- and stage-specific effects of FGFs and BMPs in chick mandibular morphogenesis. Dev Dyn 223: 333-352.
MINKOFF R (1980). Regional variation of cell proliferation within the facial processes of the chick embryo: a study of the role of ‘merging’ during development. J Embryol Exp Morph 57: 37-49.
MORI C, NAKAMURA N, OKAMOTO Y, OSAWA M, SHIOTA K (1994). Cytochemical identification of programmed cell death in the fusing fetal mouse palate by specific labeling of DNA fragmentation. Anat Embryol 190: 21-28.
MUKHERJEE A, WILSON EM, ROTWEIN P (2008). Insulin-like growth factor (IGF) binding protein-5 blocks skeletal muscle differentiation by inhibiting IGF actions. Mol Endocrinol 22: 206-215.
NING Y, SCHULLER AGP, BRADSHAW S, ROTWEIN P, LUDWIG T, FRYSTYK J, PINTER JE (2006). Diminished growth and enhanced glucose metabolism in triple knockout mice containing mutations of insulin-like growth factor binding protein-3, -4, and -5. Mol Endocrinol 20: 2173-2186.
OSUMI-YAMASHITA N, NINOMIYA Y, ETO K (1997). Mammalian craniofacial em-bryology in vitro. Int J Dev Biol 41: 187-194.
PATTEN BM (1961). The normal development of the facial region. In: Pruzansky S, Ed. Congenital anomalies of the face and associated structures. IL: Thomas, Springfield. pp. 11-45.
POLLAK M (2008). Insulin and insulin-like growth factor signaling in neoplasia. Nat Rev Cancer 8: 915-928.
REN H, YIN P, DUAN C (2008). IGFBP-5 regulates muscle cell differentiation by binding to IGF-II and switching on the IGF-II auto-regulation loop. J Cell Biol 182: 979-991. RIZOS M, ROCCA M, MCALARNEY ME, NICOLAY OF, EFSTRATIADIS S (2001).
The quantitative and qualitative analysis of the craniofacial skeleton of mice lack-ing the IGF-I gene. Clin Orthod Res 4: 206-219.
SCHILLING TF (1997). Genetic analysis of craniofacial development in the vertebrate embryo. Bioessays 19: 459-468.
STOTTMANN RW, ANDERSON RM, KLINGENSMITH J (2001). The BMP antagonists Chordin and Noggin have essential but redundant roles in mouse mandibular outgrowth. Dev Biol 240: 457-473.
TUCKER A, SHARPE P (2004). The cutting-edge of mammalian development; How the embryo makes teeth. Nature Rev Genet 5: 499-508.
Akt1 and insulin-like growth factor 2 (Igf2) regulate placentation and fetal/postnatal development
5 yr ISI Impact Factor (2011) = 2.959
Lindsey N. Kent, Shigeki Ohboshi and Michael J. Soares Int. J. Dev. Biol. (2012) 56: 255-261
Insulin-like growth factor binding proteins and mammary gland development
Angara Sureshbabu, Elizabeth Tonner and David J. Flint Int. J. Dev. Biol. (2011) 55: 781-789
Insulin-like growth factor-2 regulates early neural and cardiovascular system develop-ment in zebrafish embryos
Lori Hartnett, Catherine Glynn, Catherine M. Nolan, Maura Grealy and Lucy Byrnes Int. J. Dev. Biol. (2010) 54: 573-583
Fate of cranial neural crest cells during craniofacial development in endothelin-A receptor-deficient mice
Makoto Abe, Louis-Bruno Ruest and David E. Clouthier Int. J. Dev. Biol. (2007) 51: 97-105
Human limb malformations; an approach to the molecular basis of development
Karl-Heinz Grzeschik